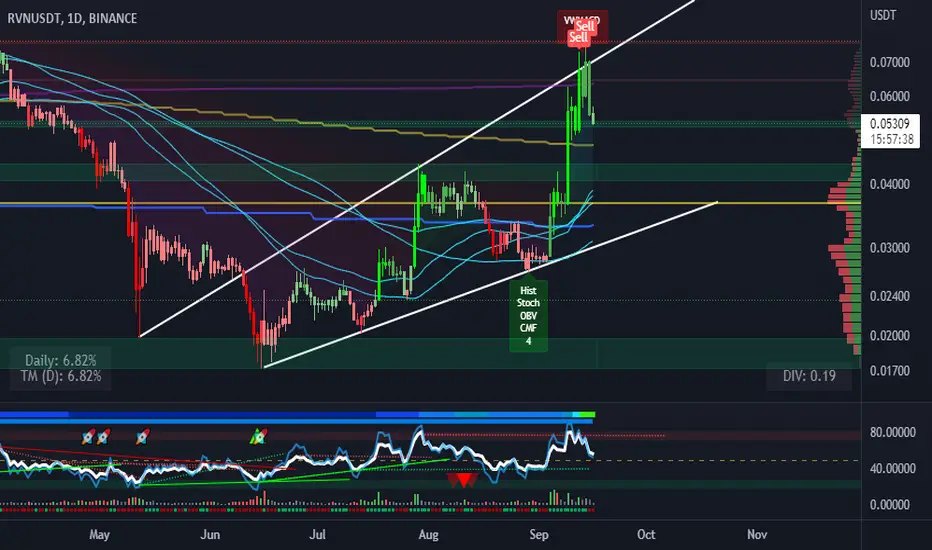
RAVENCOIN well rise !Hi RAVENCOIN traders,
We think RAVEN well rise ... We are buy it for upcoming hours and days ... but we can see a final drop ...
Be careful and apply your strategy
We have VIP analysis and recommendations
We can manage your accounts
You can copy our signals
Good luck
@TradeItDB Team
RVNUSDT trade ideas
Trading opportunity for RVNUSDT - RavencoinBased on technical factors there is a Long position in :
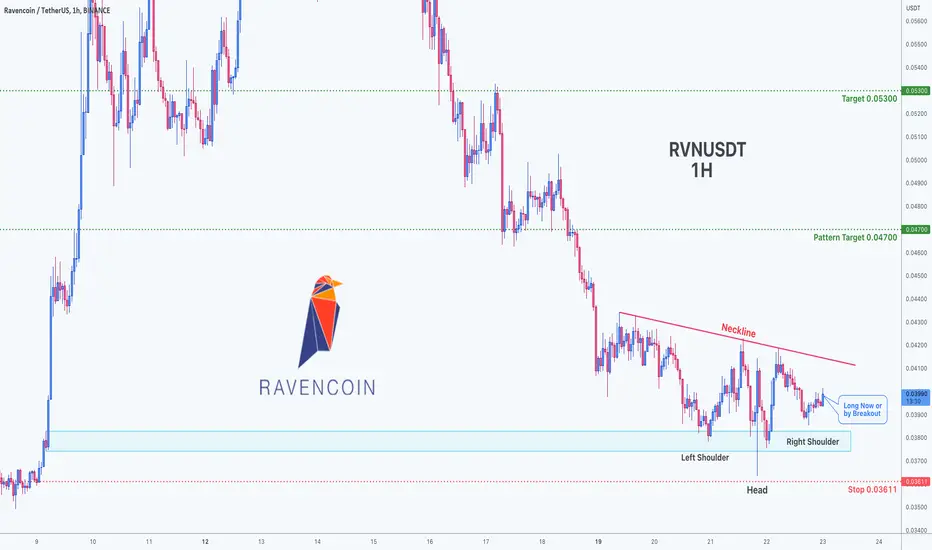
📊 RVNUSDT - Ravencoin
🔵 Long Now or by Breakout
🧯 Stop loss 0.03611
🏹 Target 1 0.04700
🏹 Target 2 0.05300
💸Capital : 1%
We hope it is profitable for you ❤️
Please support our activity with your likes👍 and comments📝
RVN LONG SETUPThis symbol can move from the green area to the targets. riskfree is obligatory after seeing the first target.
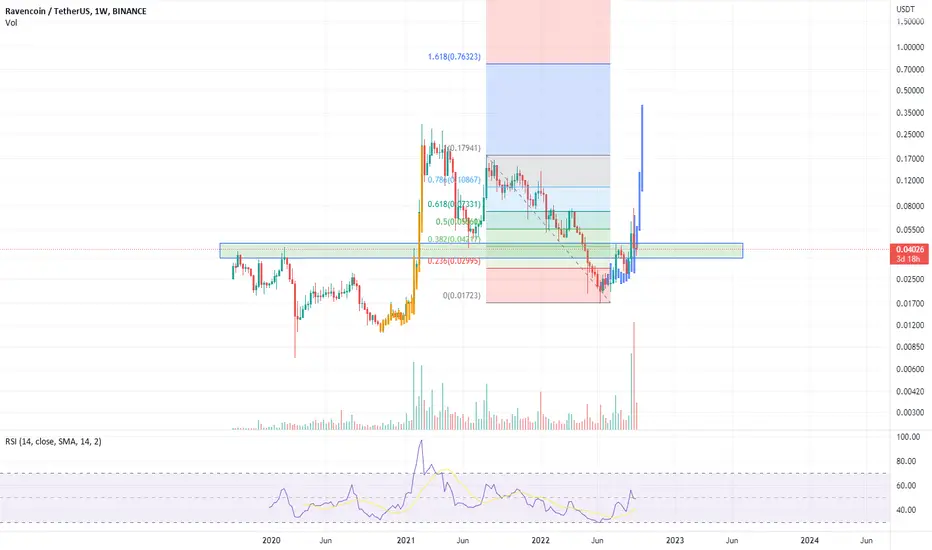
RVNUSDTLooking at Ravencoin, if it can hold current support around 0.036-0.042, we could be seeing a major push up to the 1.618 fibonacci levels @ 0.40 to 0.70. Lose support and we could head lower to 0.25c.
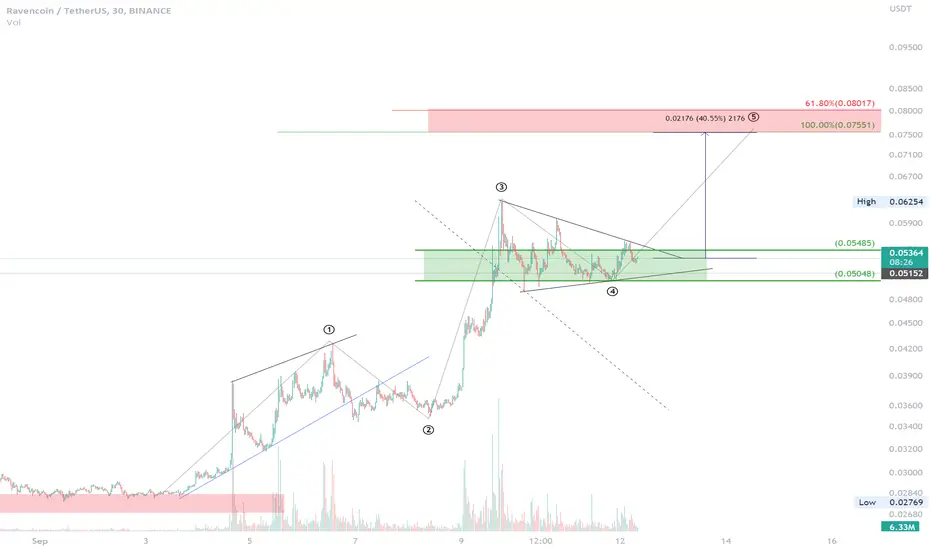
RVNUSDT SHARK PATTERNShark
The Shark pattern is a distinct 5-point reversal structure that was discovered by Scott Carney in 2011. It is similar to the Bat Pattern, except for the C point exceeding the BC leg. It can point to a strong counter-trend move. The potential Reversal Zone (PRZ) is defined by the following harmonic levels: the 0.886 retracement of initial leg and the 1.13 reciprocal ratio of the initial leg. Targets can be various retracements of the CD leg, all the way up to C itself. There are different methods of determining where the stop would go. Some put it beyond the next structure level after the D point, others choose the 1.41 extension of XA.
Conservative traders look for additional confirmation before entering a trade based on an indicator value, a specific candlestick pointing at a reversal or confluence with other methods. The Shark pattern can be either bullish or bearish. It is as effective as other harmonic patterns and a common variation on trading this pattern is to trade the last leg to completion. TradingView has a smart drawing tool that allows users to visually identify this price pattern on a chart.

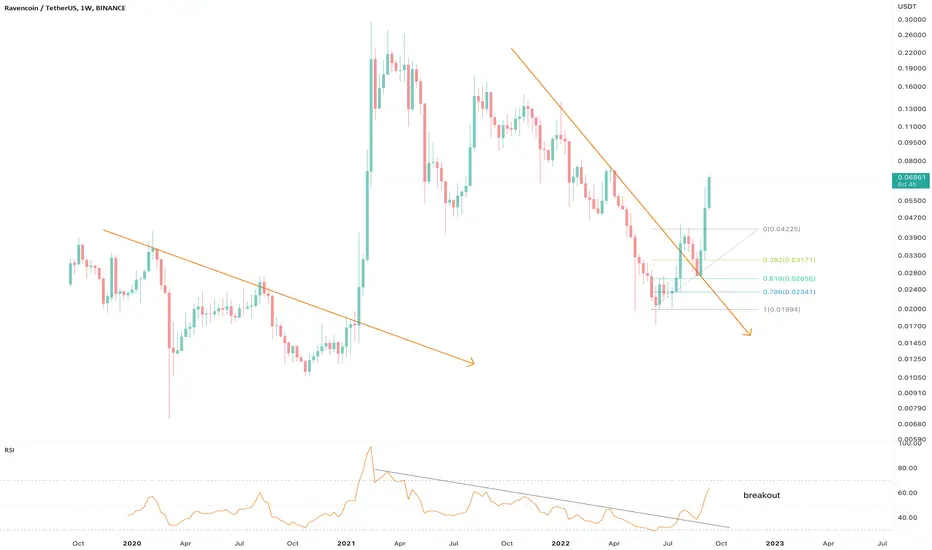
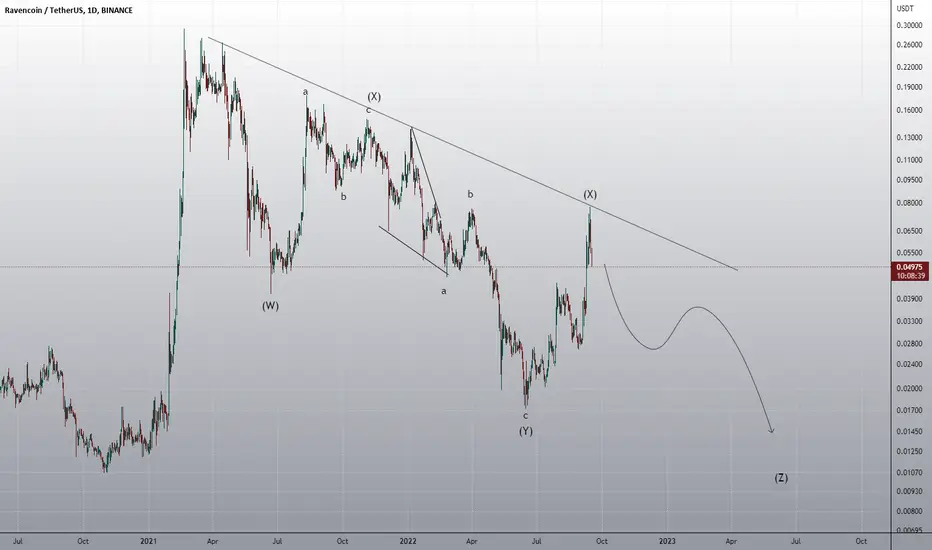
Ravencoin - ridiculous move soon3rd attempt at publishing this idea since the original on September 9th. PineCoders don’t want any of my publications using script I created to be seen on public ideas despite that being the situation for the last 5 years of content published by myself. As such I'm unable to present all the reasons for being bullish on this trade. Such as shame.
The idea has returned 100% so far since the original idea.
On the above weekly chart price action has corrected over 90% since the sell signal. A number of reasons now exist to be bullish , including:
1) The ‘incredible buy’ signal, which has now hidden from public view.
2) The breakouts of Price action, RSI , and Money Flow ( MFI ) resistance.
3) Dragonfly DOJI and Bullish engulfing weekly candles. Fantastic. Was long on this one January last year when the sentiment was fantastically bearish . History is repeating perfectly.
4) On the BTC pair price action recently bounced off the golden pocket. Following that price action recovered the 21-week EMA bull market support band with bullish engulfing candle. (See weekly chart below).
5) On 'what if' list. Easily so.
Is it possible price action falls further? Sure.
Is it probable? No and no.
Ww
Type: trade
Risk: <=6% of portfolio
Timeframe: weeks
Return: 500% until resistance. Will review after that.
1-week BTC pair
1-week golden pocket bounce + bullish engulfing
RVNUSDT longIt is not a good idea to long this week but RVN came to interesting point for me. I use very tight stop very little position size. Good luck

RVN long plan at Blue zone last time, i cancelled long plan for RVN bcz pattern changed
now; waiting for Raven to come blue and ll open LONG.
this myth isnt over yet..
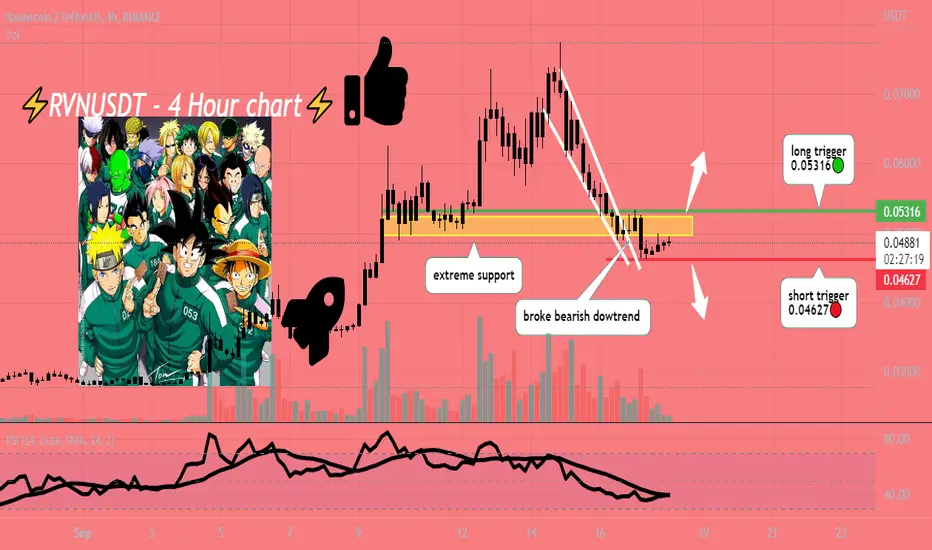
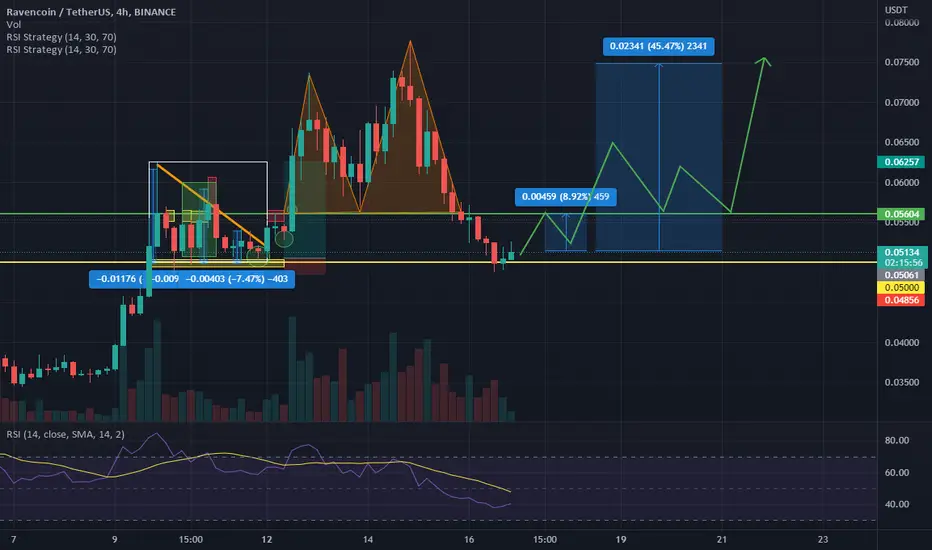
no trigga no trade 💯simple analysis here, currently below strong support zone, but has been in consolidation since breaking bearish downtrend.
watching for break below .04627 for more downside, break back above yellow support/.05316 is my long trigger!
goodluck, like always please drop a boost if you enjoy my work. i appreciate it <3
RVN long - swing As BTC leads the crypto market for this analysis bear the following in mind:
----- BTC is currently in a tight range between 20500's and 18500's.
----- A break above the current highs (20500's) will confirm the narrative for the RVN idea.
----- A break below the current lows (18500's) will see the entire crypto market turn bearish(er)
Based on the current retracement phase undergone by RVN we may expect a mark up to occur.
The 4H imbalance has yet to be triggered and entered in order to complete the full retracement. We may expect some wicks and possible fakeout as part of the 'weak to strong hands' phase (Wyckhoff distribution).
A break below the 0.3670's would invalidate the current trade idea.
The main points of interests (TP's) are situated around the recent highs (0.63355's) and the higher time frame (daily) range laying around the 0.9280's.
Stay safe and never risk more than 1-5% of your capital per trade.
The following analysis is merely a price action based analysis and does not constitute financial advice in any form.

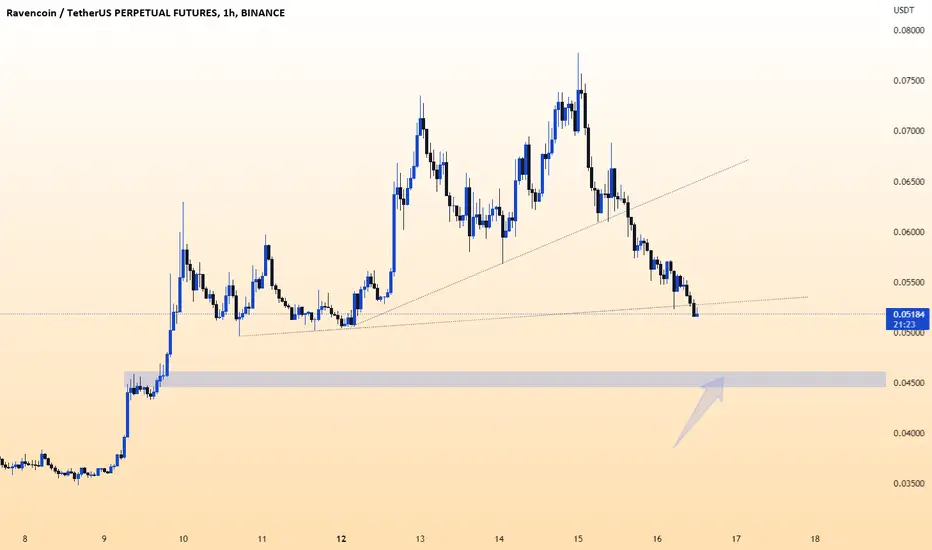
RVN 4H Support This time RVN can bounce for at least 8% from the support. If it goes well for BTC today, it could go even higher. 4H candles seems to be reversal.
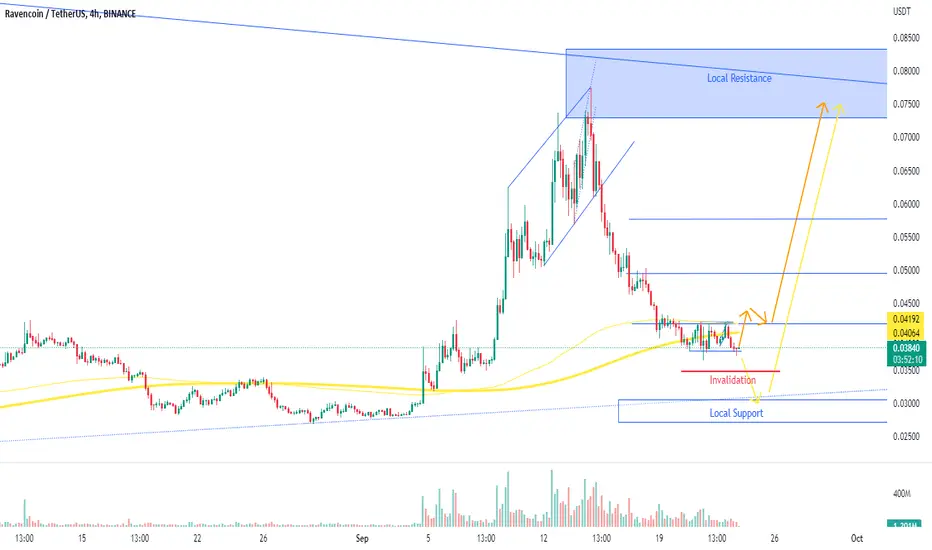
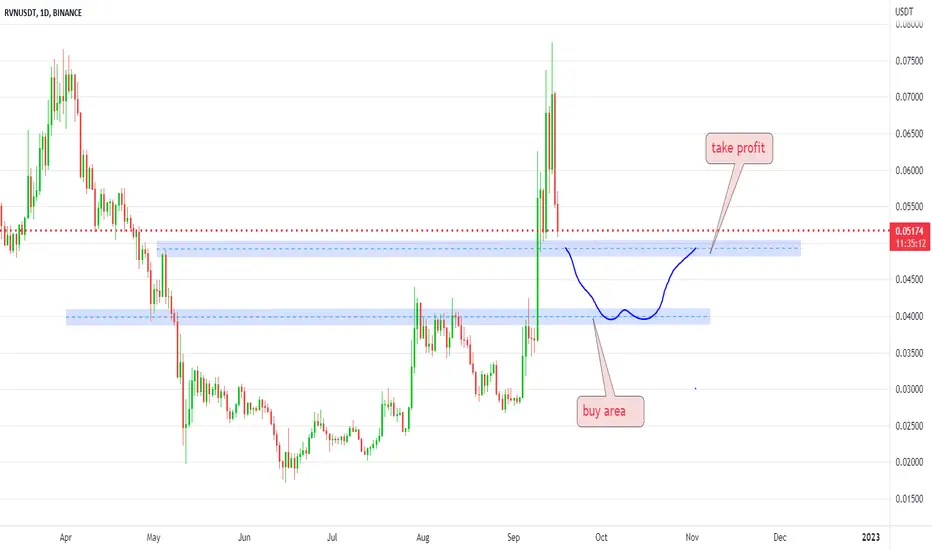
RVNUSDT: where is best buy area?!0.04 is the major level on weekly and daily charts. and can be best buy zone for RVNUSDT.
it will be preferred to take profit ASAP and see if market further heads down or up.
RVNThe price has reached the upper border of the pattern and is starting a correction. Be careful - the price may return to the lower border with small bounces from the indicated support levels

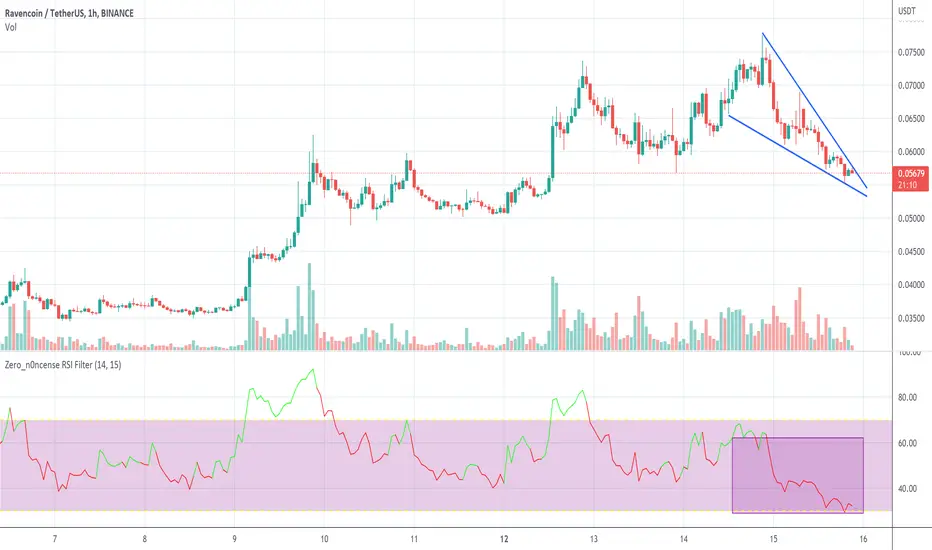
RVN descending wedgeThere is a descending wedge on RVN on the hourly. RSI is currently around 32. A nice reversal up to .07725 is possible, but I will look to take profit at .0712 (resistance level from 9/12). Adding to position at .0745. Invalidation below .052.
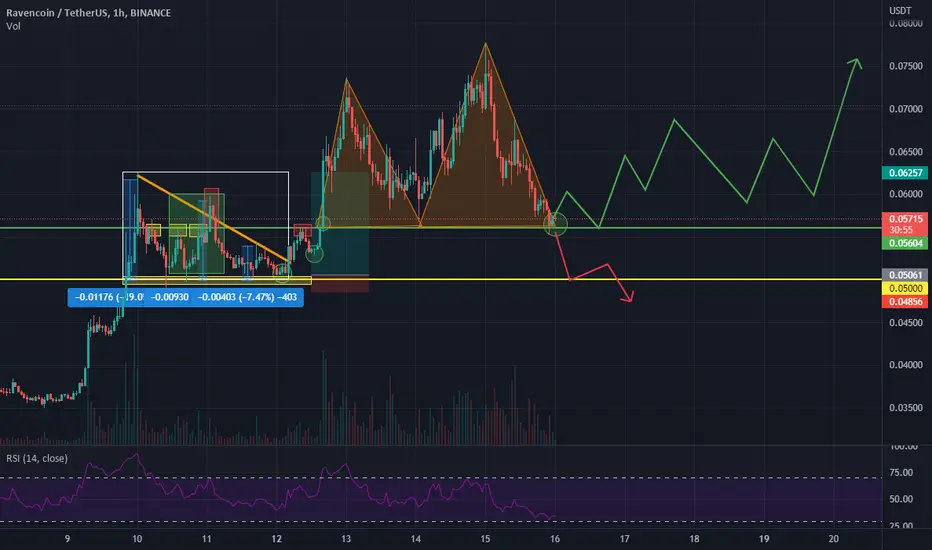
RVN 1H Double Top or Trend ContinueSuccesfully foresaw RVN trend before, but what would happen now? Double top or the rising trend will continue?
Some facts:
1. It's already -30% from the top.
2. Reached support line
3. Divergrence on 30min (can be useful)
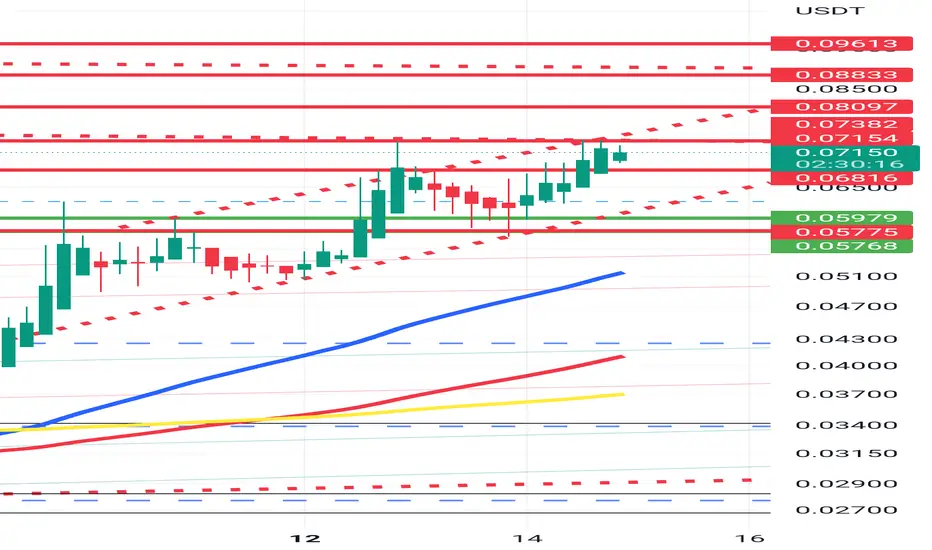

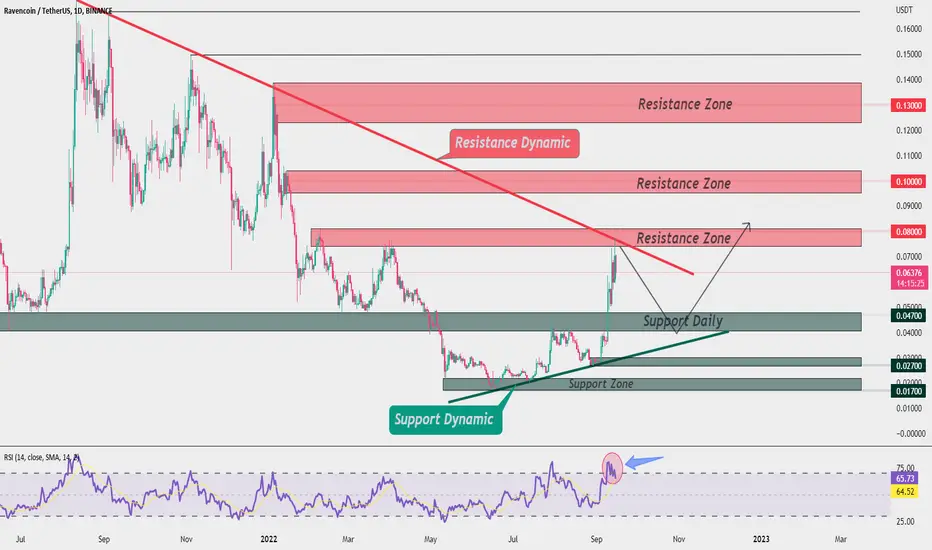
RVN/USDT Analyst Daily 🤭Hi 🖐
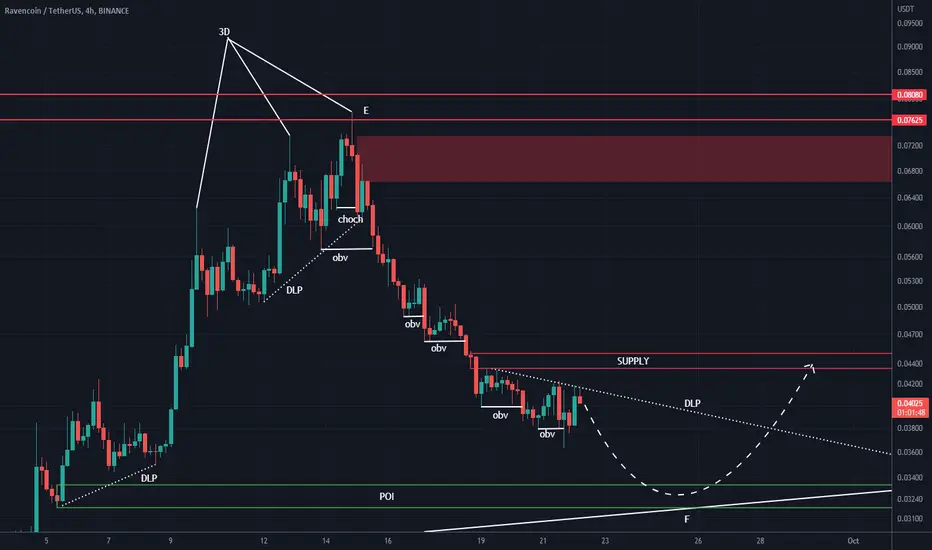
As you can see in the chart, the price was supported in the green range of 0.017 cents, and with the formation of the Dynamic Support trend line, it was able to easily break through the resistance area of 0.047 cents, which has now become a very strong support (Daily Support). Pass in this encrypted.
Currently, the price has reacted to the resistance area of 0.08 cents and we are also witnessing a collision with the dynamic resistance trend line, which coincides with the saturation of the RSI.
The price can experience a correction to the support area of 0.047 cents and continue its upward trend if supported in this daily area.
Resistance areas: 0.08 cents, 0.1 cents, 0.13 cents
Support areas: 0.047 cents, 0.027 cents, 0.017 cents
Aeztoday Team ✔🌟
rvn
⚡️⚡️ #RVN/USDT ⚡️⚡️
Exchanges: Binance Futures 🚀
Signal Type: Regular Short
Leverage: Cross (X20)
Amount:0.50%
Entry Targets:
1) 7290
2) 7536
3) 7783
Take-PrOfit Targets:
1) 6427
2) 5799
3) 4623
4)
5)
6)
7)
8)
9)
Stop Targets:
1) 8014
CORNİX🧚Free signal 🧚 Signal Spot Futures !
