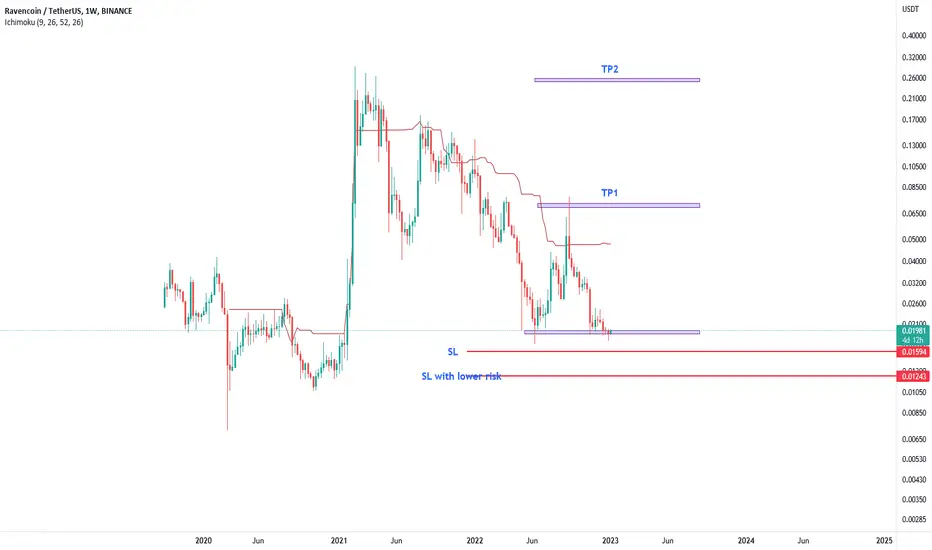
RVNUSDTI believe RVN is very bullish , it is close to it's SL and far away from it's TP , so it has great R/R ratio
RVNUSDT trade ideas
RVNUSD | The chart doesn't look good...Hello trader Today I have prepared a new idea for you. Like and subscribe to the channel there is a lot of useful information✅
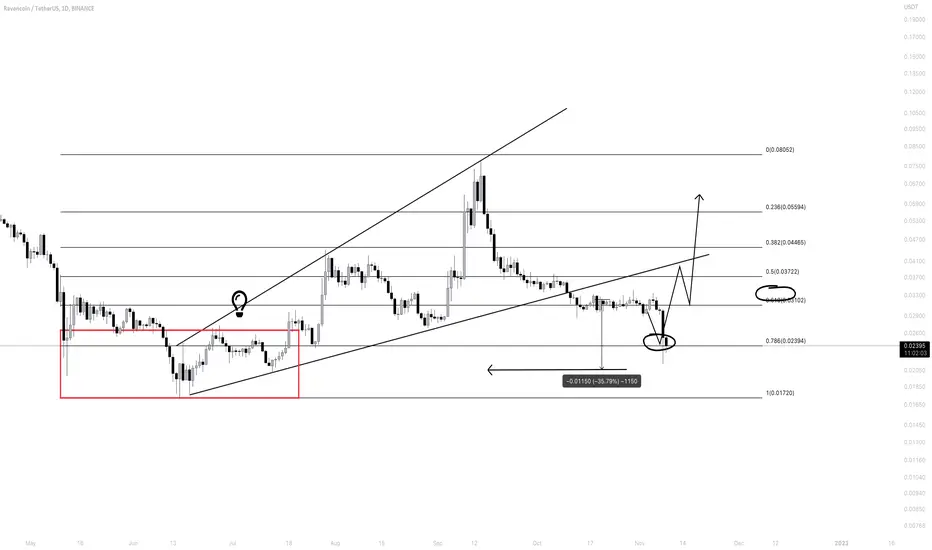
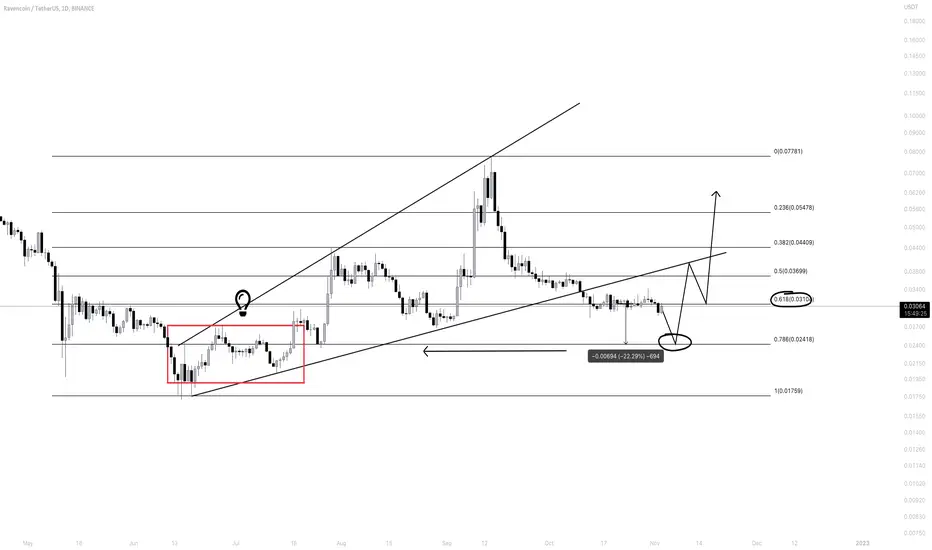
Guys, I haven’t written anything on this asset for a long time, let’s talk a little in a place.
If you open the 1D time frame, there will be a clear picture of the fact that the correction to the 0.017-0.015 zone will continue very soon. I showed a 2D chart so that you can see the zone that I highlighted with a red rectangle, this is where you can approximately expect the asset to stop and where a rebound is most likely to occur.
The approximate zone where the asset can come in the fall of BTC and ETH is $ 0.015-0.012 accumulation zone (red rectangle) in 2020-2021, it is from there that the buyer’s reaction may be.
I'm still watching all the altcoins from the sidelines, if I'm waiting for another market dump, it's better to watch.

Selling RVNHello traders!
Welcome back to another episode with Analyst Aadil1000x.
Today we are taking the benefit of the sell structure and selling with tight stoploss.
Sell RVN now, its at 0.02021
Stoploss 0.0203(-0.5%)
Target 1, 0.01975(+2.15%)
Final Target 0.01922(+4.8%)
Don't forget to hit the like button and follow to stay connected

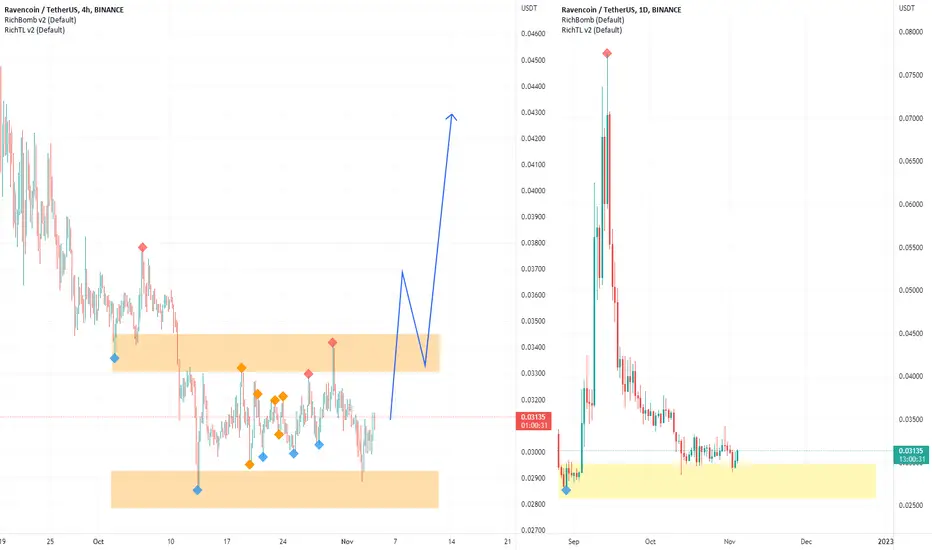
Another RVN Short Position Scenario with R/R 3.3!According to past records, we got good profits from this digital currency in selling positions, and this time the downward movement can be the last downward movement to reach the specified goals.
This movement has 2 important ranges, the first one is the specified range of $0.0207 and a little above it is the 4-2 downtrend line, which is a specific position for us to detect a trend change.
As long as the price is below this range, in accordance with the capital management and the loss limit, it is similar to the positions offered in two points and entered into the sale transaction and following the trend until the specified lower targets.
As a result, any upward movement seen in this range of currency can be a good opportunity to add to the volume of sales transactions.
Pay attention, in this type of positioning, we enter into the transaction with the same volume at two points, so that our average finally creates a transaction with a risk-to-reward of 3.3, which is reasonable.

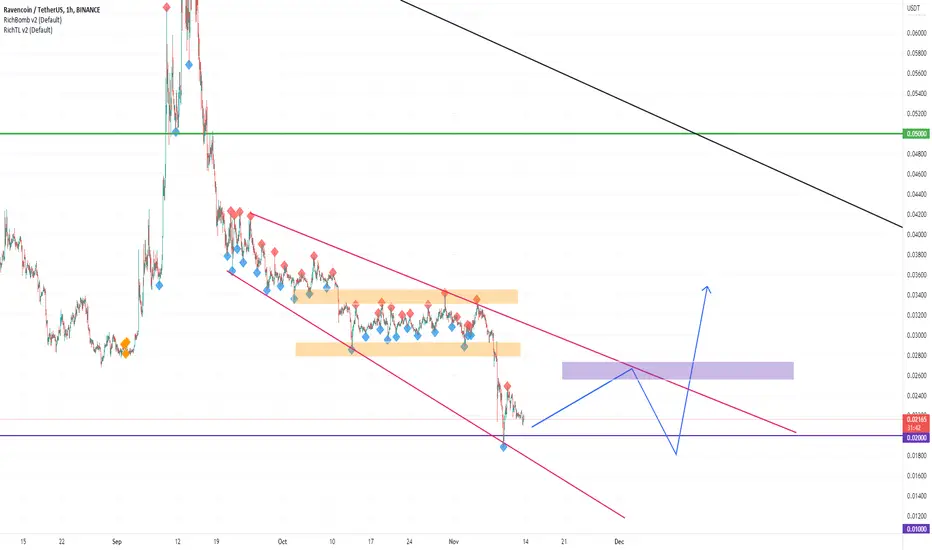
RVNUSDT is testing the support
The price is testing the key level after a clear breakout as i told you in my previous idea
How to approach it?
IF the price is going to lose the support, According to Plancton's strategy , we can set a nice order
–––––
Keep in mind.
🟣 Purple structure -> Monthly structure.
🔴 Red structure -> Weekly structure.
🔵 Blue structure -> Daily structure.
🟡 Yellow structure -> 4h structure.
⚫️ black structure -> <= 1h structure.
–––––
Follow the Shrimp 🦐

RVN WAITING FOR A BREAK!Hello Traders, I am Hadi Karaali, Known as SNIPERS_FX
If you like the idea, do not forget to support with a like and follow.
RVNUSDT, as we clearly see price is trading inside this broadening falling channel
However, we are around a massive support zone where we are searching for buy setups
The same scanrio is repeating now!
We got stuck inside this range again for the bulls to kick in we need a break above the upper bound of the range
Then a movement higher would be expected
Unless the previous scenario happened here, and we broke below then a movement lower to dive inside the support
Let's monitor before we jump in
And as usual follow your trading plan and manage your risk.
Don't forget to support with like and follow if you like the content
Be patient and good luck!
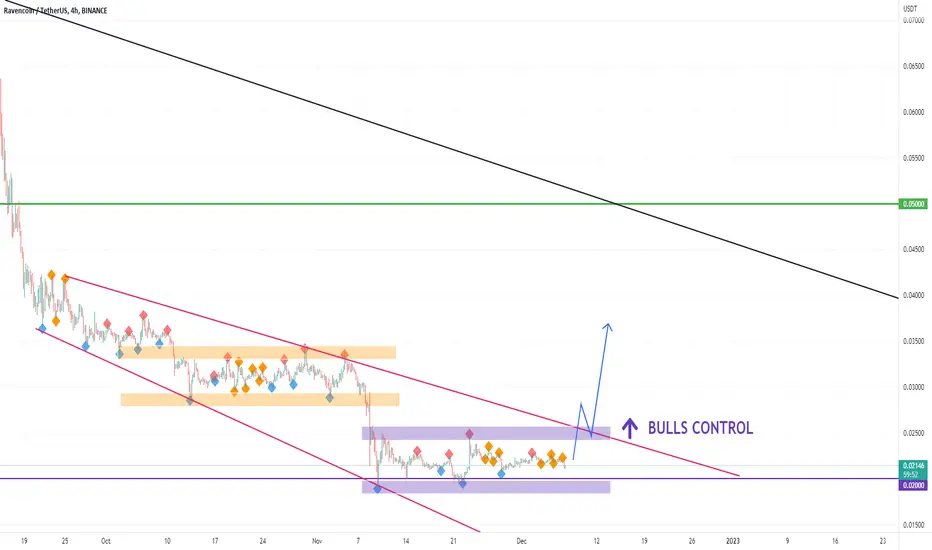
TL resistance is strong ! 🔴we continue to struggle at extreme trendline resistance area, for now bearish bias is logical 👍
Watch for break below .0185 for more downside, break above .0265 for parabolic upside move 🥶

RVN / USDT Long TradeExpecting a zig zag or 1-2-3 to the upside. Targets are conservative, but I prefer to stick to my strategy.

rvn trade3. TRANSITION PLAY
01 - Initiation Signals
Divergence/Convergence Is Present (Left Hand Or Right Hand)
Rsi 30 At 30 For Bullish Convergence Traders
Tradeline Breakout Ccc
2 Holding
Patience And A Lot Of Patience
3. Selling Signals Of Spot Trade Or Buy-Long
Macd Bearish Cross
Macd Buying Pressure Weakening
.618 Resistance
RVN WAVES (The correction continues)I think we are in for a big drop that could push the price down further. From where I announced, we can move upwards

RVN GO TO HELLAlthough this currency has good fundamentals, I think it has a lot of potential to fall. Do not forget stop and capital management.
RVN Short Position ScenarioSimilar to what we said with the Bitcoin scenario in the following analysis:
The corrective wave 2 of the RVN symbol can also have corrective reactions from the specified Fibo range. To better understand this start of the movement, we have drawn the trend line formed by this wave. By breaking and stabilizing below this trend line, we enter into a sell transaction or sell within the specified Fibonacci range.
The 3rd wave can be fast and powerful and come with lower prices.

RVN AROUND A MASSIVE SUPPORT !Hello Traders and everyone, I hadi karaali, Known as Snipers_FX
If you like the idea, do not forget to support with a like and follow.
RVNUSDT, as we clearly see price trading inside this falling broadening wedge making clean higher highs and higher lows
From a medium-term perspective
So for now, what!
For now, and as the price will be approaching our massive support zone, we will be searching for new longs right!
so, as the price is trading inside this channel, we need a new swing high around the trendline as shown in the picture
Then a break above
Then we can say yes the bulls are kicking in again
Until that happens price can stil dive more to form another bullish reversal, Let's see how it goes
and as usual follow your trading plan and manage your risk.
Be patient and good luck!
RVNUSDT is testing the supportThe price is creating a bear flag above the 0.030$ area.
now the market lost the dynamic support and the price is testing the static support at 0.30$
How to approach it?
IF the price is going to have a breakout and retest the support as new resistance, According to Plancton's strategy , we can set a nice order
–––––
Keep in mind.
🟣 Purple structure -> Monthly structure.
🔴 Red structure -> Weekly structure.
🔵 Blue structure -> Daily structure.
🟡 Yellow structure -> 4h structure.
⚫️ black structure -> <= 1h structure.
–––––
Follow the Shrimp 🦐

Waiting for the pullback from the strong resistance levelWaiting for the pullback from the strong resistance level that previously served support. Points of control do not let the price go higher. Activity of buyers is decreasing. Target - 0.021

RVNUSDT|Get ready to buy back soon!Hello trader Today I have prepared a new idea for you. Like and subscribe to the channel there is a lot of useful information✅
▫️Recently, I shared with you the forecast for tradingview with the RVN coin and said that I expect a continuation of the correction to the $0.02573 zone and went a little lower.
▫️No one believed, well, it happened, the asset made another -20% and I think the correction against the background of a possible fall in #BTC and #ETH will continue, so we can expect a trip to the $0.02-0.0195 zone (approximate zone for paying off on spot)
▫️In general, while we are watching from the outside, I do not advise you to open risky positions now LONG / SHORT, you will not earn anything quickly in such a market, but you can only quickly lose. Patience!
SHORT - RVN dump to 0.028SHORT - RVN dump to 0.028 with technical analysis and fibo
look at to chart...
1ST Target : 0.028
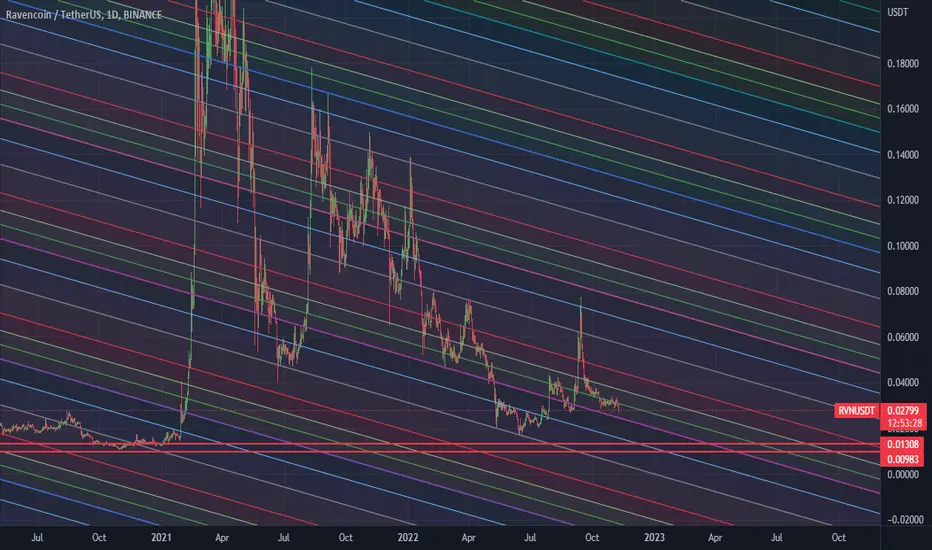
RVN ChartRVN Fib channel
What Is a Fibonacci Channel? The Fibonacci channel is a technical analysis tool that is used to estimate support and resistance levels based on the Fibonacci numbers. It is a variation of the Fibonacci retracement tool, except with the channel the lines run diagonally rather than horizontally.
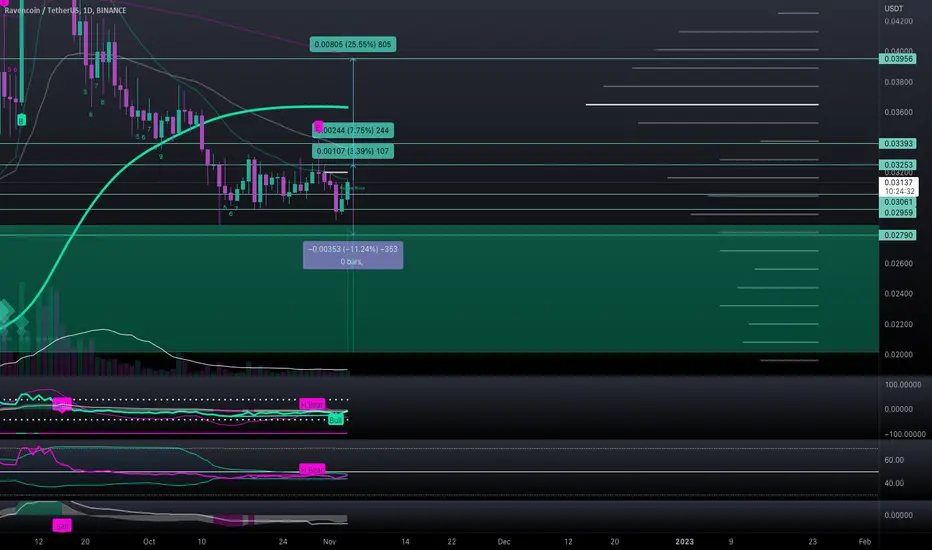
#RVN/USDT - Long - Potential 25.55%#RVN/USDT provided by the pro trader BlockParty SPOT|USDT
Strategy: Long
Exchange: Multi-Exchange
Account: Spot
Entry mode: DCA Limit
Invest: 5%
Exit:
Target 3 : 0.03956 30.5%
Target 2 : 0.03393 11.92%
Target 1 : 0.03253 7.31%
DCA Entries
Entry 1: 0.03147 - 25%
Entry 2: 0.03061 - 25%
Entry 3: 0.02959 - 50%
Current market price: 0.03146
Stop: 0.0279 (-7.97%)
Technical indicators:
24h Volume: 5053189.147589
Satoshis: 0.03146
Bullish divergence, bounce from support chasing BTC breakout
Trade: RVNUSDT 04/11/2022 13:31
Account: SPOT
Volume last 24h: 5053189.15 USDT
RVN WAITING FOR A BREAK !Hello Traders and everyone, I AM HADI KARAALI, KNOWN AS SNIPERS_FX
If you like the idea, do not forget to support with a like and follow.
RVNUSDT, as we can see from daily time frame price is clearly overall bearish
However, price now is approaching a massive demand zone where we will be searching for buy setups
So for now what !
For now and as we can see price is trading inside this range for the bulls to kick in from a short term bullish reversal we need a break above this major swing high
until that we are still bearish if the price managed to break below
Then a further movement lower would be expected to the next support zone
and as usual follow your trading plan and manage your risk.
Be patient and good luck!
RVNUSD | Soon you will be able to buy!Hello trader Today I have prepared a new idea for you. Like and subscribe to the channel there is a lot of useful information✅
For a long time I have not written anything on this coin, guys, I have not forgotten about RVN! Just waiting for the continuation of the correction.
As I said earlier that the asset can be bought below the zone of the expanding triangle, the asset has broken through the lower boundary and now the $0.03056 zone is a local resistance zone.
I am waiting for the continuation of the correction to the zone of $0.02573-0.02750 in this zone, you can start actively buying back!
Regarding the short position from the current 20% as an option, but I'm out of position!
Ravencoin RVN bullish ahead of the FOMC Press ConferenceI am bullish on Ravencoin RVN ahead of the FOMC Press Conference.
Those are my price targets:
RVN/USDT
Entry Range: $0.029 - 0.031
Price Target 1: $0.037
Price Target 2: $0.044
Price Target 3: $0.051
Stop Loss: $0.025

Rvn short ideaThere is a bearish MSB 1H
I checked 4H and 1D charts ant its valid. Need to try if price comes my area.
