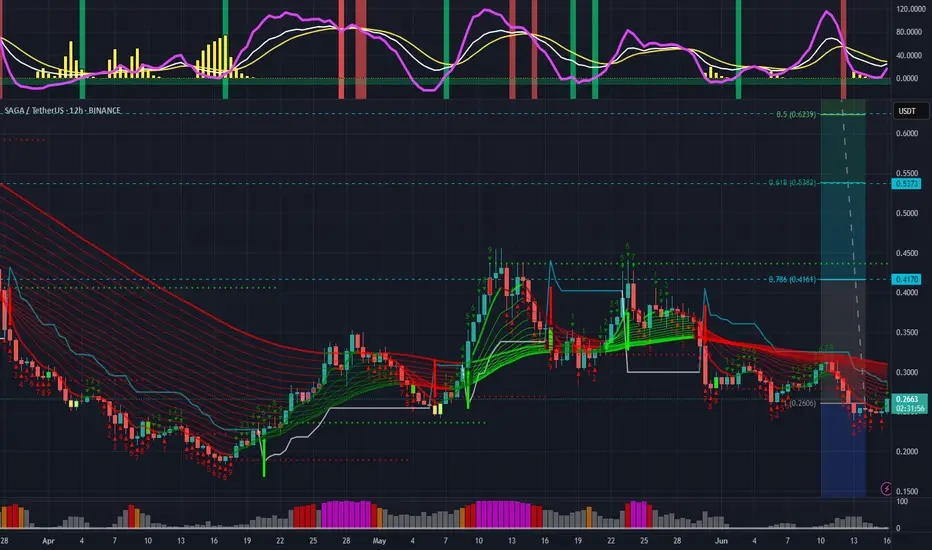
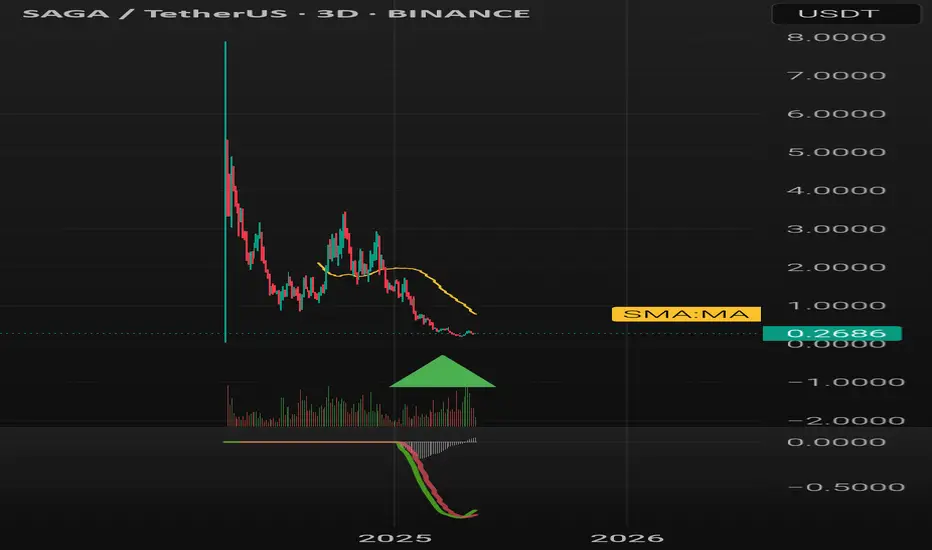
SAGA (can pump like ALT did?)SAGA and similar cycle-growth coins (not necessarily same sector or area)
More from a perspective from a similar chart pattern and also similar listing date/period
For more details please give a comment
we have many bullish indicators as well > KDJ
Also look at
AEVO XAI and so on. DYM MANTA ACE AI
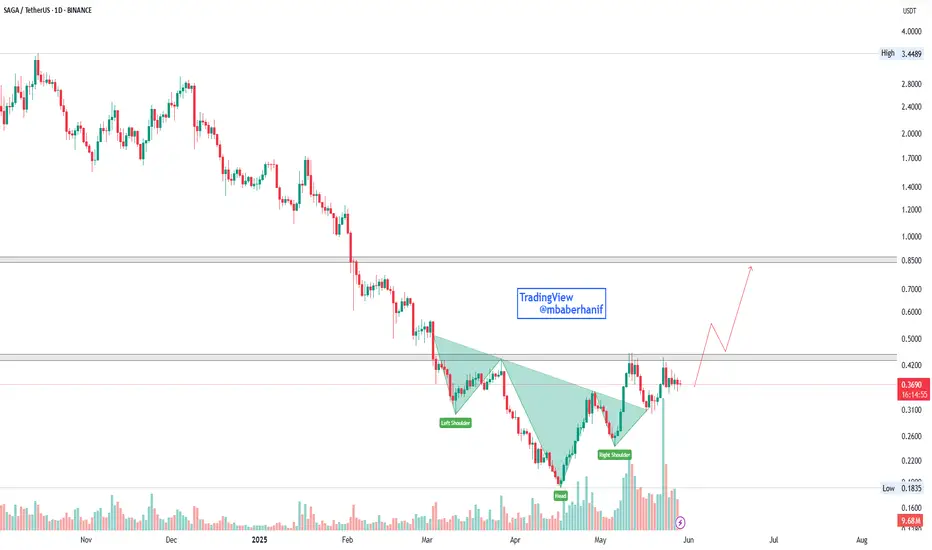
SAGA | Inverse Head & ShoulderOn the daily timeframe, SAGA/USDT is presenting a bullish reversal pattern in the form of an Inverse Head and Shoulders, further validating the its high green volumes. This is a classic technical signal that often precedes a significant trend reversal, especially after a prolonged downtrend like the
SAGA SHORT RESULT SAGA price rejected from minor Support level due to Pump in BTC and Altcoins Generally.
Took a little hit on this one, wasn't paying attention to it actually, would've closed at the break out of the first resistance Trendline.
But it's part of trading. Better Setup and profits coming soon.
_THE_KLA

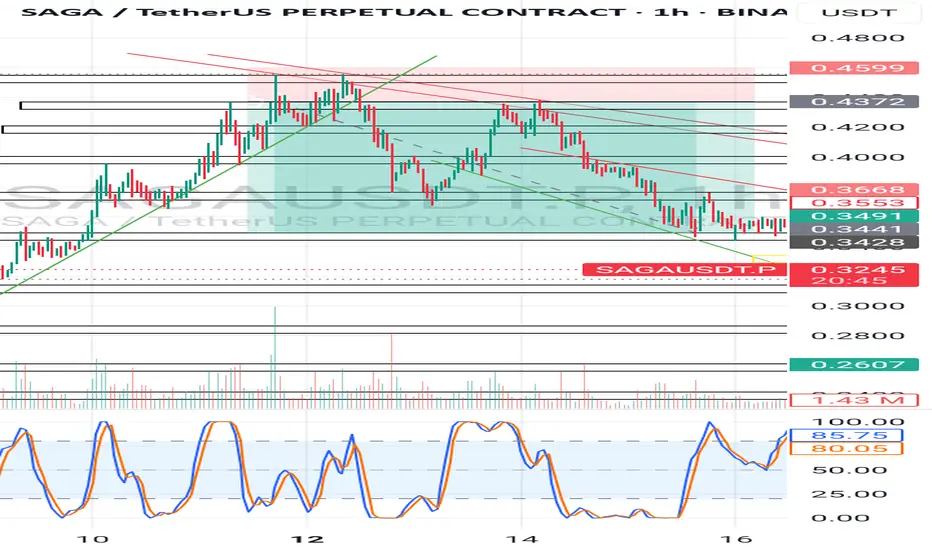
SAGA SHORT SETUPSAGA Price is consolidating within the range of a Falling Expanding Wedge Pattern, after the major dump ,So I decided to open the Short within the resistance and support ranges of the pattern.
It's still running, so we'll see how it goes.😉

SAGA SHORT RESULTSAGA price was still in a Bullish trend when I opened this short position, because it already started showing minor signs of weakness and that's why I decided to short anticipating the The Breakdown of the Ascending Trendline Support.

SAGAUSDT 1D#SAGA has broken out above the broadening wedge pattern on the daily chart with strong volume. Currently, it is retesting the pattern. In case of a successful bounce, the targets are:
🎯 $0.5651
🎯 $0.8232
🎯 $1.2156
🎯 $1.5327
🎯 $1.8498
⚠️ Use a tight stop-loss.

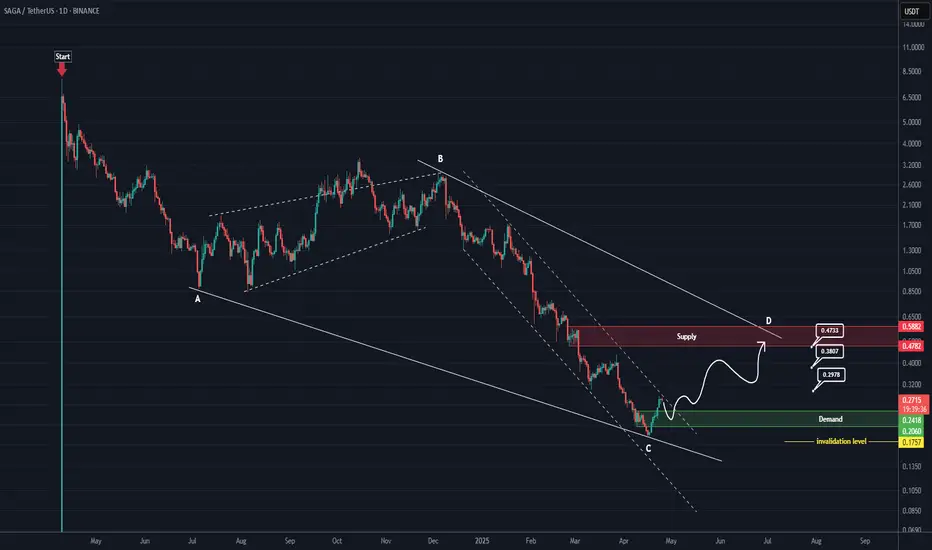
SAGA RoadMap (1D)From the point where we placed the red arrow on the chart, it appears that SAGA's correction has begun.
This correction seems to be either a diametric or a symmetrical pattern. Now, considering the extended duration of wave C, its relative comparison with the other waves, the heavy drop, and the fo
SAGAUSDTNow is the time to buy and hold with low risk.
Target: 0.70
Stop-loss: Weekly candle close below 0.17
I'm just sharing my personal opinion to help us all better understand the market’s potential.
Always do your own research before investing — don’t rely solely on my view as a beginner, or anyone el
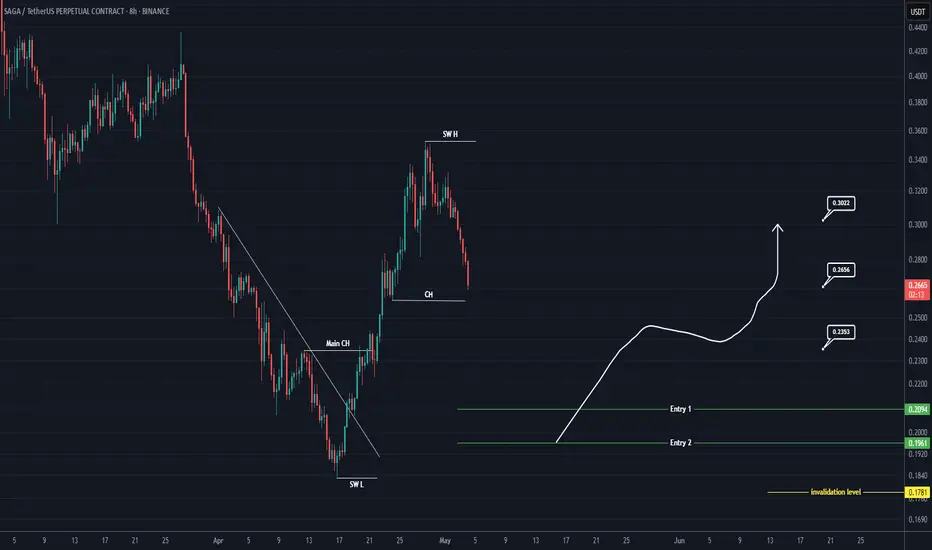
SAGA Rebuy Setup (8H)A strong move has formed, and we have a bullish CH (Change of Character) on the chart.
We can look for buy/long positions around key zones, as buyers are present in these areas.
We are focusing on buy/long positions at the entry points.
Targets are marked on the chart.
A daily candle close below
See all ideas
Summarizing what the indicators are suggesting.
Oscillators
Neutral
SellBuy
Strong sellStrong buy
Strong sellSellNeutralBuyStrong buy
Oscillators
Neutral
SellBuy
Strong sellStrong buy
Strong sellSellNeutralBuyStrong buy
Summary
Neutral
SellBuy
Strong sellStrong buy
Strong sellSellNeutralBuyStrong buy
Summary
Neutral
SellBuy
Strong sellStrong buy
Strong sellSellNeutralBuyStrong buy
Summary
Neutral
SellBuy
Strong sellStrong buy
Strong sellSellNeutralBuyStrong buy
Moving Averages
Neutral
SellBuy
Strong sellStrong buy
Strong sellSellNeutralBuyStrong buy
Moving Averages
Neutral
SellBuy
Strong sellStrong buy
Strong sellSellNeutralBuyStrong buy
Displays a symbol's price movements over previous years to identify recurring trends.