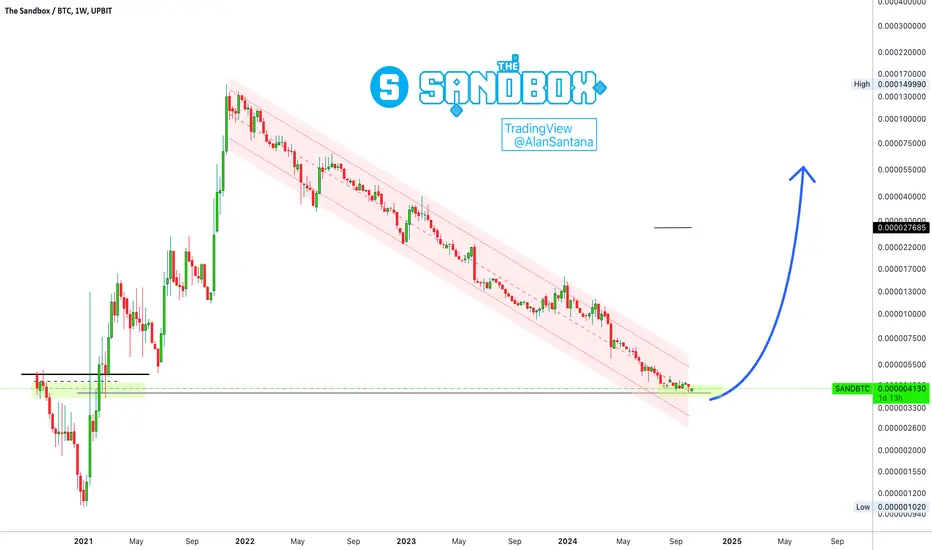
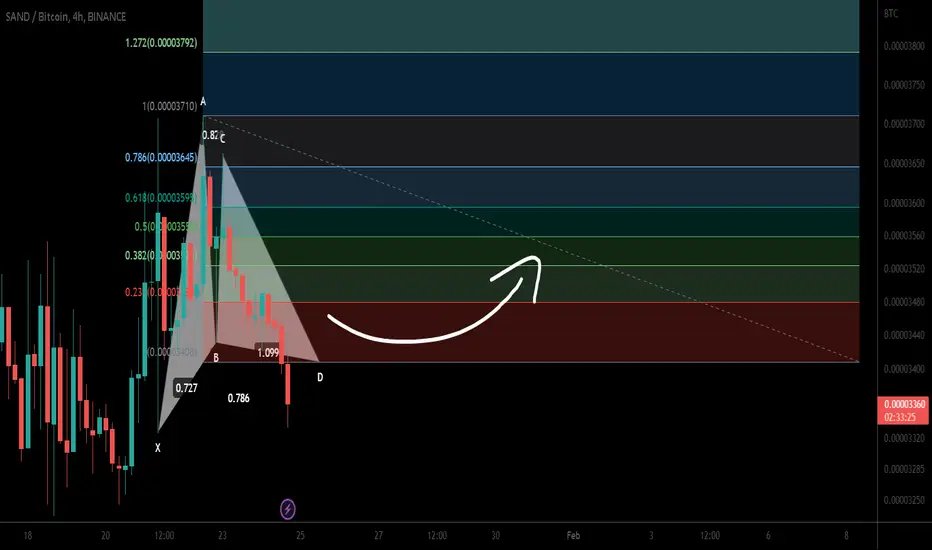
The Sandbox Grew 14,605% In 2021 vs Bitcoin —What About 2025?Do you believe that this pair will continue going down forever?
If you answered no, I agree, it won't go down forever and right now it seems a great time, a great price and a great level to see this market turn.
Good morning my fellow trader, I hope you are having a wonderful day.
Here we have Th
Related coins
Expected move on sandbtc2 cases:
1. A dump directly into the monthly & VAL getting a big upside rally which could possibly form a range sideways.
2. A rally before a dump with a tap unto the said level which would likely be a start of a bull run.

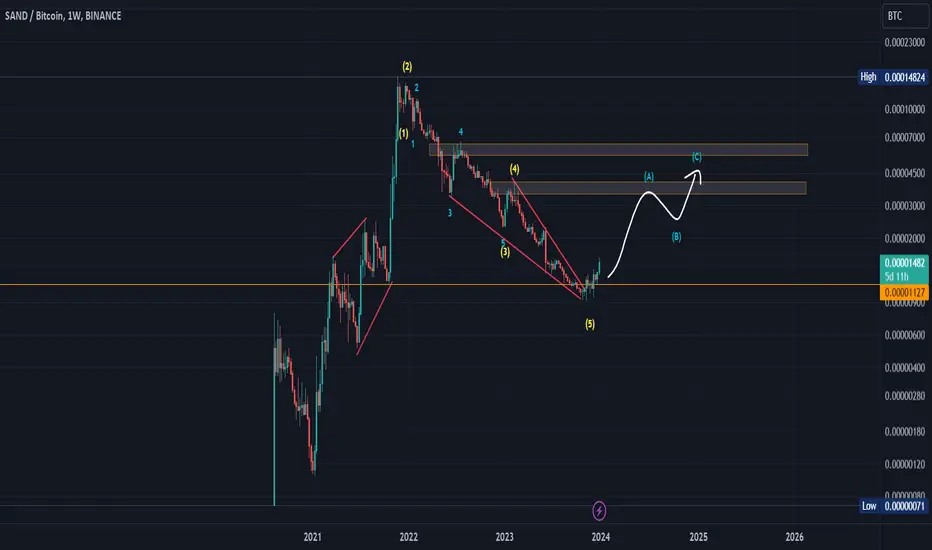
SANDBTCThere was a decline in five waves with internal extensions, and now it is possible to make a rise in three waves of correction for the shaded areas.
All data on the chart.. Good luck
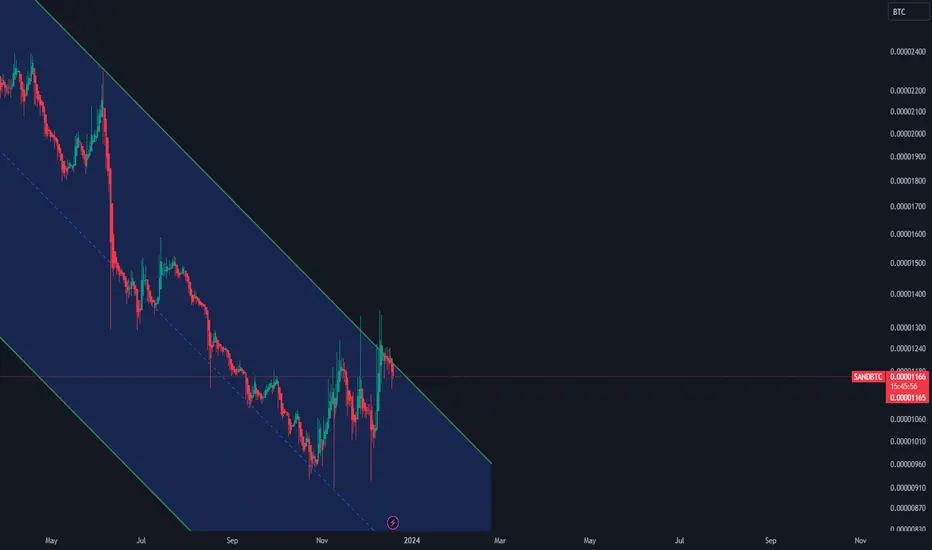
SANDBTCSANDBTC reaching the top of the descending channel. Will be looking for a possible entry short within the next few days. Short but sweet and as always its not financial advise so its not.
The Sandbox (SAND) formed bullish BAT | A good buy opportunityHi dear friends, hope you are well and welcome to the new trade setup of The Sandbox (SAND).
Previously I shared a long-term trade setup for SAND, which is still in play as below:
Now on a 2-hr time frame, SAND is about to complete a bullish BAT move for the bullish reversal move.
Note: Abov

Don't get caught playing in the sandboxDescending channel on the daily chart with 50 day MA touching top of channel just as trend entering the ichimoku cloud. If you look back along the channel both times the ich cloud has been entered it has lead to a further move downwards. With the macro looking pretty bad with the SEC going after the

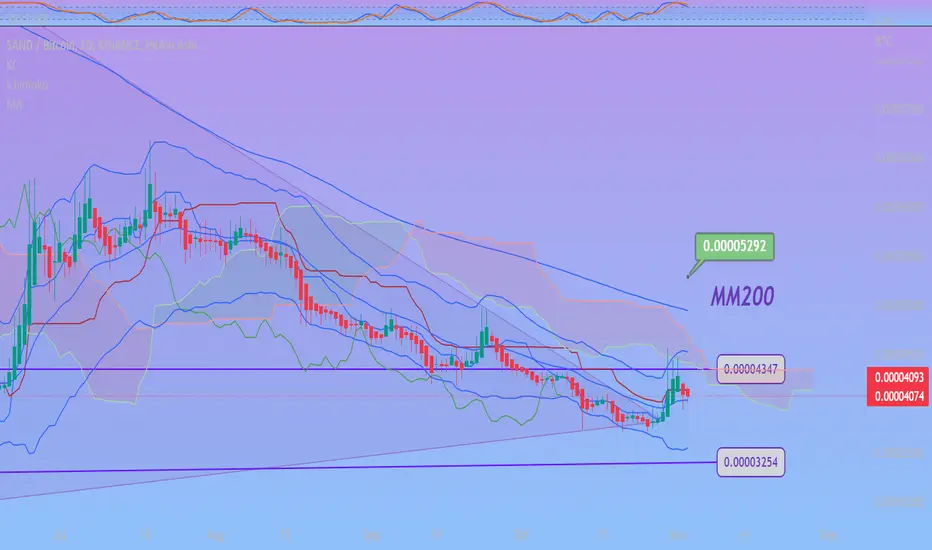
SANDBTC 1DThe SAND after being trapped in a falling wedge for a long period has finally broken out. Now it needs to pass the resistance of 0.00004347 , the ichimoku cloud and MM200, which at first appear to be strong resistances, but also act as a “magnet” pulling SAND up. The pair alone is worth the hold. Ma
Theta coin formed a bullish Gartley | A good buy opportunityHi dear friends, hope you are well and welcome to the new trade setup of The Sandbox (SAND).
Previously I shared a long-term trade setup for SAND, which is still in play as below:
Now on a 4-hry time frame, SAND with BTC pair has formed a bullish Gartley pattern for another pump soon.
Note: A
SANDBTC possible break out!!As you can see on chart sand is standing in very important region…btc pair looks relatively good and there is a high possibility of breaking out…similar pattern is visible in USDT chart as well which increases the probability of sand breaking out and bouncing to the regions depicted on the chart…let

SANDBTC 1DSANDBTC in triangular formation, like all metaverse tokens the SAND has dropped, but institutional funding continues which indicates a brief upward burst once the metaverse market warms up again. Its next resistance is at 0.00004347 and its support at 0.00003254. The profitt will occur as soon as th

See all ideas
Summarizing what the indicators are suggesting.
Oscillators
Neutral
SellBuy
Strong sellStrong buy
Strong sellSellNeutralBuyStrong buy
Oscillators
Neutral
SellBuy
Strong sellStrong buy
Strong sellSellNeutralBuyStrong buy
Summary
Neutral
SellBuy
Strong sellStrong buy
Strong sellSellNeutralBuyStrong buy
Summary
Neutral
SellBuy
Strong sellStrong buy
Strong sellSellNeutralBuyStrong buy
Summary
Neutral
SellBuy
Strong sellStrong buy
Strong sellSellNeutralBuyStrong buy
Moving Averages
Neutral
SellBuy
Strong sellStrong buy
Strong sellSellNeutralBuyStrong buy
Moving Averages
Neutral
SellBuy
Strong sellStrong buy
Strong sellSellNeutralBuyStrong buy
Displays a symbol's price movements over previous years to identify recurring trends.