THE SANDBOX mid - to long - termThis might seem obvious to some, but it’s worth emphasizing —
📌 When analyzing charts like this, switch to a Line Chart instead of Candlesticks.
Why?
It filters out market noise and shake-outs
You can clearly see how price respects key zones and levels
Candles often distort the picture with wicks
Key stats
About SAND
The Sandbox was initially just a mobile gaming smash hit created in 2011. In 2018, however, developer Pixowl scaled it up to become a blockchain-based game, and, two years later, native token SAND had its initial coin offering. The transition to blockchain technology was motivated by the ethos of wanting to provide creators with true ownership of their creations via NFTs, while also creating an in-game currency where users can play-to-earn and foster a self-sufficient economy.
Related pairs

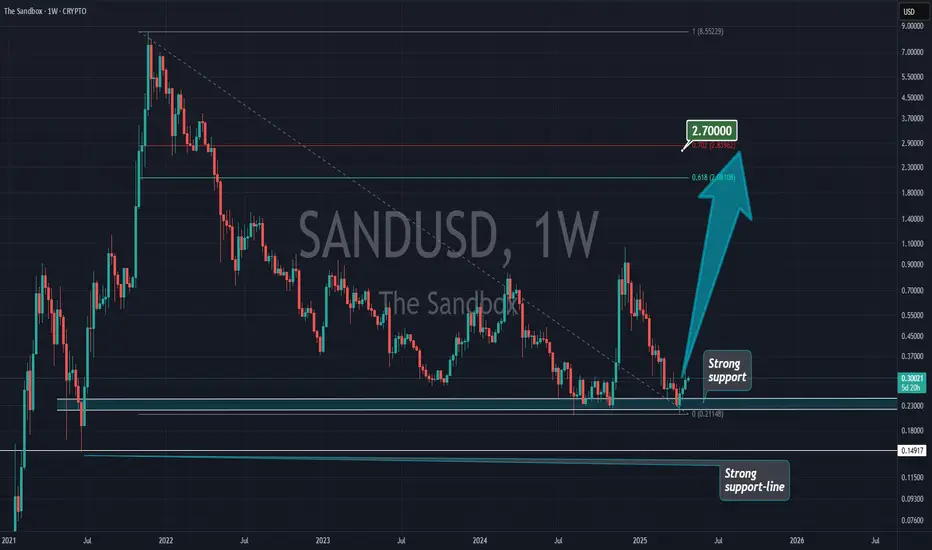
SANDBOX RALLY..Since 2021, SAND has been quiet but now holds strong support at $0.22. I believe a rally to $2.70 is likely in the coming months.
(ITS NOT A FINANCIAL ADVISE)

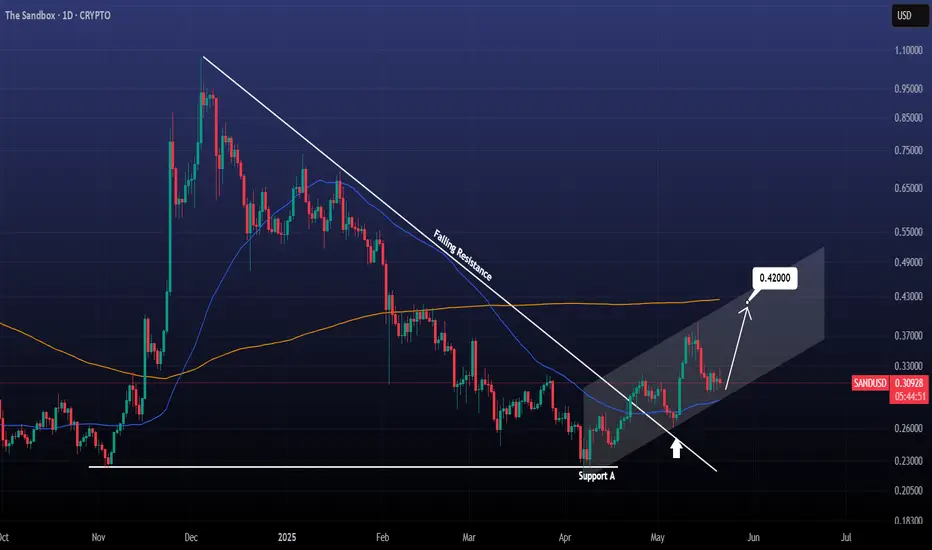
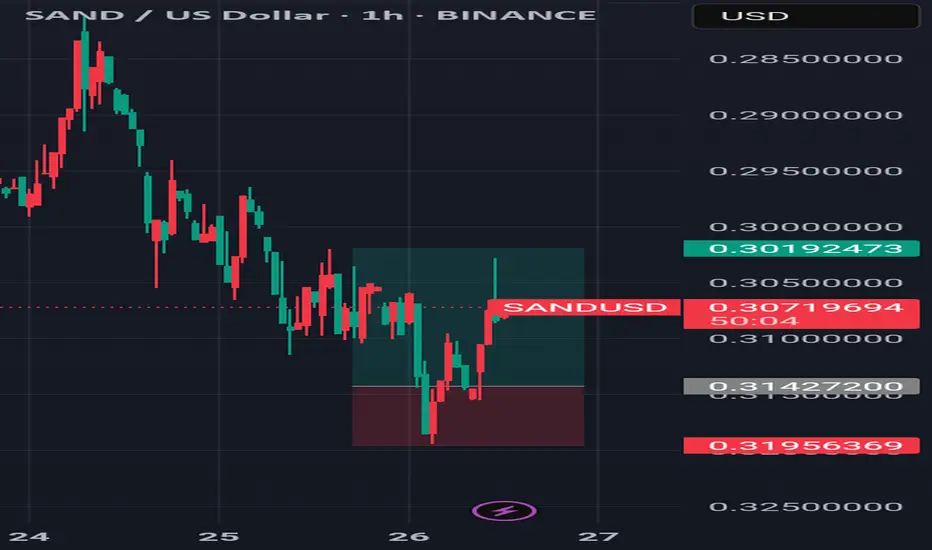
SANDUSD targeting the 1day MA200 at 0.42000Sandbox / SANDUSD has entered a Channel Up structure ever since it double bottomed on Support A and crossed above the Falling Resistance.
Now it's supported by the 1day MA50 and is aiming at a new Higher High on the 1day MA200.
Target 0.42000
Follow us, like the idea and leave a comment below!!
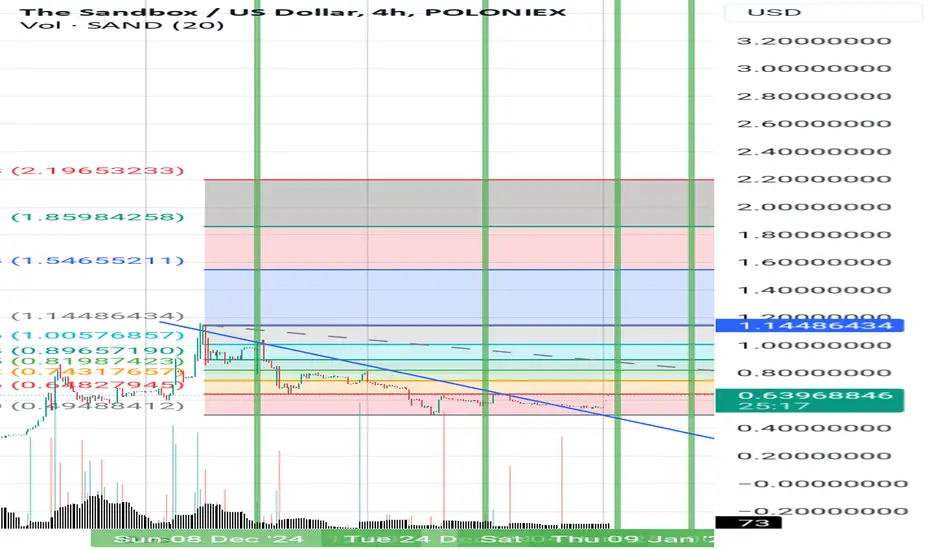
Inverse Head and Shoulders in SAND: Breakout Ahead?Crypto markets are waking up and SAND is showing a strong inverse head and shoulders setup that could spark a fast rally. ADA is also forming a bullish triangle with macro factors like tax cuts and a US UK trade deal adding momentum. The mood is shifting and big moves could be just days away.
This

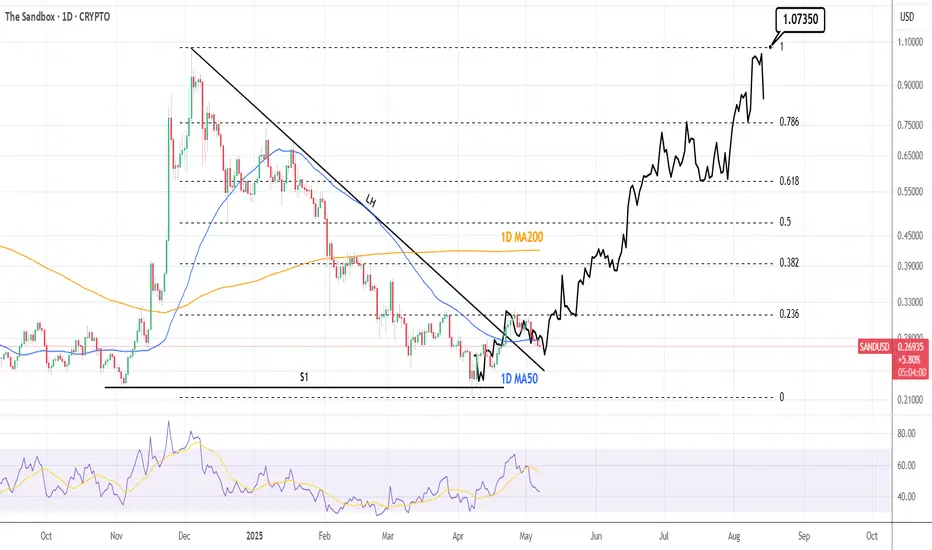
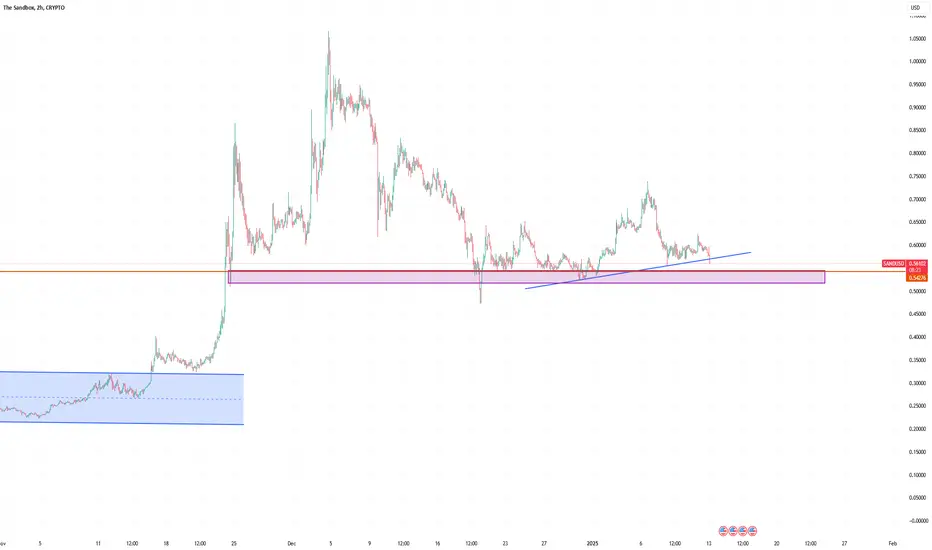
SANDUSD: The recovery back to 1.07350 has started.Sandbox (SANDUSD) is marginally bearish on its 1D technical outlook (RSI = 43.227, MACD = -0.001, ADX = 35.488) as it dropped below its 1D MA50 again. However, the breakout over its 5 month LH trendline has already happened and calls for a long term recovery. As you can see the Fibonacci retracement
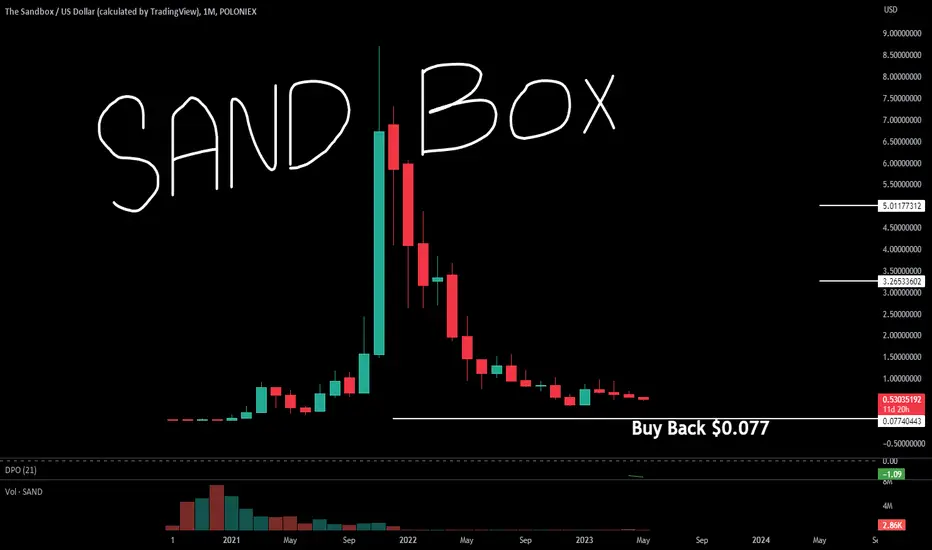
SANDBOX: $0.55 | Waiting for RESETthe metaverse ahead of its time
where market discounted the 10year reality in just 24 months after launching
very well regulated float gradually increasing
as the original investors finally unloads holdings
COST of OGs $0.003 to $0.005
Stabilization for buy back should be at $0.18 and all the
SAND BOX bullishsand box on monthly and weekly TF looks really bullish to me, and im expecting a huge upside movement to about $3 for mid-term
short sand sand just broke a a weak support zone , a good chance to short and make some profit, don't high leverage , market not stable. sell of once it reach the strong support zone. Thanks and good luck
See all ideas
Displays a symbol's price movements over previous years to identify recurring trends.
Curated watchlists where SANDUSD is featured.
ETH-based crypto: Find your utility
38 No. of Symbols

Metaverse tokens: VR crypto for a VR world
21 No. of Symbols

Non-Fungible Tokens: NFT-related coins
9 No. of Symbols

Video game crypto: Top gaming tokens
14 No. of Symbols
See all sparks
Frequently Asked Questions
SAND (SAND) reached its highest price on Nov 25, 2021 — it amounted to 8.31411 USD. Find more insights on the SAND price chart.
See the list of crypto gainers and choose what best fits your strategy.
See the list of crypto gainers and choose what best fits your strategy.
SAND (SAND) reached the lowest price of 0.05010 USD on Mar 13, 2021. View more SAND dynamics on the price chart.
See the list of crypto losers to find unexpected opportunities.
See the list of crypto losers to find unexpected opportunities.
The safest choice when buying SAND is to go to a well-known crypto exchange. Some of the popular names are Binance, Coinbase, Kraken. But you'll have to find a reliable broker and create an account first. You can trade SAND right from TradingView charts — just choose a broker and connect to your account.
You can discuss SAND (SAND) with other users in our public chats, Minds or in the comments to Ideas.