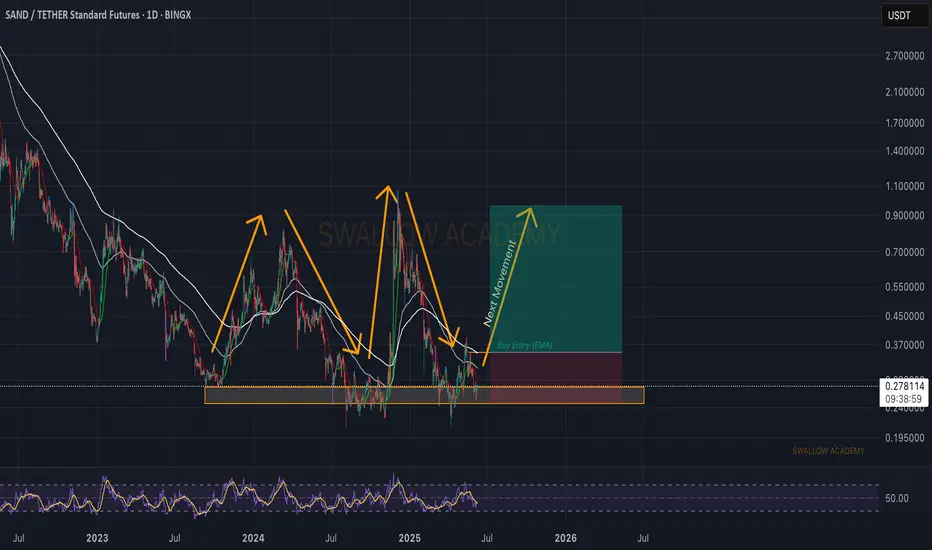
The Sandbox (SAND): Golden Buy Zone | Now or Never...Sand is one of the good long-term coins that caught our attention, where the price is at a local bottom...waiting for a proper breakout from EMAs, which would give us an easy 2.5x on the price.
There is not much to say but rather just wait patiently and enter at the right moment!. Very good R:R tr
SANDUSDT 1W AnalysisSAND ~ 1W Analysis
#SAND Buy back gradually from here if you still have confidence in this coin with a short term target of at least 20%+ from this support.

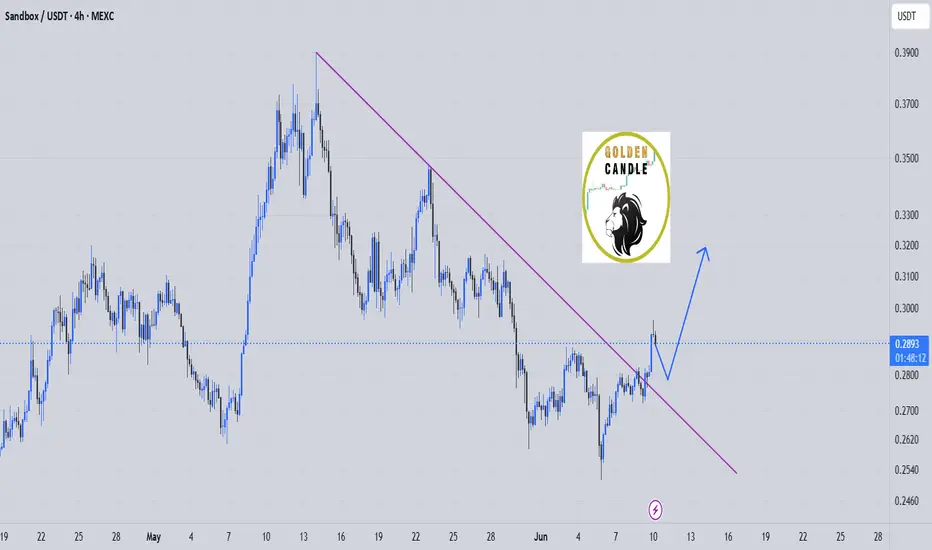
sand buy spot "🌟 Welcome to Golden Candle! 🌟
We're a team of 📈 passionate traders 📉 who love sharing our 🔍 technical analysis insights 🔎 with the TradingView community. 🌎
Our goal is to provide 💡 valuable perspectives 💡 on market trends and patterns, but 🚫 please note that our analyses are not intended as buy o
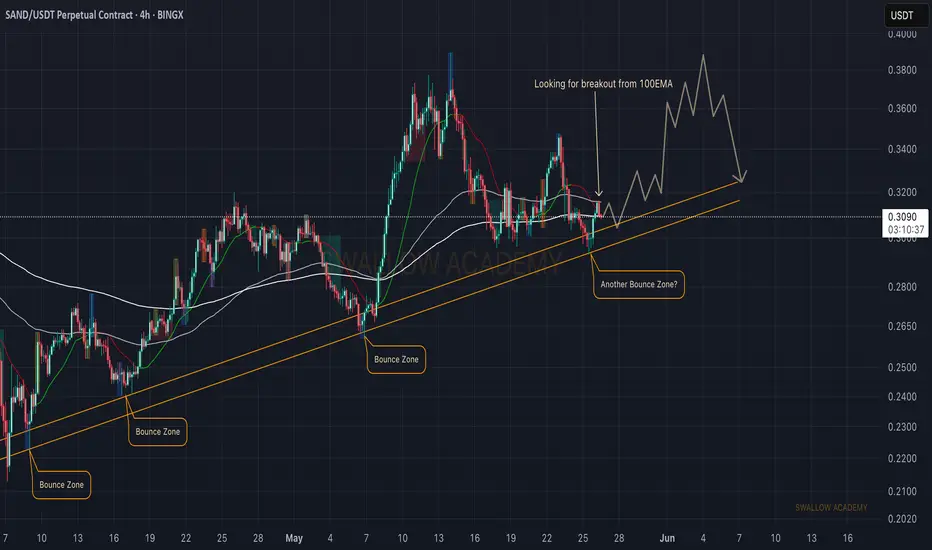
The Sandbox (SAND): Reached Strong Bullish Trend | Bounce AreaSandbox coin has recently touched again the local bullish trend from which we have been seeing some great upward movement (previously). With current bullish sentiment in the markets, we might be seeing a strong upward movement from here, and the 100EMA is our last confirmation for now.
Upon seeing
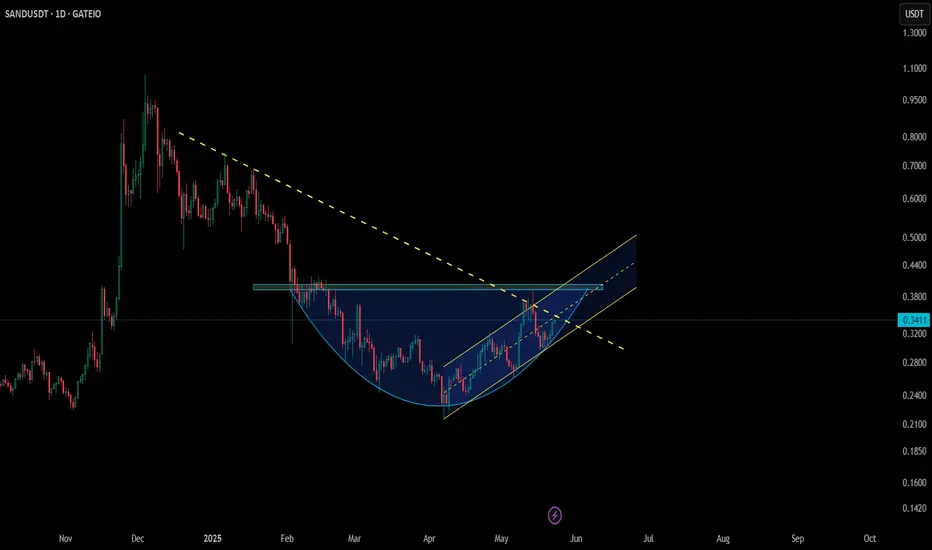
$SAND – Ascending Channel Meets Round Bottom🔥 NYSE:SAND – Structure Building Up
📆 On the daily timeframe, NYSE:SAND is forming a round bottom while also trending inside an ascending channel — signaling strong structural momentum 📈
⚠️ It’s now testing a key trendline resistance around $0.35 — a breakout here could trigger the next move up
SANDUSDT 1D Analysis SAND ~ 1D Analysis
#SAND Buy gradually from here if you still have confidence in this coin with a short term target of at least 15%+ from here.
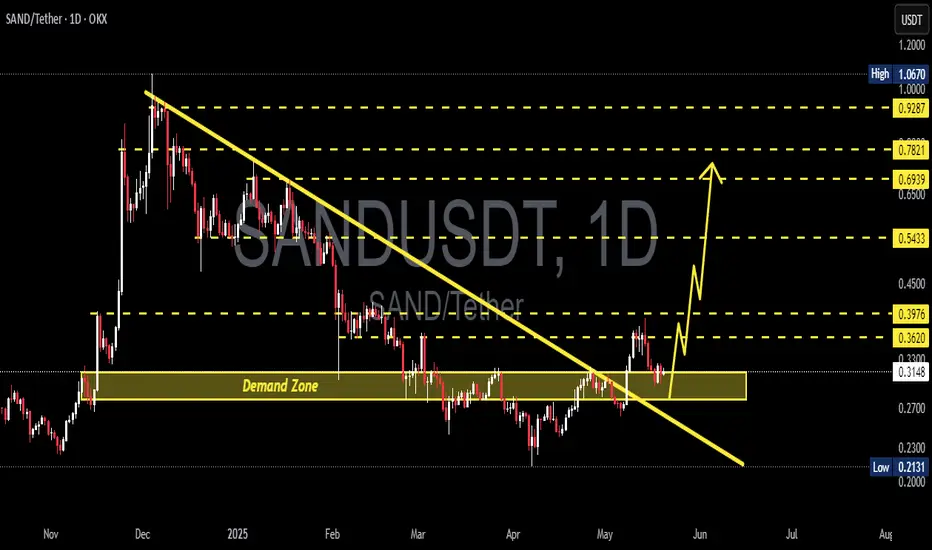
Sandbox (SAND): Seeing Break of Structure Forming | Buy Area?Sandbox is another coin that has formed a break of structure, which can send the price higher. As long as we keep the current momentum of volume from side, we are aiming to see that upper area reached within days!
Swallow Academy
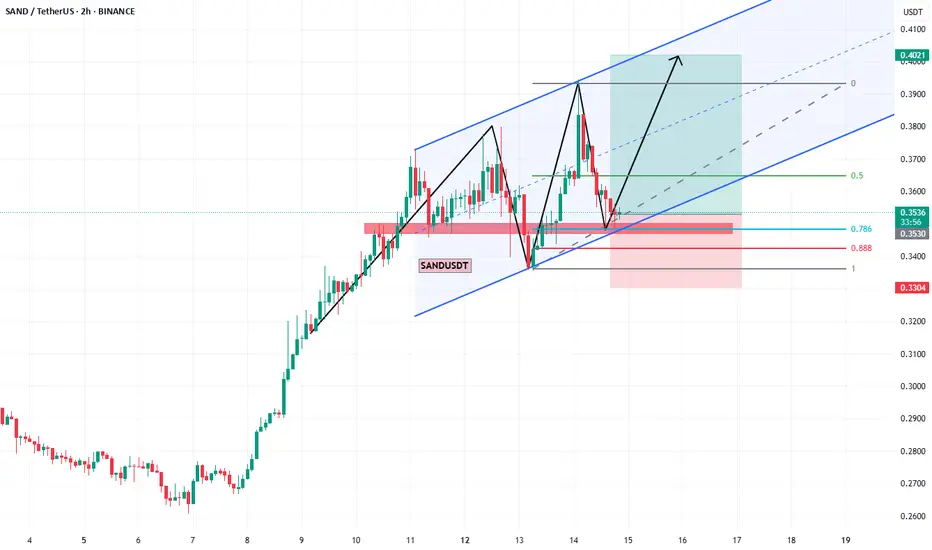
SANDUSDT BUY/LONGBy utilizing Fibonacci retracement levels, historical patterns, , we can formulate a hypothesis that the market might follow a similar trajectory if bullish sentiment prevails.
SANDUSDT breaking 3-years descending wedge. 2200% max profitHi!
posting again after a long time. wanted to share this SAND/USD weekly chart, all time.
Big opportunity here:
3 years long descending wedge
breakout with huge volume
retest of the wedge and bounce (current week)
RSI printing a higher low while price printing a double bottom
MACD cross

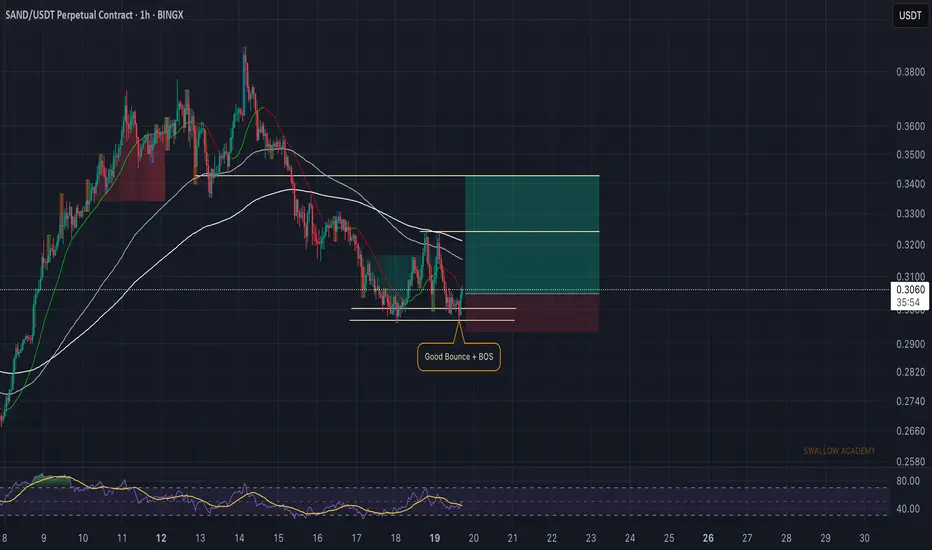
#SAND/USDT#SAND
The price is moving within a descending channel on the 1-hour frame and is expected to break and continue upward.
We have a trend to stabilize above the 100 moving average once again.
We have a downtrend on the RSI indicator that supports the upward move with a breakout.
We have a support

See all ideas
Summarizing what the indicators are suggesting.
Oscillators
Neutral
SellBuy
Strong sellStrong buy
Strong sellSellNeutralBuyStrong buy
Oscillators
Neutral
SellBuy
Strong sellStrong buy
Strong sellSellNeutralBuyStrong buy
Summary
Neutral
SellBuy
Strong sellStrong buy
Strong sellSellNeutralBuyStrong buy
Summary
Neutral
SellBuy
Strong sellStrong buy
Strong sellSellNeutralBuyStrong buy
Summary
Neutral
SellBuy
Strong sellStrong buy
Strong sellSellNeutralBuyStrong buy
Moving Averages
Neutral
SellBuy
Strong sellStrong buy
Strong sellSellNeutralBuyStrong buy
Moving Averages
Neutral
SellBuy
Strong sellStrong buy
Strong sellSellNeutralBuyStrong buy
Displays a symbol's price movements over previous years to identify recurring trends.