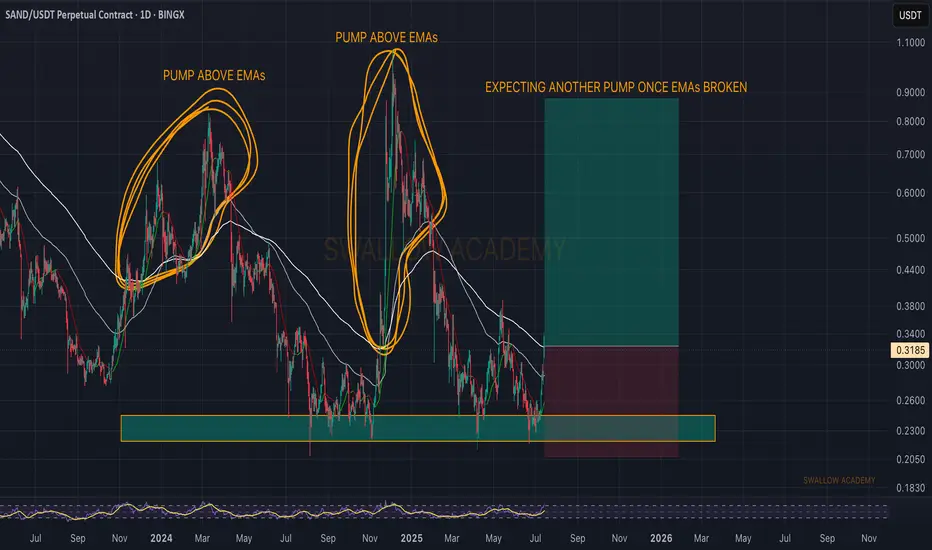
Sandbox (SAND): Really Good Buying OpportunitySAND is at a golden spot for potential good upward movement to happen once we see a proper breakout from that 200 EMA line.
We are seeing a great R:R trading setup here so might as well try it out, but wait for a proper break from that EMA.
Swallow Academy
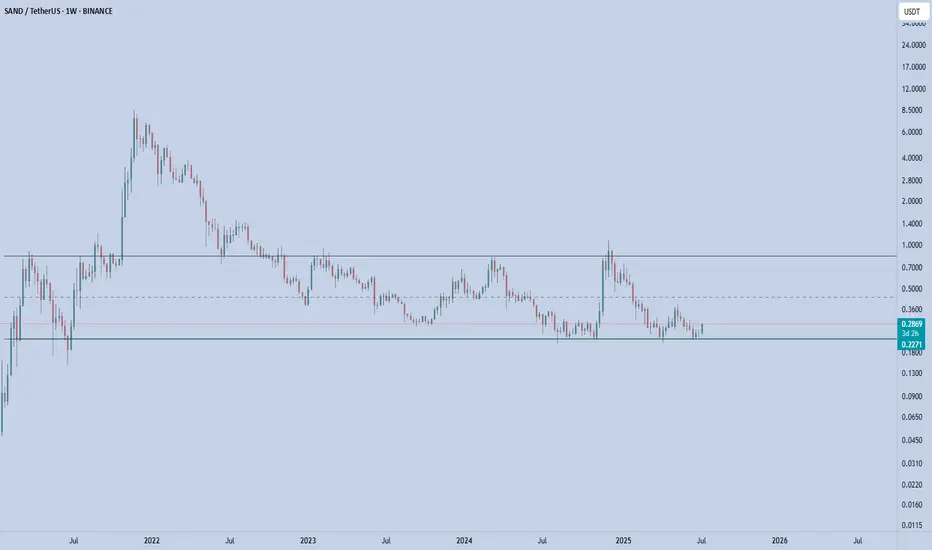
SAND – Rotation in PlaySAND is showing early signs of strength off the long-term demand zone near $0.23–0.24, where it's been accumulating for several months. Price just printed a strong weekly bounce, up +16%, reclaiming the bottom of the range.
This area has acted as a key base since mid-2023 — with each touch producin
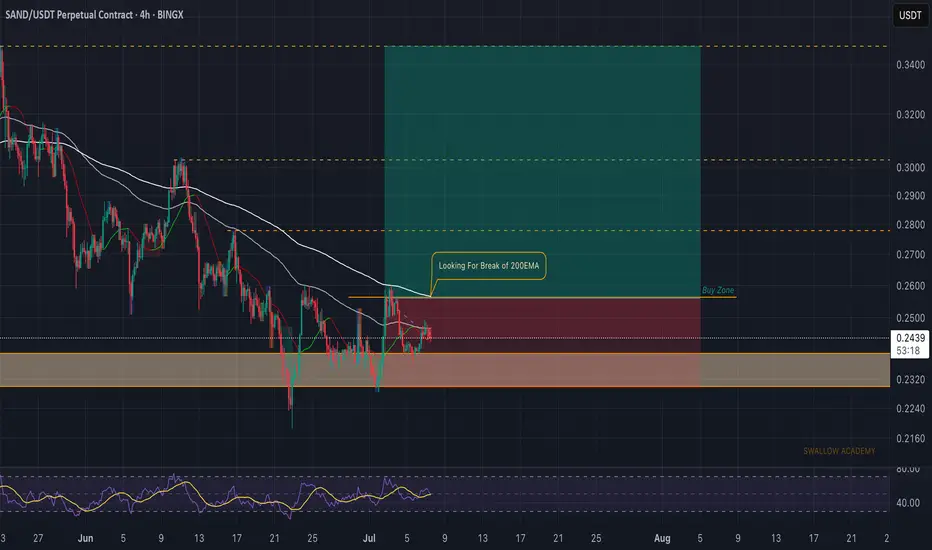
Sandbox (SAND): Looking For Break of 200EMASandbox has been in a downtrend for quite some time, and currently we are looking for proper upward movement, which could give us a decent switch in trend and an opportunity for long positions.
So as of now we have to wait and once we get that last confirmation of breakout, then we will be looking
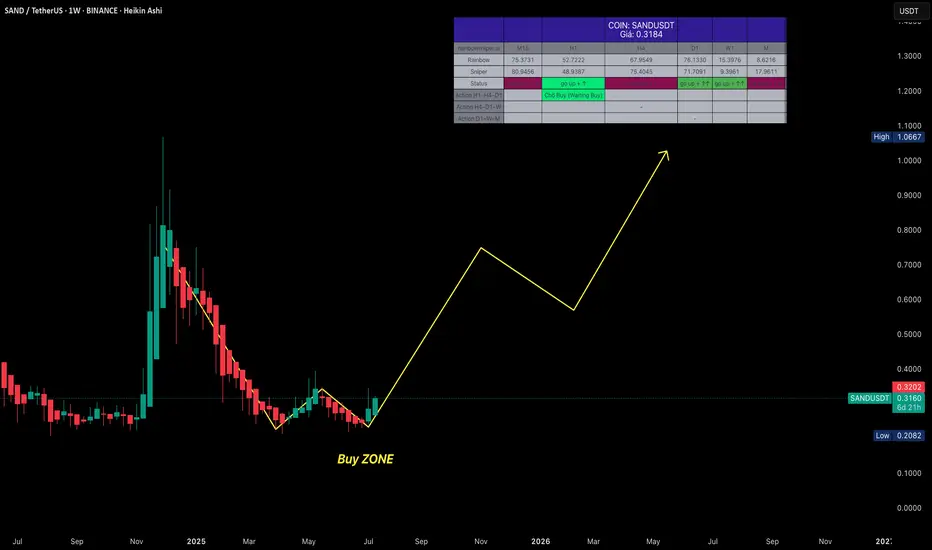
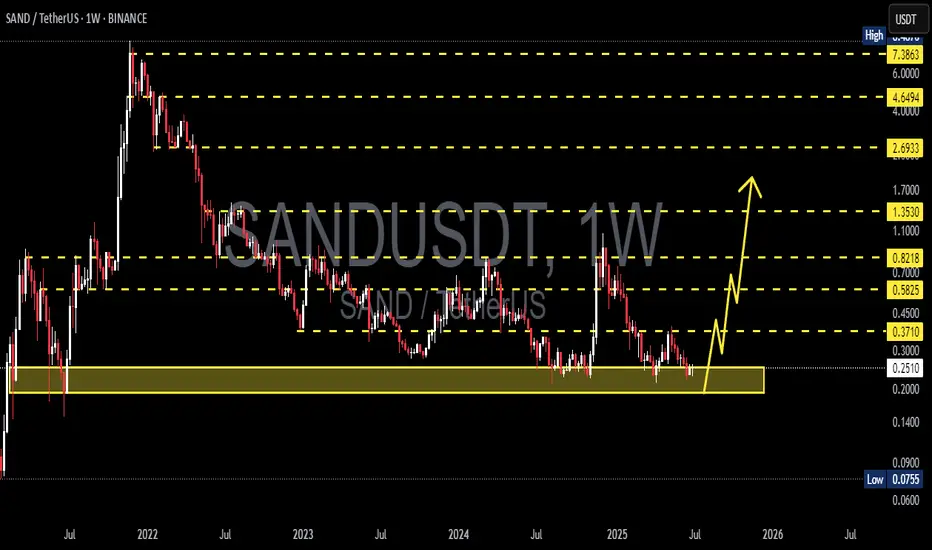
SANDUSDT – Long-term Spot Buy RecommendationSANDUSDT – Long-term Spot Buy Recommendation
Context: Many in the community have suffered from buying SAND at much higher levels, leading to heavily divided portfolios due to continuous DCA during the bottoming phase.
Now, our bottom detection system has been triggered—it's time to accumulate.
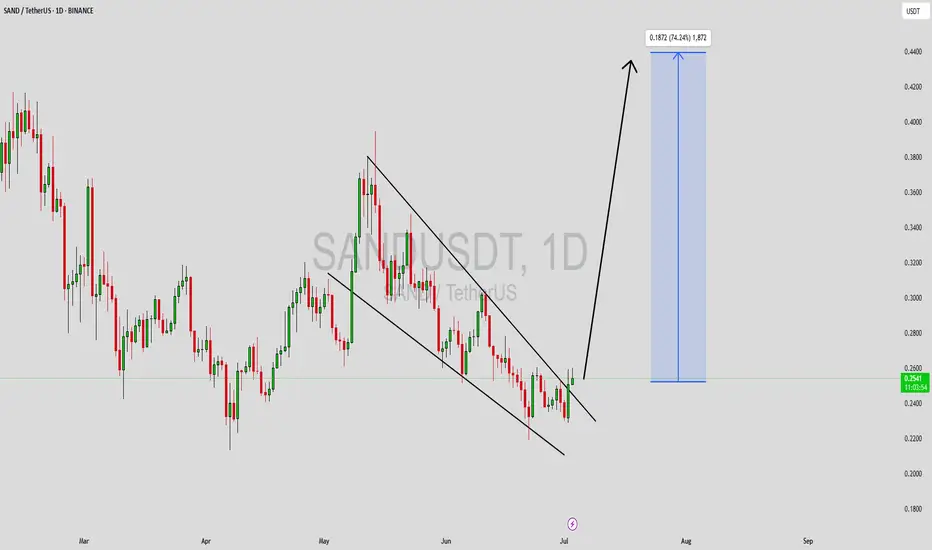
SANDUSDT Forming Bullish ReversalSANDUSDT is showing a promising technical setup that could attract more attention in the coming days. The chart clearly highlights a well-defined downward channel which many traders recognize as a potential bullish reversal zone, similar to a falling wedge pattern. The good trading volume adds more
SAND/USDT at Critical Support Zone – Rebound Potential?Detailed Technical Analysis:
The SAND/USDT weekly chart shows the price currently hovering around a historically strong support zone between $0.20 – $0.25. This yellow-marked demand area has been tested multiple times since 2021 and has consistently prevented further downside, making it a crucial d
SANDUSDTdowntrend move :
SANDUSDT market structure
for now making correction move, taking inducement before impulsive move.
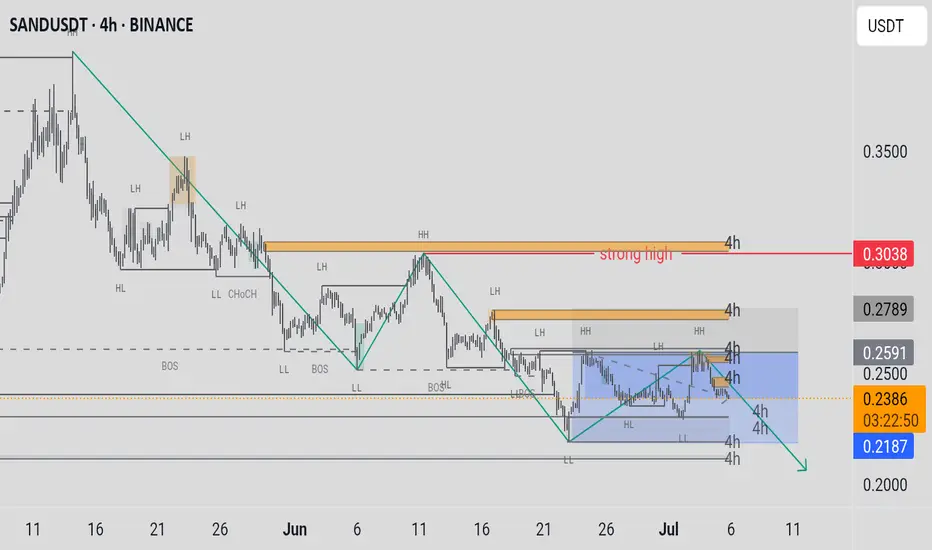
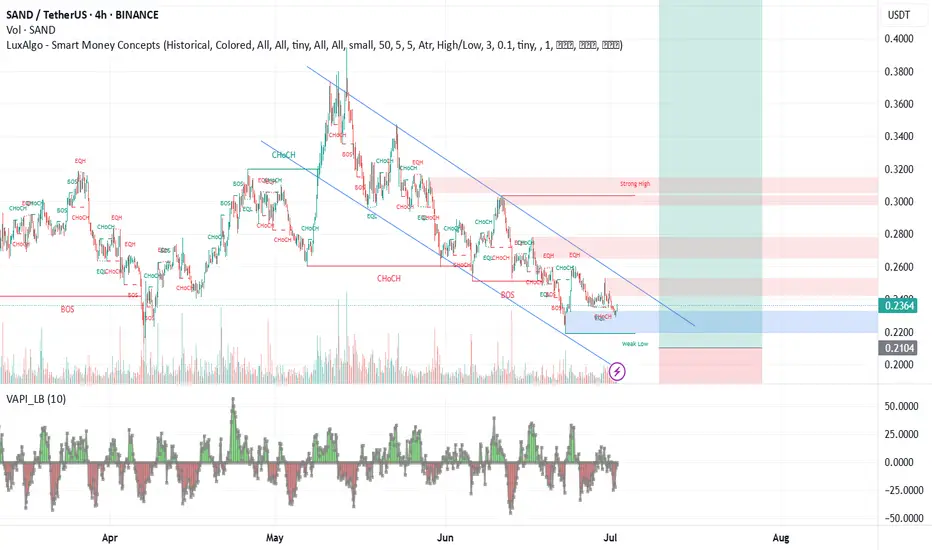
Análisis Técnico Multidireccional SAND USDT. Overall Trend and Price Patterns:
In the long and medium term, SAND's trend is bearish. This is confirmed by the 4-hour charts and higher, where lower highs and lower lows are observed. The "Smart Money Concept" indicator also indicates a "Trend: Negative".
A descending channel has been identifi
SANDUSDT 1D#SAND is currently trading inside a Falling Wedge on the daily chart.
Let’s see if it can hold the wedge support and bounce from here.
Looking at the bigger picture, it may be forming a Double Bottom.
Just like it broke out of the descending channel in April, we could now see a breakout above the w

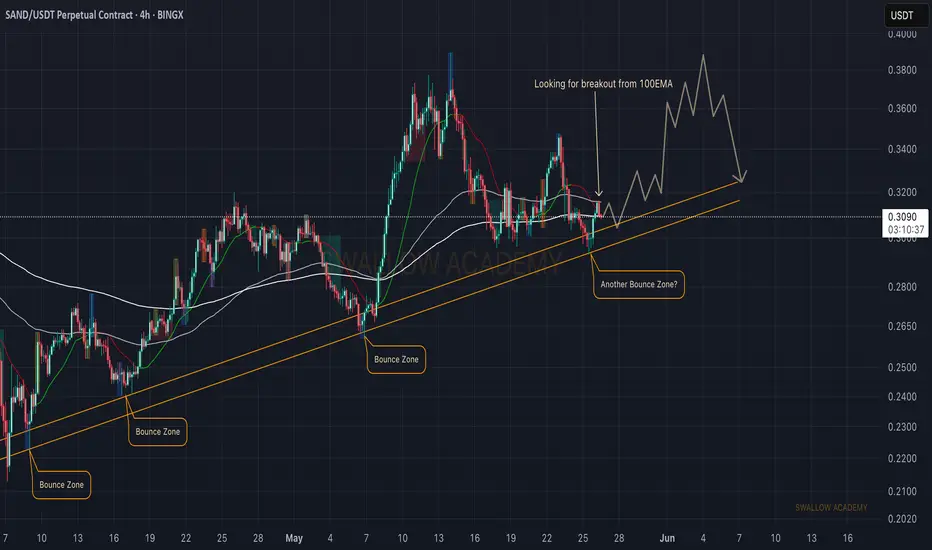
The Sandbox (SAND): Reached Strong Bullish Trend | Bounce AreaSandbox coin has recently touched again the local bullish trend from which we have been seeing some great upward movement (previously). With current bullish sentiment in the markets, we might be seeing a strong upward movement from here, and the 100EMA is our last confirmation for now.
Upon seeing
See all ideas
Summarizing what the indicators are suggesting.
Oscillators
Neutral
SellBuy
Strong sellStrong buy
Strong sellSellNeutralBuyStrong buy
Oscillators
Neutral
SellBuy
Strong sellStrong buy
Strong sellSellNeutralBuyStrong buy
Summary
Neutral
SellBuy
Strong sellStrong buy
Strong sellSellNeutralBuyStrong buy
Summary
Neutral
SellBuy
Strong sellStrong buy
Strong sellSellNeutralBuyStrong buy
Summary
Neutral
SellBuy
Strong sellStrong buy
Strong sellSellNeutralBuyStrong buy
Moving Averages
Neutral
SellBuy
Strong sellStrong buy
Strong sellSellNeutralBuyStrong buy
Moving Averages
Neutral
SellBuy
Strong sellStrong buy
Strong sellSellNeutralBuyStrong buy
Displays a symbol's price movements over previous years to identify recurring trends.