W9.1-29 SAND SHORT TERM BULLISH IDEAPotential Bullish Entry Dow Theory In Place - Higher High and Higher Low Expected in Place Formation of DOUBLE bottom coupled with bullish divergence (Bullish reversal pattern) SL & TP Levels are defined.
SANDUSDT.P trade ideas

#SANDUSDT (Watchlist) 4-2023Consider adding this BINANCE:SANDUSDT to your watchlist.
When we suggest adding a coin to your watchlist, it means it's forming a pattern or approaching a historical bottom, near or above a good support level, displaying increased trading volume, showing a reversal candle, in an accumulation stage, etc. However, we haven't seen any bullish reaction yet, so we recommend adding it to your watchlist until the right time for entry.
Note:
This isn't financial advice, but an analysis of coin movement (not a buy or sell signal). Before following any ideas, do your own research and practice good risk management.
You can't impose your opinion or force it to happen in the cryptocurrency market. So, be prepared for any outcome.
Remember, the cryptocurrency market is highly volatile and involves both gains and losses. Understand the risks before investing.
Good luck to everyone, and we hope that Allah reconciles and repays us all. 🙏
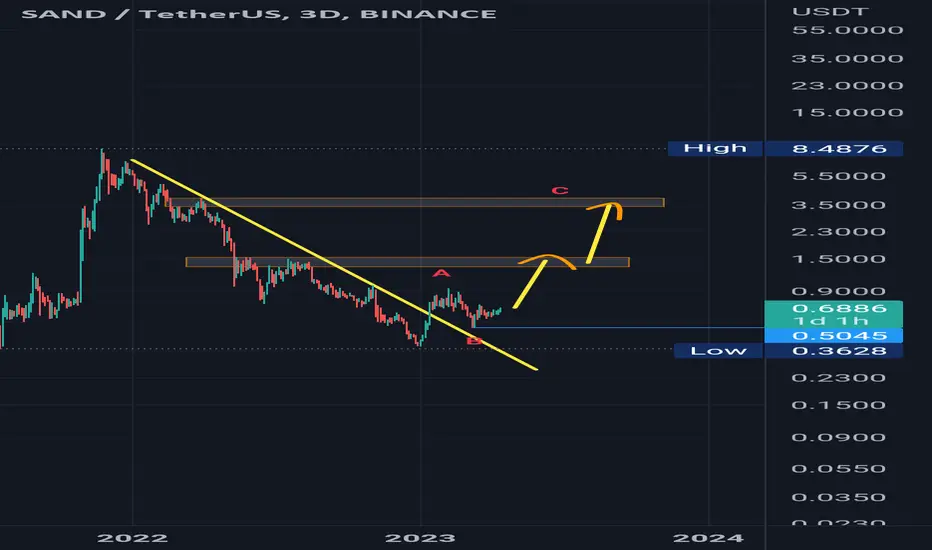
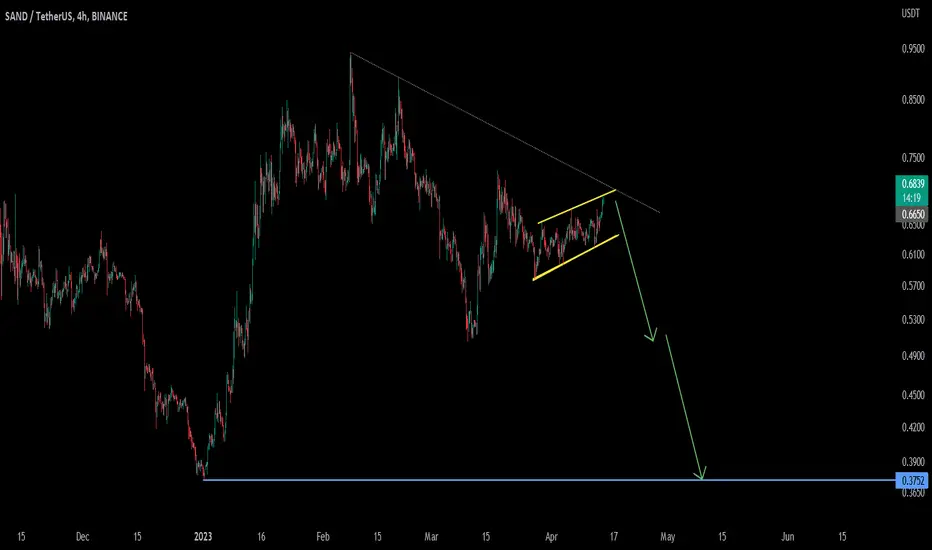
sandusdtIt is possible for a motive to rise in the form of five waves to the top and the target becomes the second shaded area. If it is able to pass the first shaded area and close its top, it will go to the second area
Note: The analysis fails if it closes below an area 0.5 usdt
W9-33 SAND BULLISH IDEA (HARMONICS BULLISH PATTERN)Potential Bullish Entry
Dow Theory In Place - Higher High and Higher Low Expected in Place
Formation of Harmonic Bullish reversal Pattern coupled with bullish divergence at potential reversal zone (PZR)
Entry at the new HH
SL & TP Levels are defined.

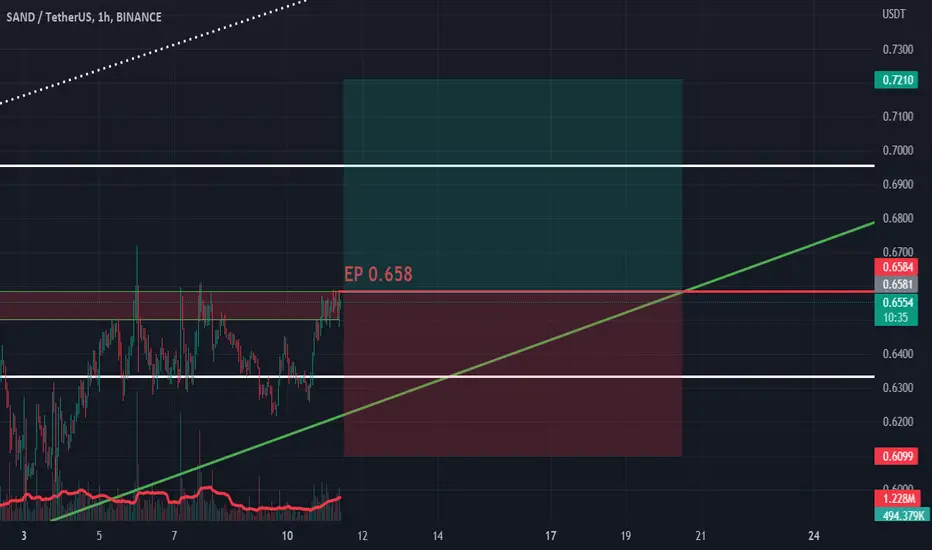
SANDUSD ❕ broken the downtrend lineSAND is trading in the liquidity zone.
Price, RSI chart and trading volumes have formed a bullish divergence (1H TF)
I believe the asset will bounce from the support level.

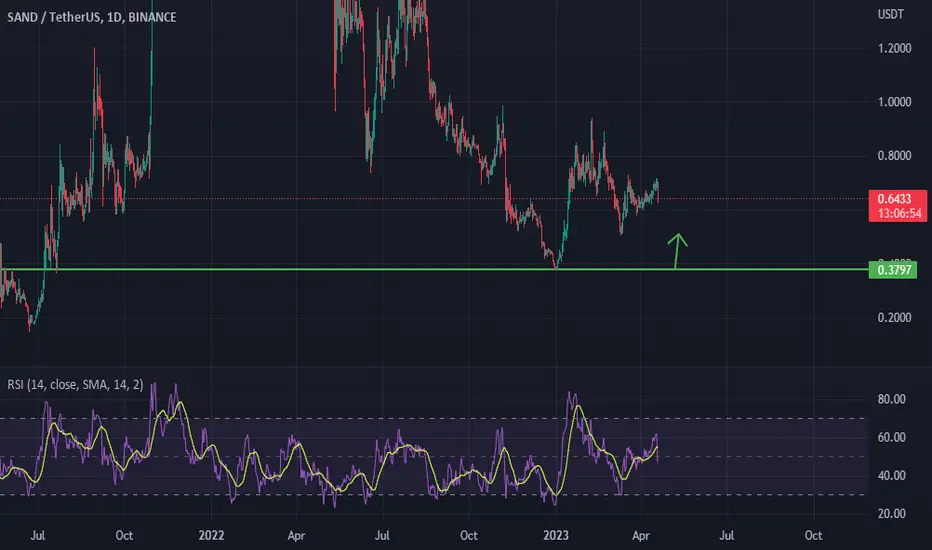
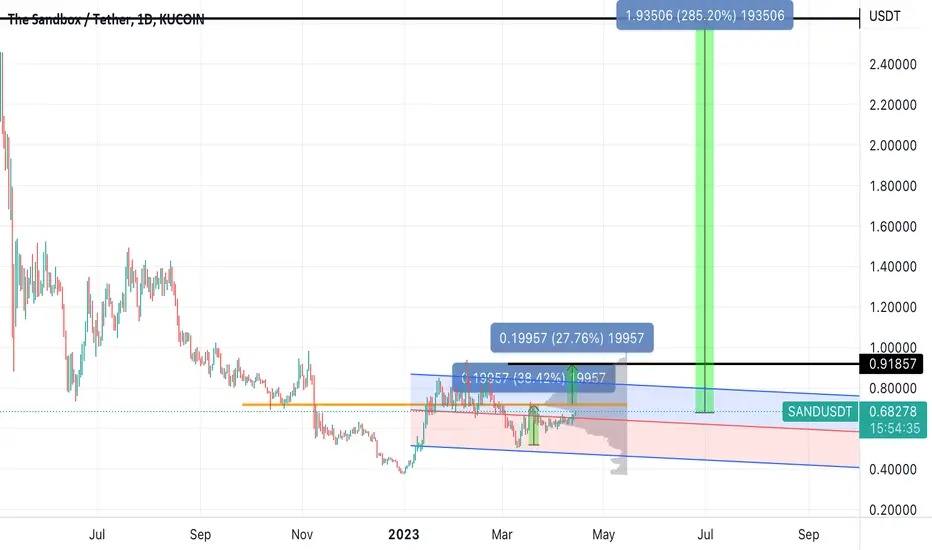
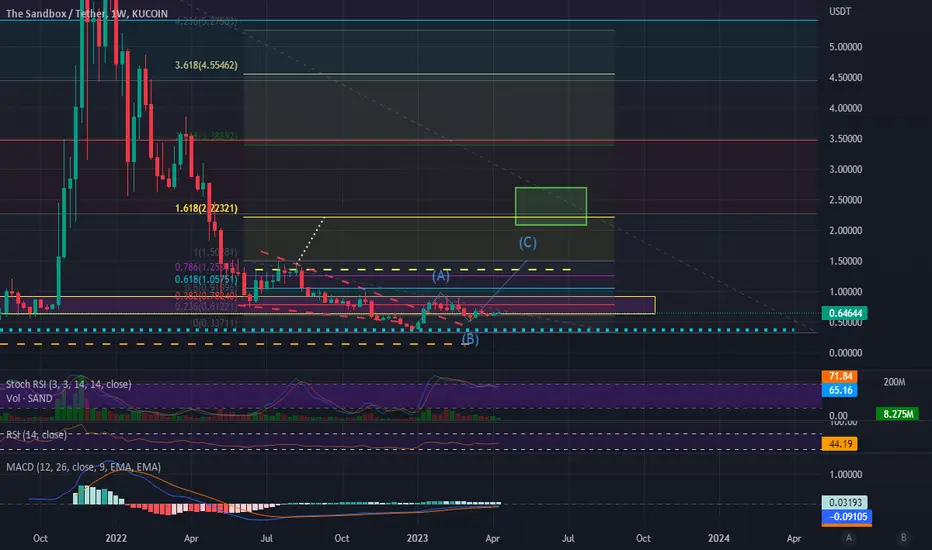
Analyzing the Price Trends of SAND Cryptocurrency SANDBOXThe growth of SAND cryptocurrency in the 2021 year has been nothing short of remarkable. In just 13 months (from 2020), the price of SAND rose from a humble 0.02$ to an impressive 8.00$. This meteoric rise has caught the attention of many investors, who are now scrambling to get in on the action. What is even more impressive is that this growth occurred after a time of great uncertainty in the world, as the COVID-19 pandemic was wreaking havoc on the global economy. Despite these challenges, SAND was able to grow exponentially, proving that its unique blend of gaming and blockchain technology is resonating with a wide range of people. As we look to the future, it's clear that SAND has the potential to continue its growth trajectory.
The SAND cryptocurrency experienced a significant price drop in 2022, with the token falling from its previous high of 8.00$ to just 0.37$. This decline took many investors by surprise, and many were left wondering what the future held for SAND. However, it's important to note that this price drop was not unique to SAND, as the entire cryptocurrency market experienced a bearish trend during this time. Despite this setback, the team behind SAND remained committed to the project, and continued to work on improving the platform and expanding its partnerships. In 2023, the price of SAND finally established a bottom, with the token hovering around the 0.37$ mark. While this is a significant drop from its previous highs, it's important to keep in mind that cryptocurrency markets follow same cycles over and over again.
Based on technical analysis of SAND's chart and its Fractal structure, it's possible that the token may experience a price increase in the coming months. The chart indicates that SAND has been consolidating in a range between 0.3$ and 0.8$ for several months, which could indicate a period of accumulation by investors. Additionally, there has been a recent uptick in trading volume, which may signal increased interest in the token. Based on these factors, it's possible that SAND could see a price increase in the spring or summer of 2023, with the token potentially reaching levels of 2.0$ to 2.56$.

SANDUSDT Bullish Move soonSANDUSDT is also in the midst of a Harmonic Pattern and waiting for our Entry point to enter our long trade with price targets in place

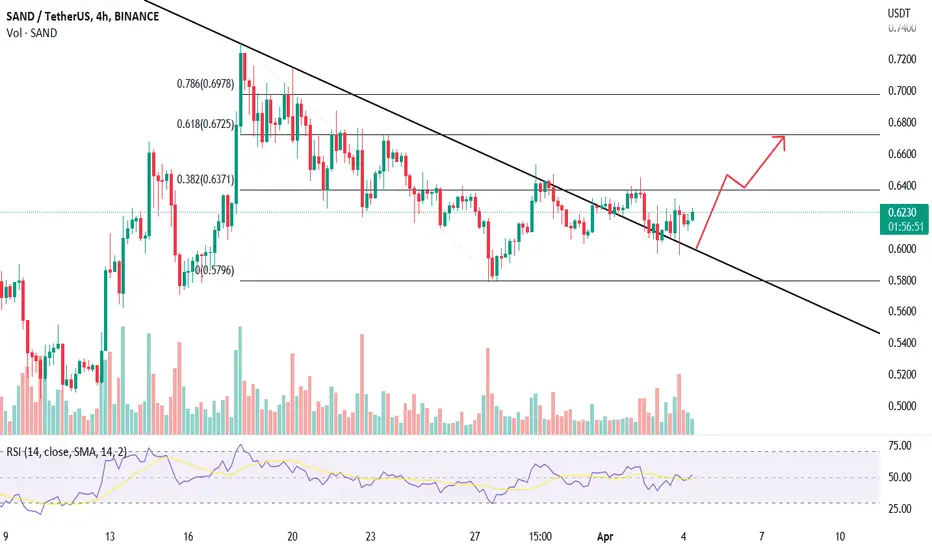
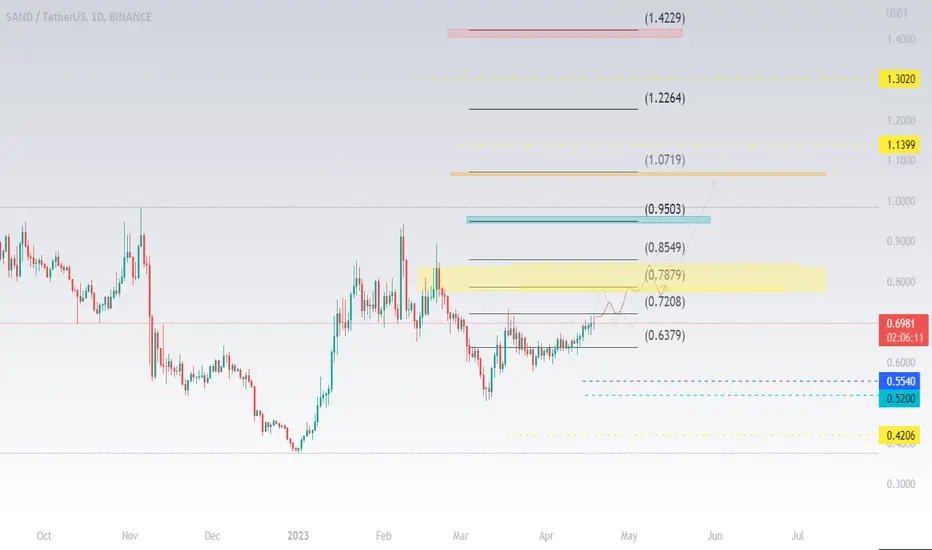
SAND S&R in short term>>>Hello EveryOne
I Have Tried My Best to Bring the best Possible outcome in this Chart.
In case of breaks 0.72 this scenario happening,
Otherwise be failed.
It's just an analyze,
Not a financial advise.
PLZ DYOR
With hopping success>>>>>>>>>
SANDUSDT: ATTEMPTING A BREAKOUTSAND is attempting to breakout out of JULY 2022 lower highs diagonal resistance. We can look for a buy setup upon breakout and/or retest. But if it the price succumbs to this resistance, the demand zone below it is good place to buy

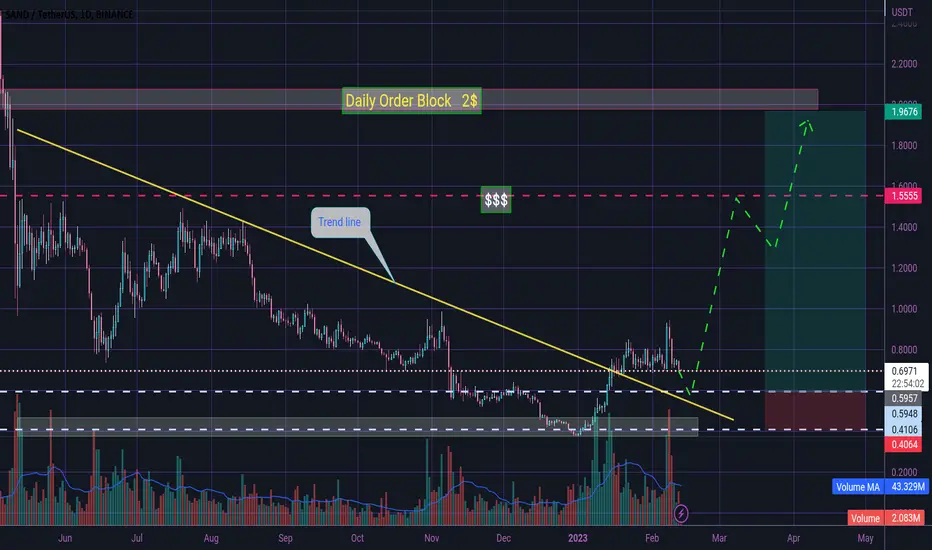
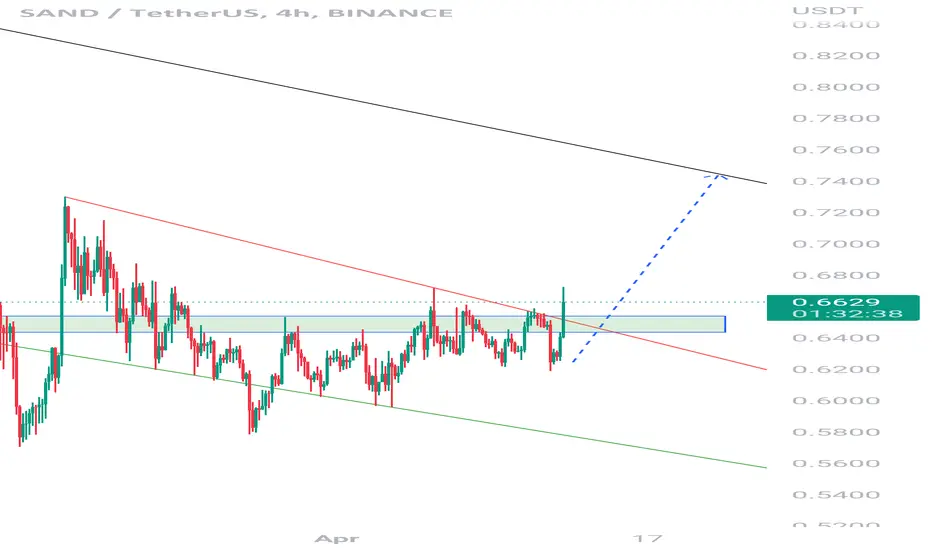
SAND Daily Movement 🤓☕🤓☕🤓Hi dear traders
After breaking the downtrend line, SAND started a powerful ascent.
Now, with a correction and a pullback, the trend line can continue its upward path to the specified liquidity area.
Let's see what happens
This is not financial advice ( DYOR )
Good luck
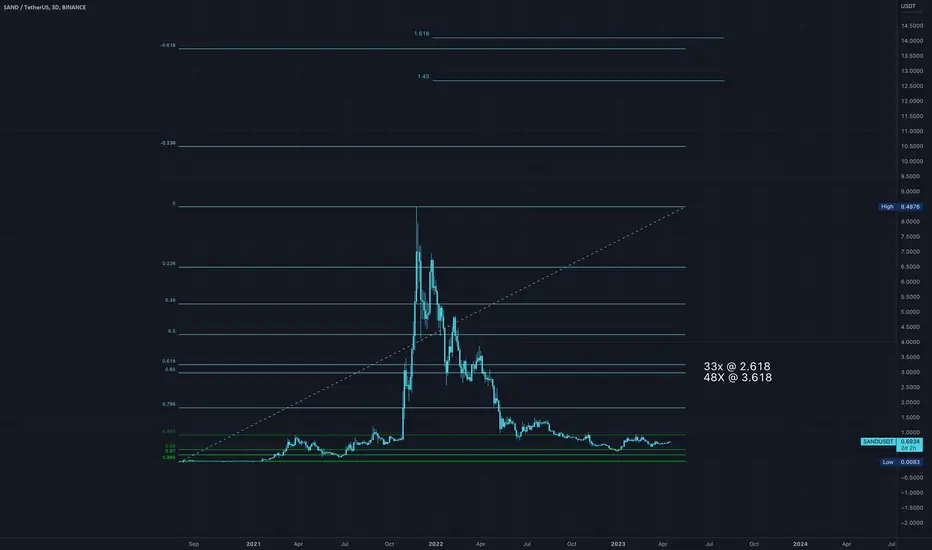
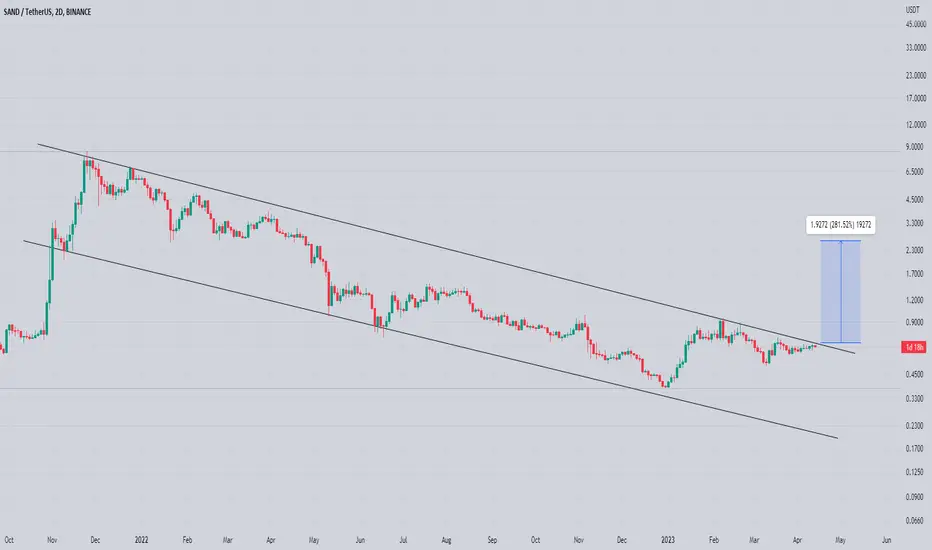
SANDLong-term accumulation is happening now. Potential outcomes if the Bulls are successful from the current price at 0.69 is 33X @ 1.618 and 48X @ 3.168.
Sandusdt Retesting Sandusdt
Sandusdt Breakout Was Already Confirmed, retest is in process incase of successful retest expecting 40-80% Bullish Move
Wait For Confirmation, Risk Under Your Control
Dyor

SANDShort Term: %27
* Adam and Eve formation
Mid Term: More than %200
4HR:
Bullish Strength: 34
* MA7 > MA25 > MA99
* MA50 > MA100 > MA200
* Supertrend is long
* Price > MA7
* Price > MA50
* Price > Tenkan Sen
* Price > Kijun Sen > Kumo
* Chikou Span > Price
* MACD > 0
* Upper Bollinger Band Breakout
Bearish Strength: 3
* StochRSI Overbought
Home work EWThe goal here is to chart Elliot waves and each wave has to be correlated with MA crosses. In addition the fibb retracement is used to confirm the corrections and reversals.

Sand On verge Of massive breakout Seems Like already Bottomed Out And getting ready for massive Breakout
formed Descending Channel In Htfs Incase Of breakout expecting 200 to 220% bullish Move
Sand Attempting For Breakout Sandusdt
Incasenof successful breakout expecting 20-40% Bullish move in coming hours
Do Your own research & always manage risk
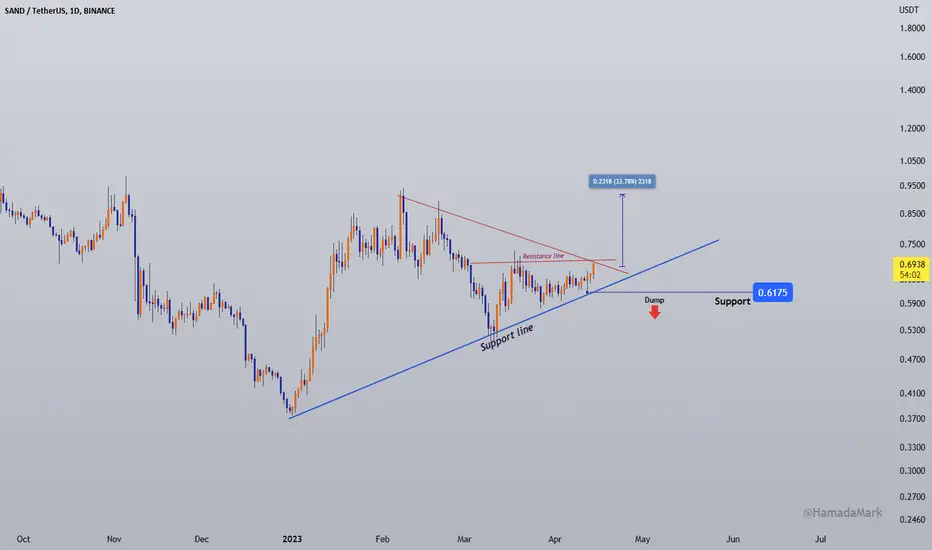
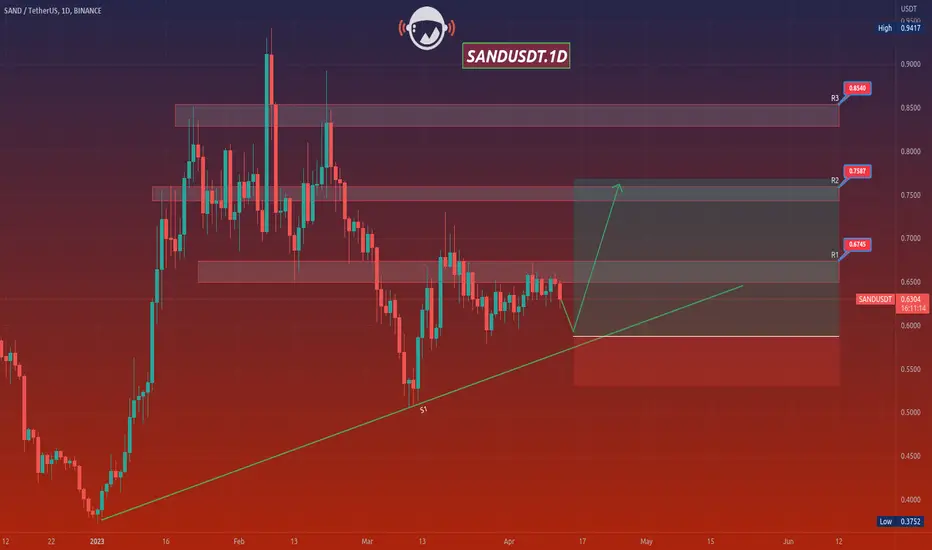
SANDUSDTHello Crypto Lovers,
Mars Signals team wishes you high profits.
This is a one-day-time frame analysis for SANDUSDT
In this chart, R3 and R2 are our resistance areas in which the unsuccessful triumphs of price is clearly seen. R1 used to be a support area. And at the bottom of the chart, we have S1 that is the long-term support line and expresses the support of price at different points. Presently, the price is fluctuating below R1 after being rejected several time by this area and we believe the price would give us two options. Either by giving us some rising signs after falling to S1, the expectation of an increase up to R1 and R2 is probable. These are the good points for saving your profits. Or the price is not supported and falls below S1 and faces a decline to lower amounts via receiving some confirmation candles in order to fall. Note that it is recommended to wait for the price to reach S1 and then put their trade orders; for those who are seeking higher risks. In case you are interested in experiencing profitable trades and wise actions in your analyses, we have several points and tips in our updates.
Warning: This is just a suggestion and we do not guarantee profits. We advise you to analyze the chart before opening any positions.
Wish you luck
SANDUSDT 2H HR MTSAND
The beginning of the 3rd ascending wave
Big wave correction to 0.618 area
Crossing the powerful PRZ

Time for Sand ?Clearly showing that Sand broke falling wedge and completed to retest. Time to go up Sand. Lets track sand..