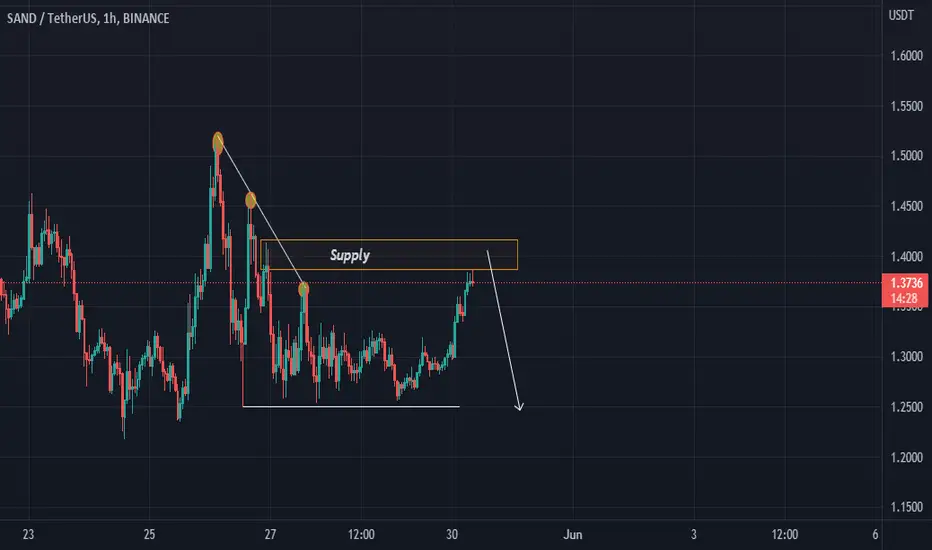
SANDUSDT🔥 LONG?!!!!💡#sand the price got into the supply zone, but I think it's not worth waiting much, they can still shed about 1.1850$ Can happen against the background of the #BTC spill. Now the chart looks bearish.
▫️You can also consider SHORT for a countertrend breakdown, I'll just watch, if I see a breakdown, I'll consider LONG🔥
✅Do not forget to visit the channel there is a lot of useful information about trading.
SANDUSDT.P trade ideas
#SANDUSDT 2H Chart
Price has tapped into the 3h supply zone and got rejected heavily from there. MACD is not clear, RSI and EMAs are both neutral. I am expecting it to keep moving down towards the 5mins demand as a short term target.

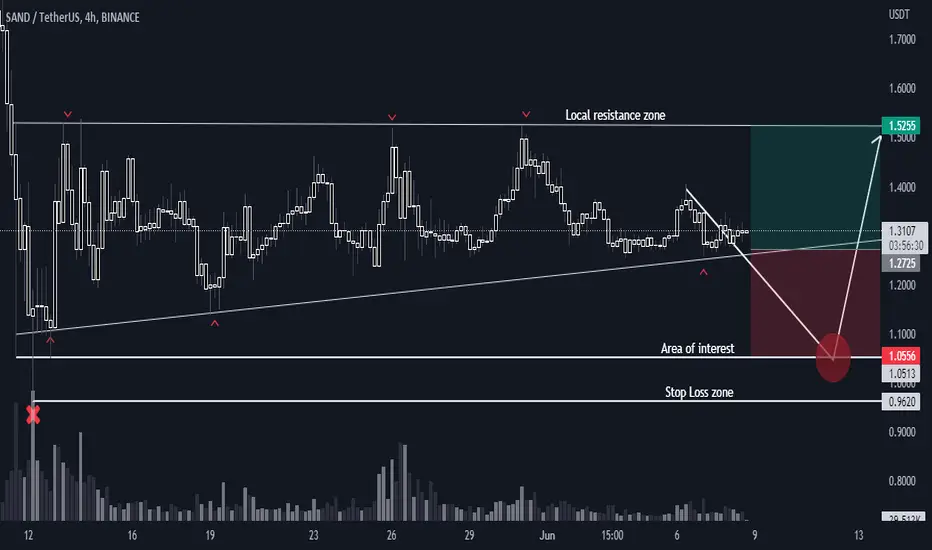
Should i accumulate gaming coin, well i kinda love sandboxWe all Know Btc by now is going to 20 22 k, but there is a lot more money to be made in the upper side, but depends on how low, you able to long from. Good luck

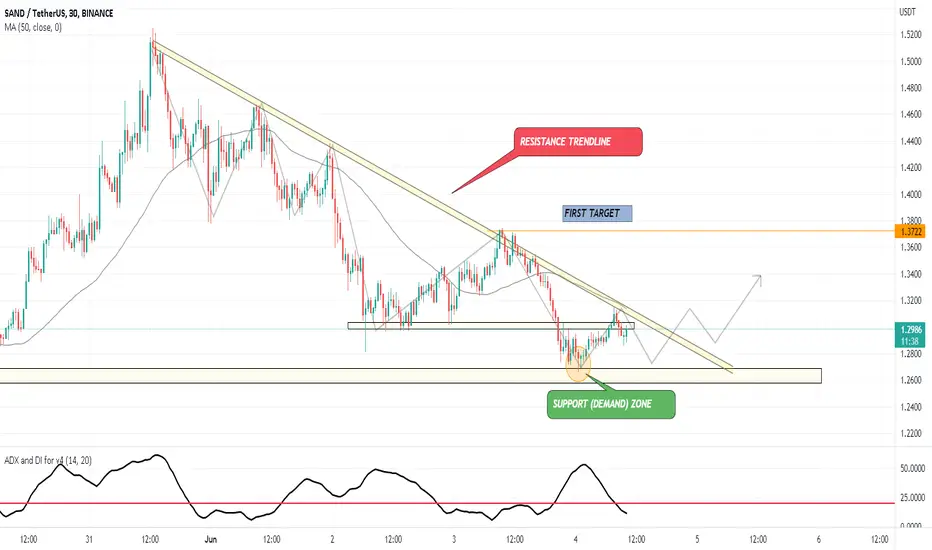
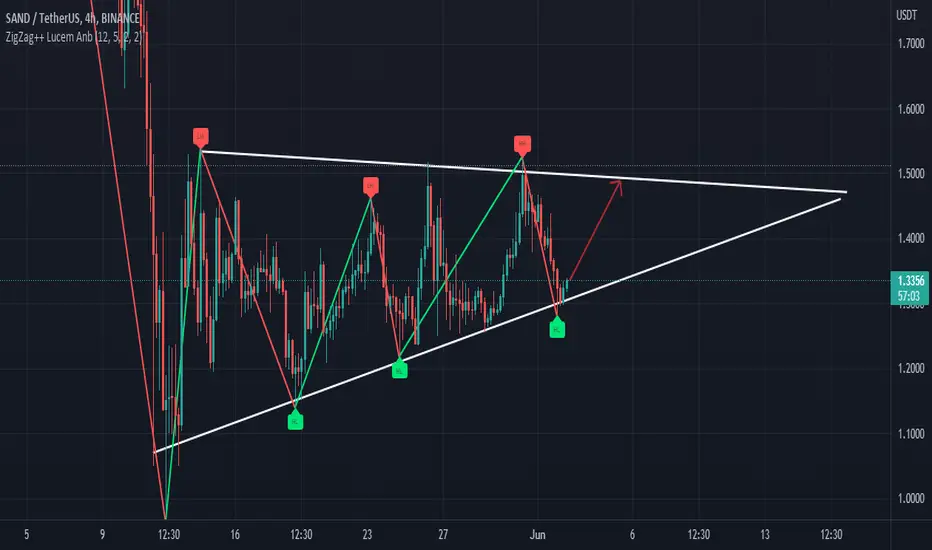
SAND DESCENDING TRIANGLE PATTERNSAND BINANCE:SANDUSDT is forming a Descenidng Triangle pattern....
I know that in Technical terms, it is mostly regarded as a sign of bearish pattern.... But sometimes it can be powerfully Bullish too!!
I think it might fool sellers when it make a pullback near Demand zone and might continue back to the 1st Target area...
If you can relate.... then please like and ask any comment you guyzz have!! (:
Trading opportunity for SANDUSDTBased on technical factors there is a short position in :
📊 SANDUSDT
🔴 Short Now 1.2824
🧯 Stop loss 1.5400
🏹 Target 1 1.1100
🏹 Target 2 0.9000
🏹 Target 3 0.5700
💸Capital : 1%
We hope it is profitable for you ❤️
Please support our activity with your likes👍 and comments📝

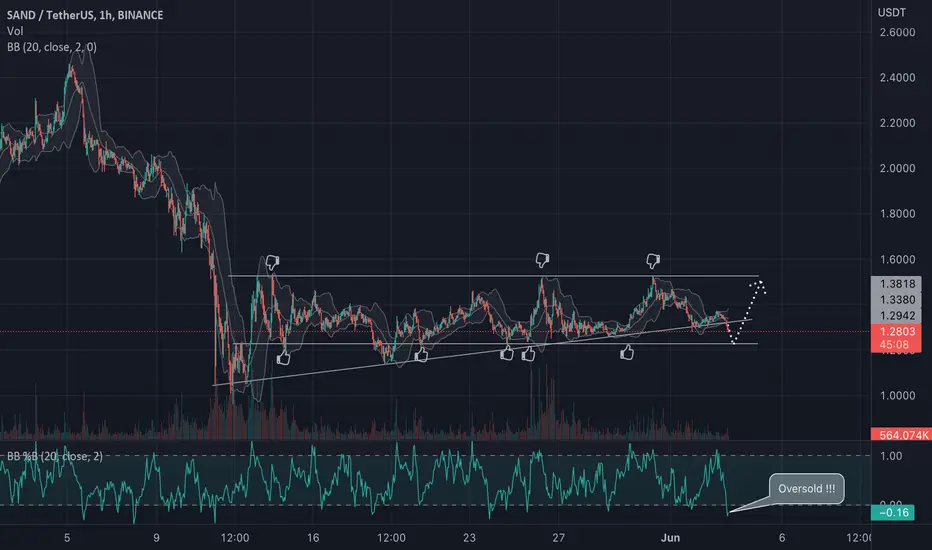
SAND/USDT is bouncyHey guys
We see a possible scenario for the SAND. We see nice sideways path where it is a good time to make some short-term trades. Also the market is oversold which gives us a hint about a big movement soon.
If you like ideas provided by our team you can show us your support by liking and commenting.
Yours Sincerely,
Swallow Team.
Disclamer:
We are not financial advisors. The content that we share on this website are for educational purposes and are our own personal opinions.
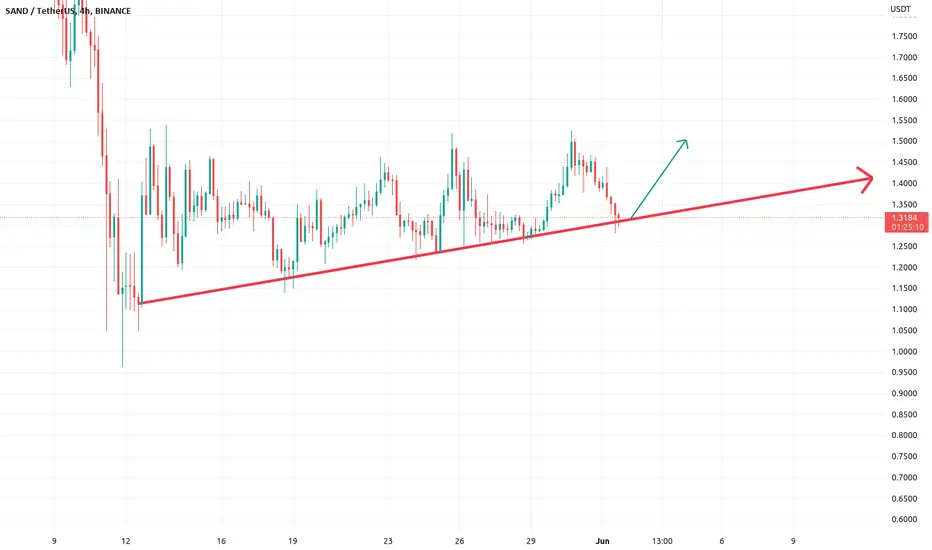
sandusdtlooks like sand is at the 4hr trendline gona long here just a small position should if fall below trendline is a stop loss and move on i think risk here is like -2% loss good luck
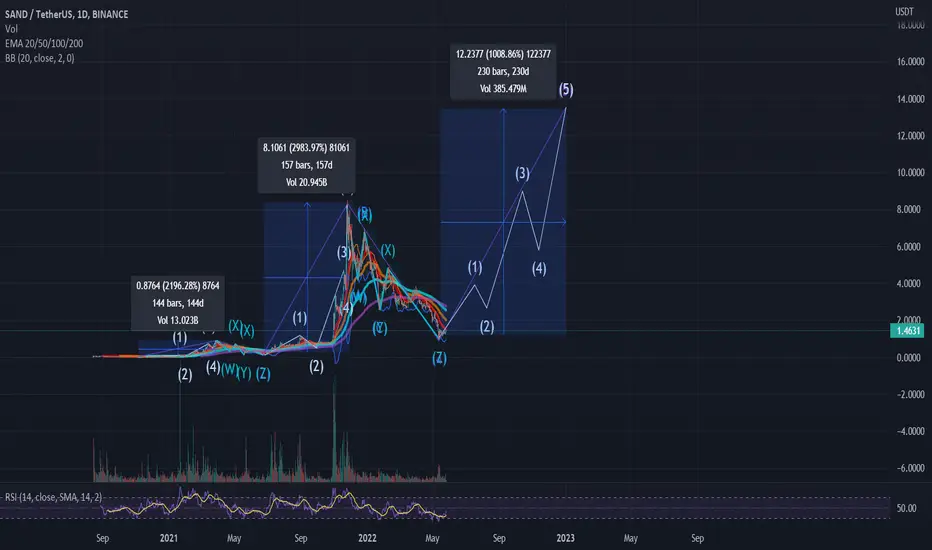
sand/usdtTesting/tracking elliot wave theory. Please do not trade off idea without S/L. Not financial advice.
With the recent events on cryptocurrency; I think we will start seeing less coins getting pumped and more of the solid coins getting attention. By solid, I mean coins that actually has a project and some kind of revenue coming in. Currently a lot of coins are back to prices of last year, if not, then lower. This makes it a great entry point for those that wanted to get in a few months ago, but thought prices were too high. Sand's (4th) wave count has retraced to the peak of wave (1) and bounced nicely. This is usually a good indication that the bottom is in. We don't normally enter wave 1 territory unless btc does something drastic. The market sentiment is still uncertain and people are fearful, which makes it a perfect opportunity for institutional investors to start investing.
$SAND Target 1.64$$SAND wait for breakout on above average volume before entering a position - Target 1.64$
Not all Entry Criteria have been met yet:
1. Price above 10, 20 & 50 EMA --> Check
2. Consolidation Phase in Uptrend --> Check
3. Breakout on above average Volume --> not yet

#SAND/USDT TRADE SETUP Hi guys, This is CryptoMojo, One of the most active trading view authors and fastest-growing communities.
Do consider following me for the latest updates and Long /Short calls on almost every exchange.
I post short mid and long-term trade setups too.
Let’s get to the chart!
SAND also looks bullish here. Long some here and add more up to $1.44
Remember to get in partially don't buy at once. It's important to keep your entry as low as possible. The best way is to buy in parts which will eventually average your entries.
Target:- 20% to 30%
SL:- $1.38
Lev:- 10x
This chart is likely to help you in making better trade decisions, if it did do consider upvoting this chart.
Would also love to know your charts and views in the comment section.
Thank you

Sell sandThe previous trend was a fall. The pattern chart was also a fall, but it had an upward leg that could not break the previous ceilings.

#SANDUSDT 2H Chart
Price has been consolidating with no major movements for a while now and left liquidity above the refined 5mins demand at $1.25. MACD is not clear, RSI and EMAs are neutral. I expect price to tap into the 5mins demand zone before moving up again towards the 1h supply at $1.38 as a short term target. However we may see further bearish movements if the 5mins demand zone gets broken.

SandUsdt Following the trend its look like there is a breakout in Sand, Following Simple Price Action with SL and target.
Keeping it simple in messy time
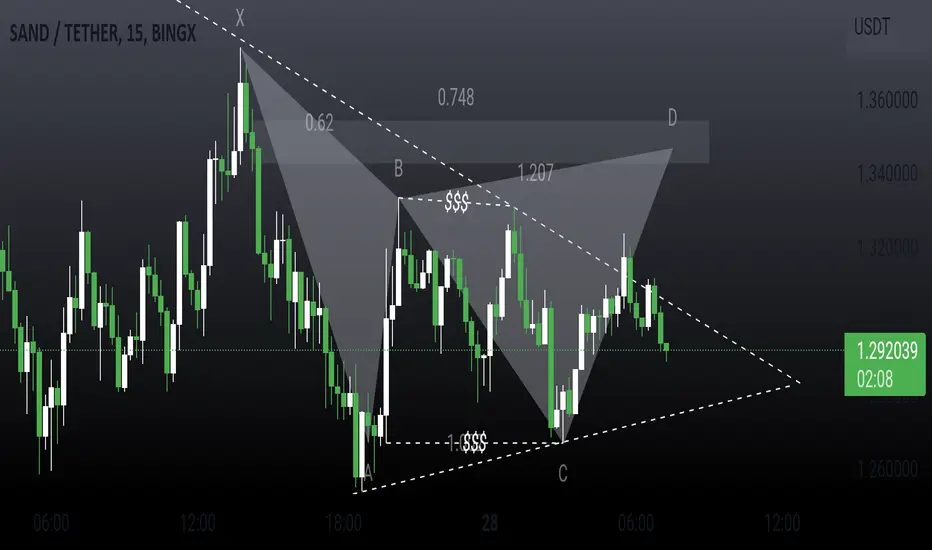
SAND shortSAND possible short entry at the D leg, SL just above the Supply, TP above trendline which is also the final TP of the Gartley pattern
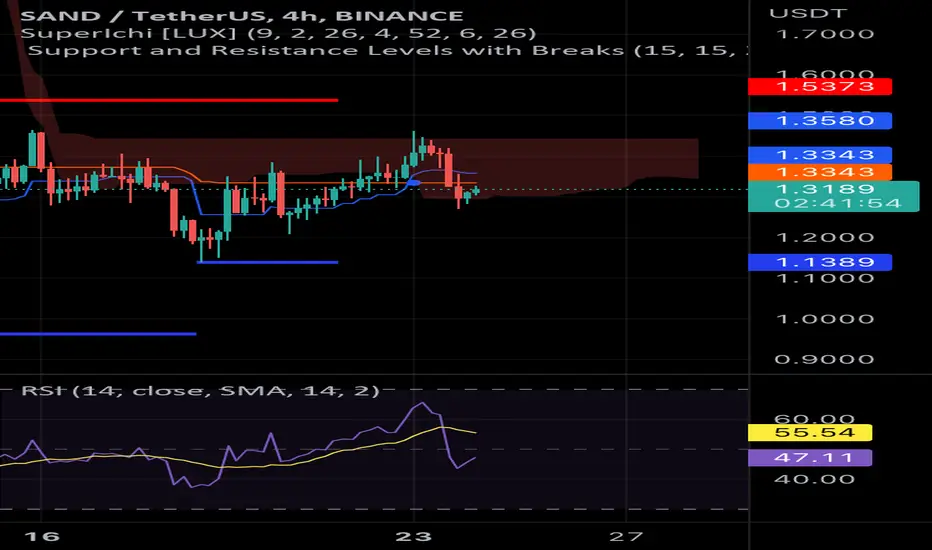
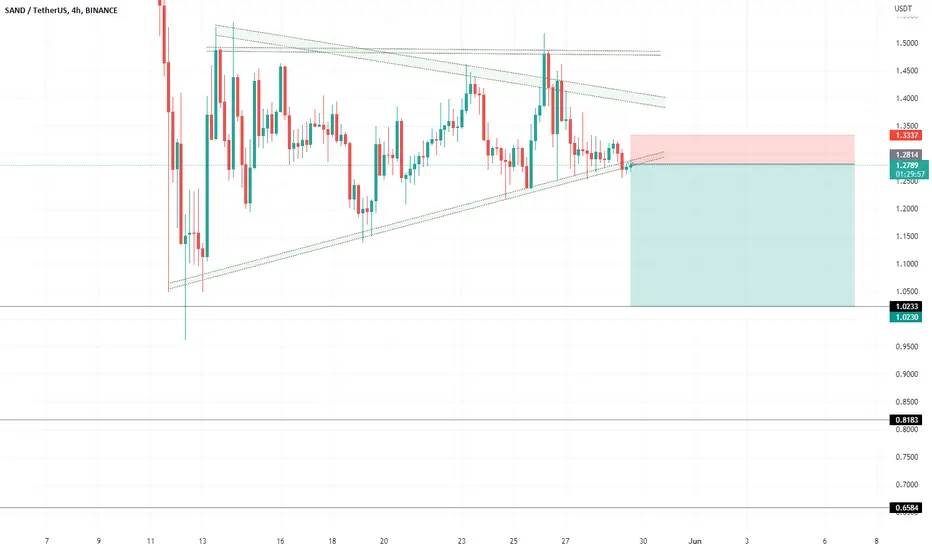
SANDUSDT ! The price goes down in stepsSANDUSDT continues to fall. The price moves down in "steps" when under the consolidation, after the breakdown of support, a new consolidation is formed, which uses the previously broken support as resistance. This indicates a strong trend. There are no deep pullbacks that could break the level up. Therefore, there is no buyer.
A new local consolidation 1.5300 - 1.0492 has formed on the chart. There is local support and the price on the lower timeframe forms a pressure to this level.
I assume a breakdown of support and a subsequent fall in prices along the trend. In the short term, I am interested in the target of 1.0492, and in the medium term, the support of 0.7480
Respectfully R.Linda!


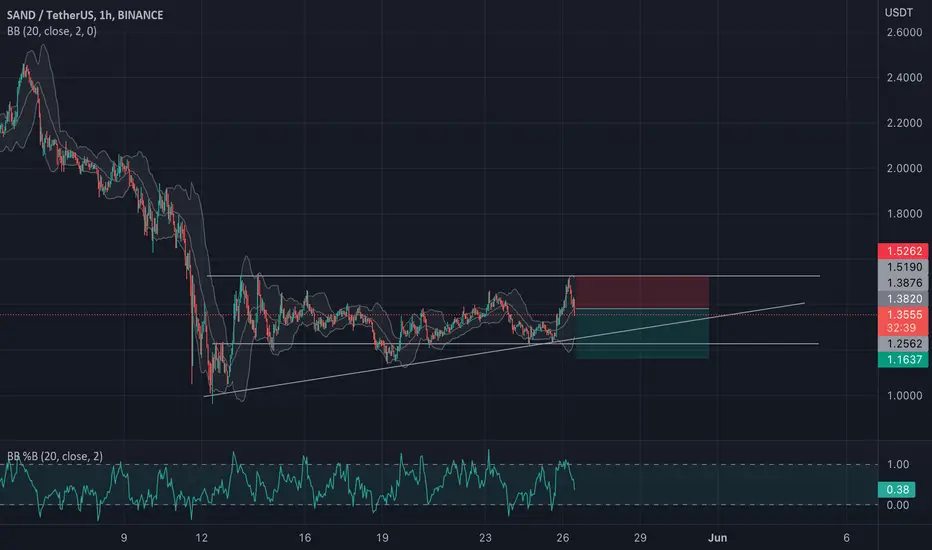
SAND/USDT possible short-term positionHey guys
We sow a possible entry place for short position on SAND. Our target is $1.22 from where we expect to have a pullback. Stoploss must be places if 4h candle closes above $1.55.
If you like ideas provided by our team you can show us your support by liking and commenting.
Yours Sincerely,
Swallow Team.
Disclamer:
We are not financial advisors. The content that we share on this website are for educational purposes and are our own personal opinions.
SANDUSDT: Bearish Symmetrical Triangle, Going to Under 1 USDT?Hello Fellow Sandbox Investor/Trader, Here's a Technical outlook of SANDUSDT!
Support our content by smashing the like and follow button, you also can share your opinion on the comment section below.
SANDUSDT has broken out of the symmetrical triangle pattern. The breakout accompanies by increasing volume which indicates a potential bearish bias ahead. Furthermore, The MACD indicator created a death cross, which confirmed a potential downside momentum to the target area.
The roadmap will be invalid after reaching the target/ resistance area.
"Disclaimer: The outlook is only for educational purposes, not a recommendation to buy or sell the cryptocurrency"

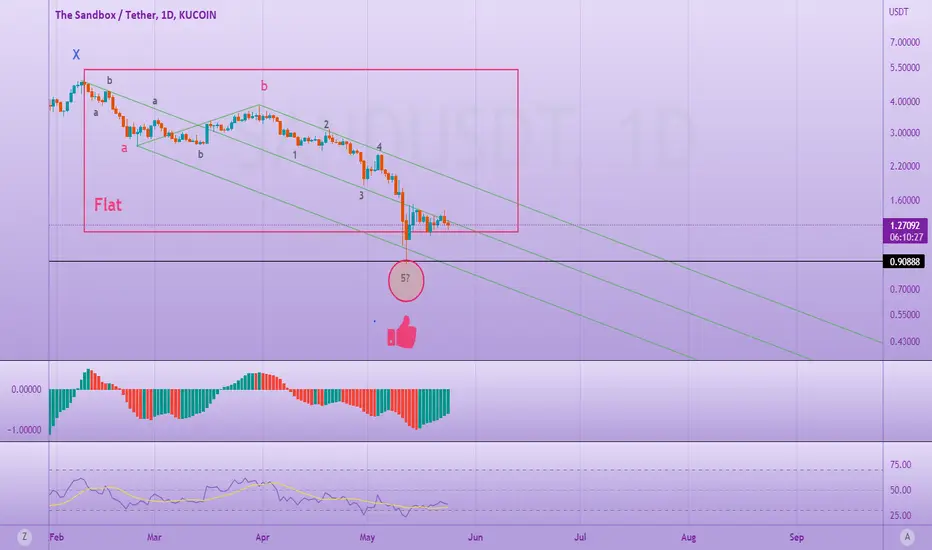
SANDUSDTWOW!
sandusdt/D1
GREAT reaction on pitchfork where I was shown that there must be the end of the wave 5 .
this wave 5 is the end of the wave c of flat pattern.
the last analyze of sandusdt is on my profile you can see it ]:
DONE PROFIT LONG FOR SANDTnx for operating SAND. Have a nice day. You?
You follow the long or short?