SANDUSD Double Bottomed. Dynamics to keep in mind.Sandbox made yesterday a Double Bottom on the January 10 Low. So did the RSI on the 1D time-frame. Last time we saw Double Bottoms both on the price action and the RSI was on September 28 2021. That was the last low before the October-November rally started. A break above the 1D MA50 (blue trend-line) should be the confirmation.
If however SAND breaks lower, it should seek the bottom of the long-term Channel Up that started on January 2021 (Fibonaccis used).
--------------------------------------------------------------------------------------------------------
** Please support this idea with your likes and comments, it is the best way to keep it relevant and support me. **
--------------------------------------------------------------------------------------------------------
SANDWMATIC_D85A25.USD trade ideas

SAND Outlook: Short term outlook and Support Levels in Play SANDUSD
Keeping it short and simple for this analysis - SANDUSD currently experiencing bearish expansion on Bollinger bands through the lower TFs and appears to be re-testing bottom support @ the $4.30 in the coming days. Right now, price is sitting @ $4.60 and is bleeding down to lower levels with rest of crypto for the time being. If the $4.30 level does not hold, I'd be looking for sub $3.50 as the next potential entry level, and will plan accordingly in the event we see this.
ET

SAND/USDT - Potential 96% SetupHello Traders!
After the rapid growth SAND went to the correction.
The price is near the upper range of the buyers' interest zone $4.00 - $4.74. A "descending wedge" trend continuation pattern is forming on the chart. MA100 on the daily timeframe is near the level of $4.00
It is possible to look for purchases in the range of $4.00 - $4.40, relying on the repeated decrease of the instrument to the level of $4.00.
It is worth closing the position using a stop-loss if the price goes under $2.78
The targets will be the following price levels
$6,42
$7,52
$7,94
Good luck and watch out for the market
P.S. This is an educational analysis that shall not be considered financial advice

SAND Breakout!Sand has formed very strong support around 4.19$ and now has broken a bearish channel. After the breakout, the price did a retest and now the probability of momentum change has gone up. Manage your risk according to SL and TP that I mentioned. Gd luck!! NFA

SAnd in a flag and has room to test higher targets shortly like to see sand atleast hit the trend line in weekly time frame and move the way up to previous highs

SANDPERP Going DownSANDPERP on daily chart shows bearish harami together with crossing EMA's (10 and 20). Time to short again. FTX:SANDPERP

let's lie on METAVERSE's SANDS!watch SAND for buy setup,wait for descending trend lines to break ,oscillators to make a bullish cross and forming a reversal pattern

SANDBOX future coin!We have just taken a long position on SAND because we think this is a very cheap price. We strongly believe in the future of this metaverse coin so this is a long holding strategy with no leverage or stoploss.
Have a great trading day!
Life is a beach and I'm playin' in the #SANDGet your beach gear ready, because its time to go play in the SAND!
As you can clearly see on the 4HR chart, SAND is nearing another big breakout, so get yet your pales and shovels and meet me at the beach!

SANDSTORM INCOMING! $SAND ON SALE! #speculationThe Sandbox price today is $2.65 with a 24-hour trading volume of $712,608,464. SAND price is up 0.8% in the last 24 hours. It has a circulating supply of 890 Million SAND coins and a total supply of 3 Billion. If you are looking to buy or sell The Sandbox, Binance is currently the most active exchange.
How do you feel about The Sandbox today?

Sandbox Price Prediction 2022 coin price forecast fundamental
Sandbox price started in 2022 at $0.33. Today, Sandbox traded at $5.53, so the price increased by 1578% from the beginning of the year. The forecasted Sandbox price at the end of 2022 is $27.02 - and the year to year change +8103%. The rise from today to year-end: +389%. In the middle of 2022, we expect to see $14.82 per 1 Sandbox. In the first half of 2023, the Sandbox price will drop to $25.70; in the second half, the price would add $5.16 and close the year at $30.86, which is +458% to the current price.
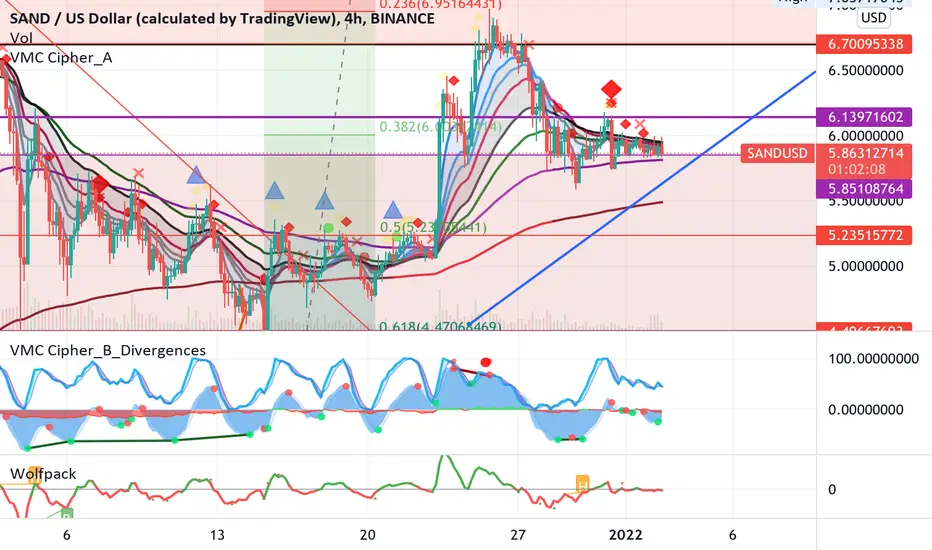
BIG Move coming for SANDIn this 4H chart, the ma ribbon has been converging & holding 5.85 for quite a while.
Wolfpack holding zero line & Mkt cyphers B also making a higher low.
Caution: there is still a chance SAND is making a bearish flag…
W/ the stoichastic rsi slowly going down.
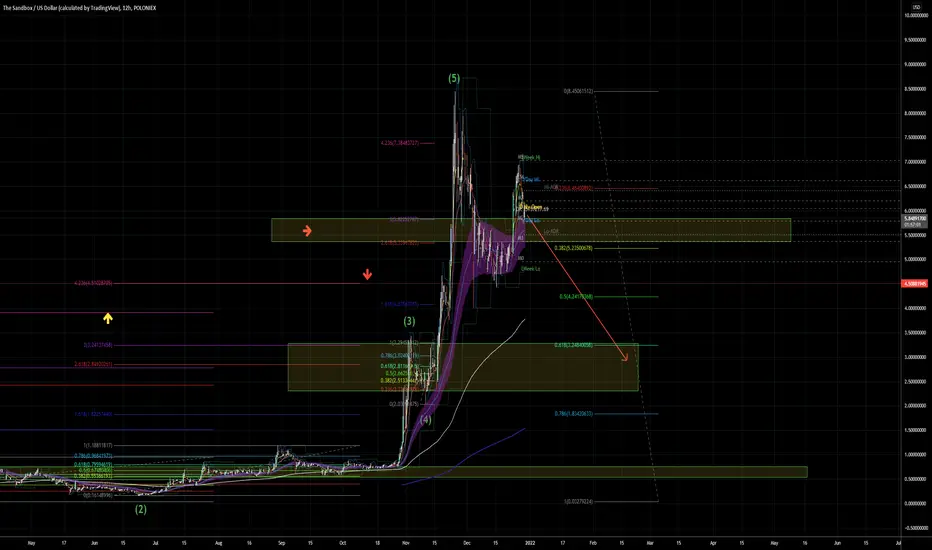
After recent big zigzag ABC down, SAND may be starting a new 5 wave
uptrend if does not go below 5.24 & 4.50
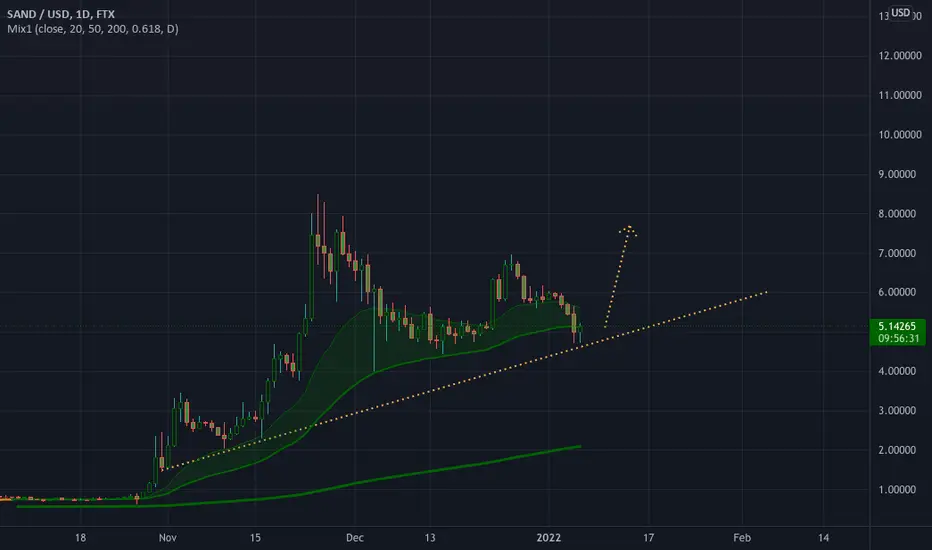
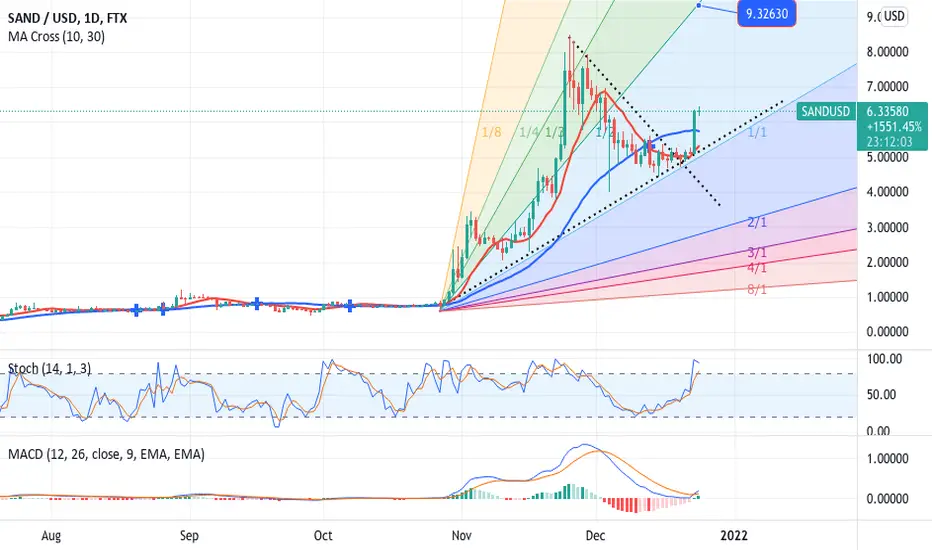
Sandbox beginning of the year predictionSandbox has still a Buy signal for the beginning of 2022.
I look for a return to $7.5 by the end of January!
Happy New Year!

SandboxPrevious calculation where I said "a possible tiny leg upwards" was a bit understatement what we saw happen. However, I expect a similar retracement now that Shiba Inu did. Slow slide down to the green area.
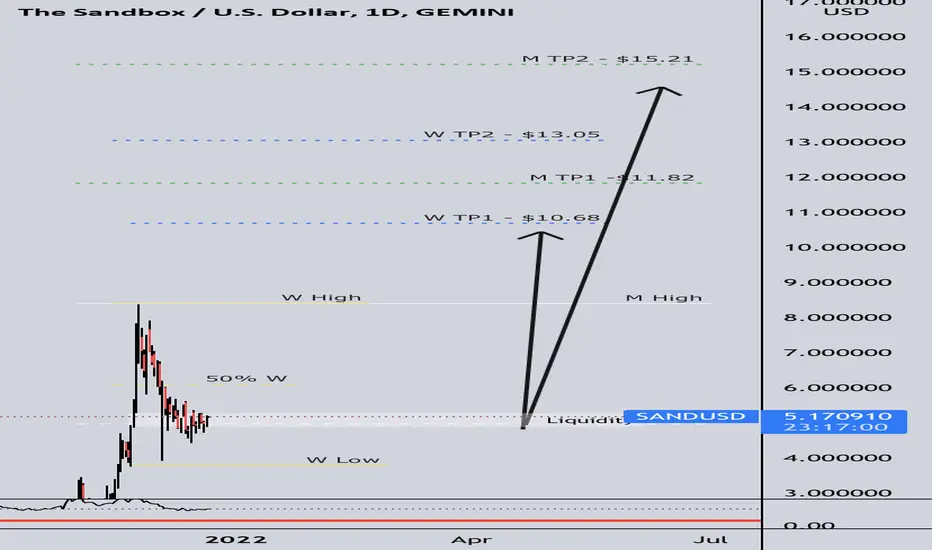
SAND/U.S.Trendline respected..I did this idea a while back, it has yet to create it's fractal as still being a bit new to the board of crypto, this Metaverse world will become something big i just think because i like the projects myself. Now the liquidity game is on so be careful..I never speak to much for a reason. The RSI bounced on the 50MA quite nice, the engulfing took over a while ago in correction phase of PA I believe.
P.S. I am not an financial advisor, these are notes to self. Do not take these trades based on my assumption
Trade Safe

SAND LONGConditions:
- 13 EMA crossed over 21 on the 4H
- brokeout of descending trend line with decreasing volume of selling, retested top of channel line and bounced off
- MACD sloping up, in bull territory
TP next major resistance
SL below the breakout bull candle

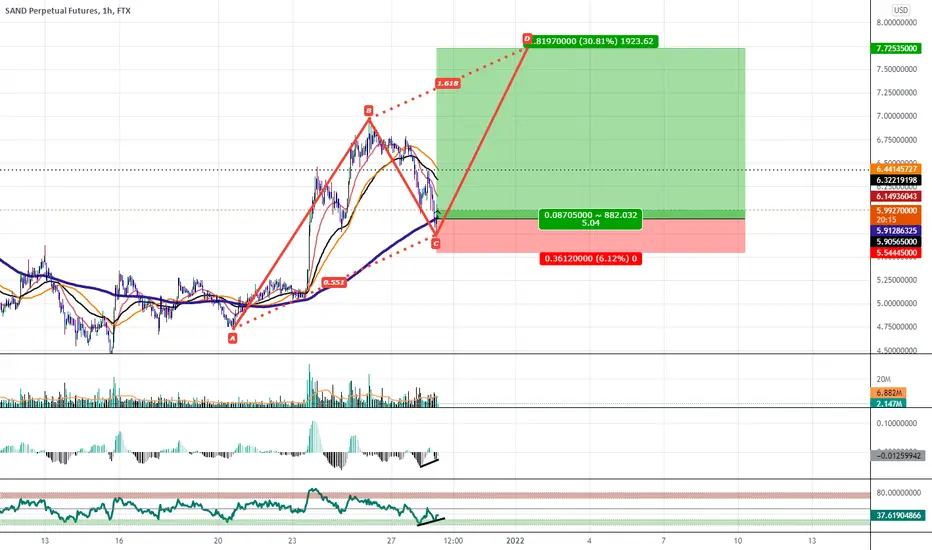
Early C Entry Bullish BAMM Continuation on SANDWe have some Bullish Variables at the 200 Hour Moving Average Suggesting a reversal and a move up that could be part of one big 1 HR BAMM that would take us up 30 percent from entry.
Sand Price Prediction for Upcoming daysHello everyone and merry Christmas, hope you guys are doing well.
First of all this is not financial advice and this is only my personal TA.
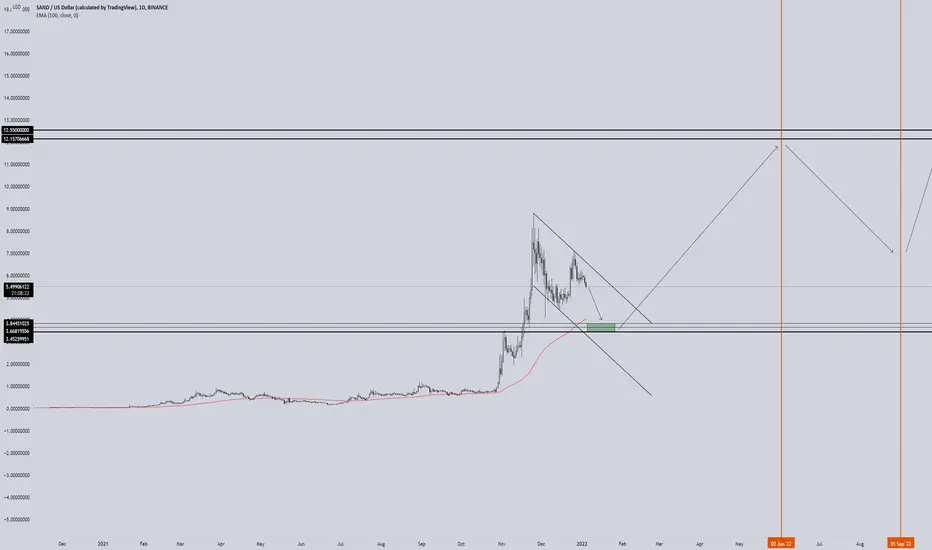
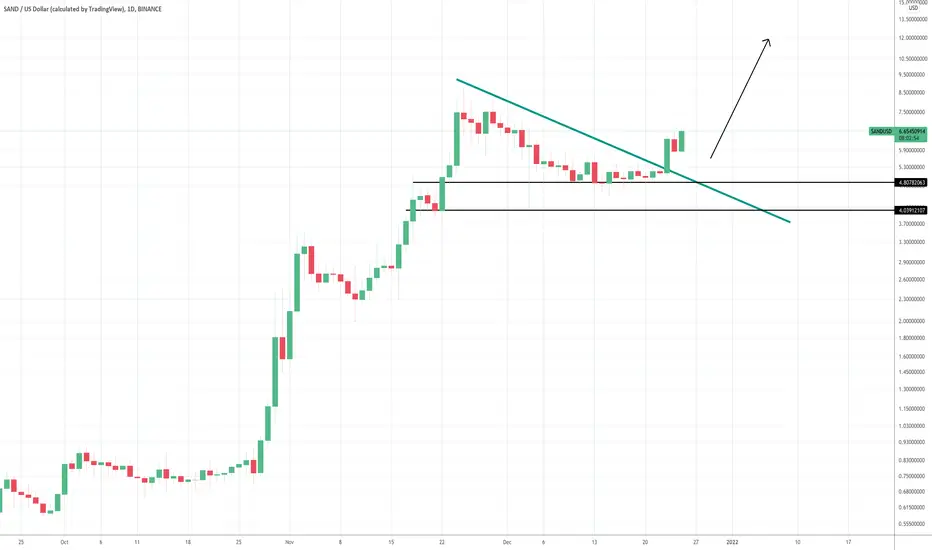
Between Jan 20.2021 and March 27.2021 we saw the same behavior from Sand on daily chart. It is highly possible for it to repeat the trend as other coins have repeated the same concept before.
I can see easily sand between 10 to 12$ for the next couple of months.
Yeah! That's it for now.

SANDBOX Are We About to See Another Wave?!?!Pretty textbook bullish breakout playing out here on Sandbox against USD. Nevertheless, we could see a re-test which could take us as low as 4.8
Sand GOing for Huge LEG UP! (AXS the 2nd)obvious ascending triangle forming here.. Sand GOing for Huge LEG UP! (AXS the 2nd) Sand GOing for Huge LEG UP! (AXS the 2nd)

SANDUSD - BUY strategySAND is going to perform well looking at the chart.
Buying should be between 5.75-6.25 and the profit objective may be somewhere 9.30.
Stop-loss I suggest below 5.50.
The Sandbox (SAND) starting the next runThe supertrend indicator was again good support.
The RSI is heading up - has still room to grow.
Will we see a new ATH? What do you think? 😎
Drop me a nice comment if you'd like me to analyze any other cryptocurrency or do another comparison.
*not financial advice
do your own research before investing

Sandbox idea updateLast post on sandbox highlighted liquidity area. We have now reached the area and price seems to be accumulating. Will we be seeing higher prices for sandbox from here??