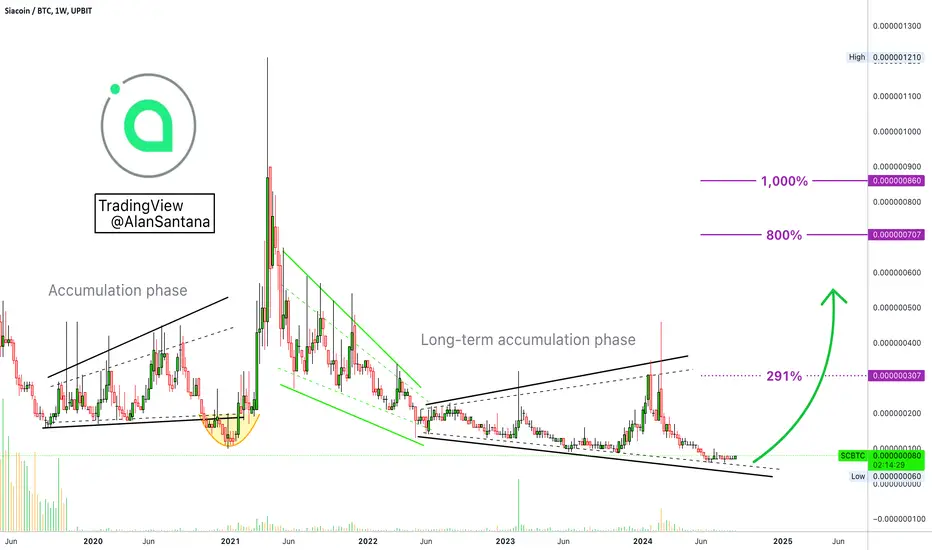
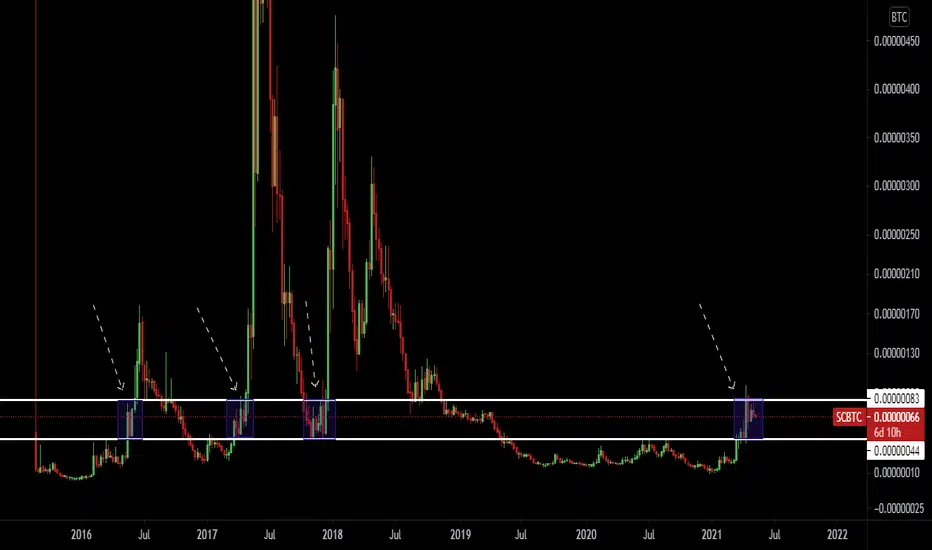
Siacoin True Bottom (ALT) & 1,000% Growth PotentialMy dear reader, we have a true bottom here when we look at the Siacoin vs Bitcoin (SCBTC) chart. This is important, TA wise, because it signals that only growth is now possible.
Once we hit bottom...
➖ Siacoin hit bottom in June 2024 at 6 satoshis.
The same level was tested again in June and then in July, both times holding strong.
➖ In early August 2024, 6 satoshis (0.00000006) was tested again and held as the bottom of the bearish cycle. This is the lowest price ever, in more than 7 years.
Needless to say, the last bull-market happened in the incredible year of 2021; we had something never witnessed before in our lifetime, a huge pandemic and we were forced like little children to wear masks and be "locked-down" in our homes... Thanks to the almighty God, the world didn't end. It turned out that Cancer, Heart Disease, Diabetes, Smoking and even being struck by lighting is still more dangerous than the highly propagandized seasonal flue. Anyway, the thing is that the market grew wildly while we were all glued to our screens.
➢ Back in 2021 Siacoin grew 1,111% in a period of 105 days.
If we go further back, this pair is old enough, there was another bull-market in 2017. There is a bull-market every four years in the Cryptocurrency market, so prepare for a new one in 2029.
➢ In 2017 SCBTC grew 1,500% within 63 days.
Some of the BTC pairings for many Altcoins did not produce an intermediate wave in 2023/24, this isn't the case for Siacoin. SCBTC grew 400% between November 2023 and February 2024. Growth was even higher on the USDT pair. Here growth was smaller because Bitcoin was really high and rising, people were not ready to part with their BTCs while it was moving up. The situation is very different now. Bitcoin has been bearish for 6 months and is ready to print a major leg down. People will be fast and happy to sell BTC for Altcoins, thus strengthening the potential for growth for this and other pairs.
➢ Long story short: Siacoin always pays and it looks good for 2025/late 2024.
We are now in the accumulation phase. Our strategy is very simple, buy and hold.
We buy and hold with the intention to sell when everything is up. Trading 101.
Buy when prices are low, near support; sell when prices are near resistance or at new All-Time Highs. With this simple strategy, you can't go wrong.
Namaste.
SCBTC trade ideas
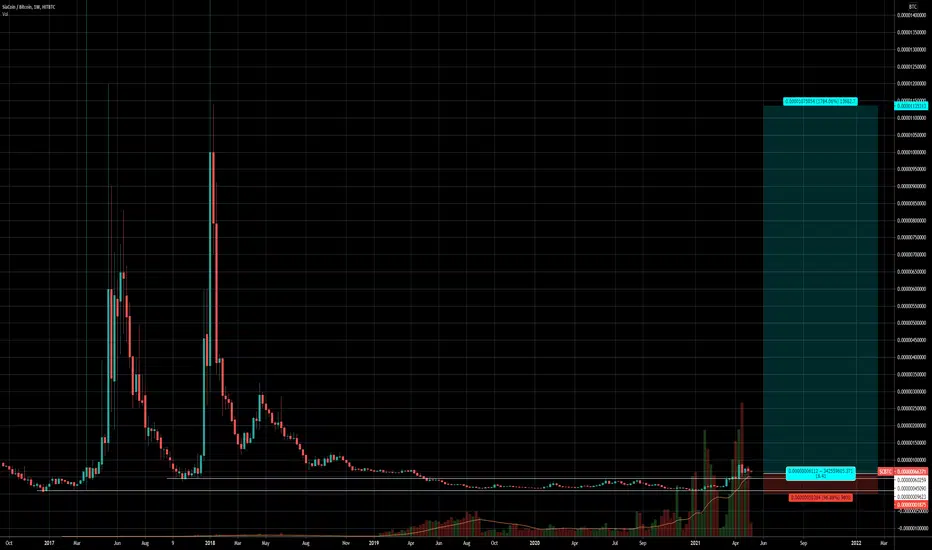
✳️ Siacoin vs Bitcoin | 130% To 455% Mid-Term PotentialThis is a pair we love and like, maybe because it has been around for so long or maybe because we have memories of those huge gains in years past... When there were only few pairs around to buy and trade.
Siacoin (SCBTC) has been growing since the 23rd of October 2023.
It is mapped on the chart as the market bottom/low.
Currently trading above EMA50 weekly and a long lower wick, back to green... This is a strong signal that points towards growth.
The targets can be seen on the chart but remember, the market can always surprise.
It can go higher and for longer than anything we can expect or anticipate... So build a plan where you prepare for the worst and hope for the best.
For example, I can sell portions on the way up, a certain percentage of my stack at each target.
Say I reach 400% or 500% and I am really happy with the results. I don't have to be 100% right so instead of selling all, I leave 20%, 15% or 30% behind... If it keeps on growing and goes more and more, I have some left to enjoy the higher targets... This is just an option, sometimes I can sell everything at 200%, move on and try again.
Different strategies for different people.
It all depends on your capital, your risk tolerance, your goals.
Thank you for reading.
I'll see you on the next one.
Namaste.

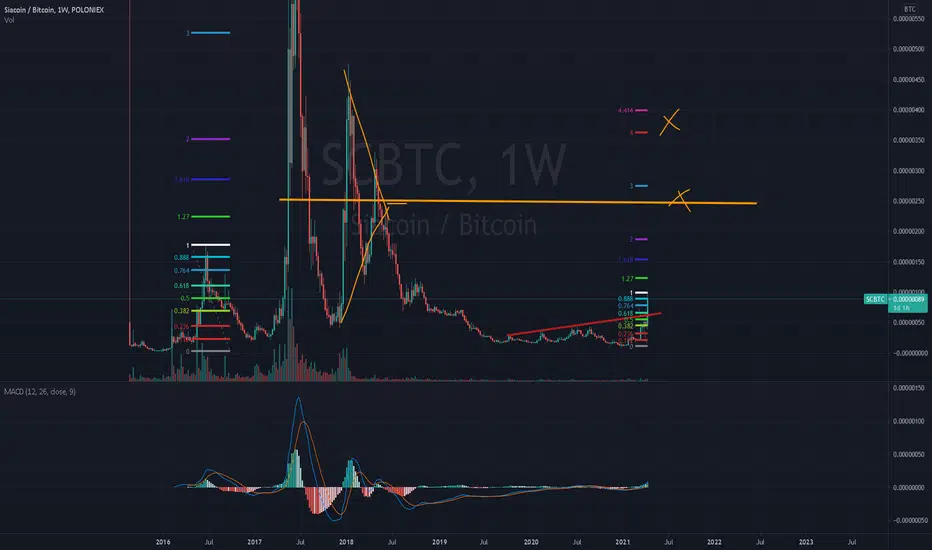
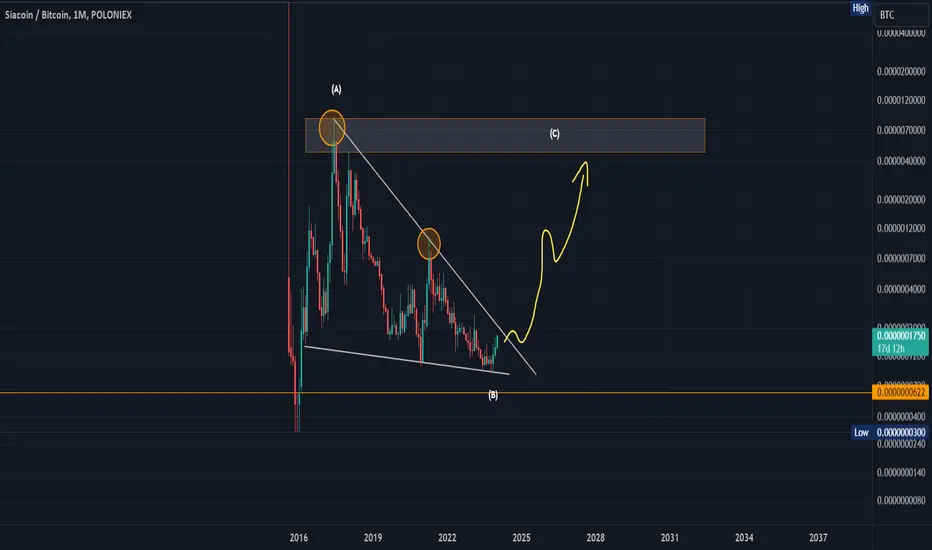
Sleeping monsterThere is a strong monthly impulsive wave that is incomplete, and it is about to retest the historical peak again, but the most important thing now is to break this historical downtrend, and only then will we turn our eyes to the historical peak again.. All the data is on the chart.. Good luck.
✳️ Siacoin | First Time Ever This Happens...Something really interesting is happening here with one of our most favorite, long-term trading pairs, Siacoin vs Bitcoin | SCBTC.
It is the first time ever that this pair produces 7 weeks closing green consecutively, this is a very strong bullish signal I should say.
We have a lower low this year compared to December 2020 and a recovery starting to take place.
✔️ Short-term we can see 65% easily and even 210% and more medium-term. Long-term is another game.
We will revisit this pair in several weeks time.
Thank you for reading.
Namaste.

✳️ Siacoin Major Bullish Potential vs BitcoinIt seems that Bitcoin will go sideways for longer based on these charts.
Another possibility is seeing Bitcoin and these Altcoins growing together, the everything grows phase.
I am saying this because here we have a very strong falling wedge pattern already breaking bullish. A strong daily candle passing above EMA50, a strong RSI, a strong MACD, everything being really strong in favor of a price increase.
Regardless of what Bitcoin does, Siacoin is looking bullish based on this chart.
80% potential is easy but can be more, 190% and even more if we consider the bigger picture , this chart is based on the short-term.
Namaste.

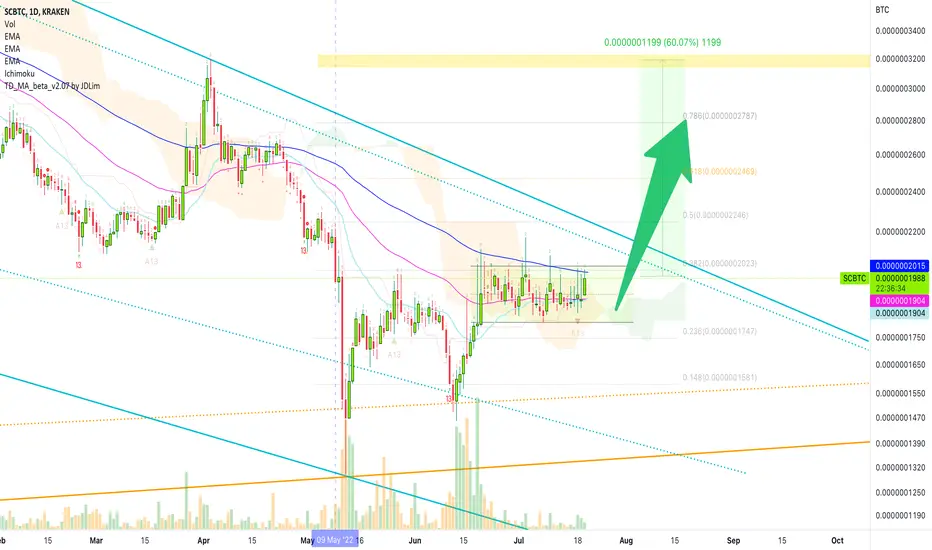
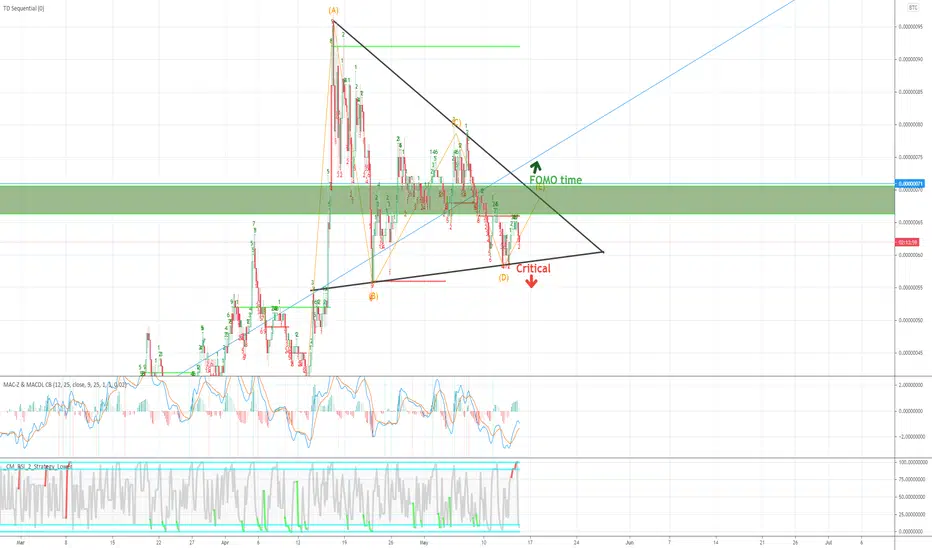
Siacoin Prepares For Major Move (60% Short-Term)A major move can happen on the Siacoin (SCBTC) pair but we start with the short-term target first.
EMA100 rejected growth back in April this year and this same level is working as resistance now.
Since SCBTC has been consolidation above EMA50 for the past month, as the EMA100 resistance gets challenged again we are alerted of an upcoming bullish jump.
As usual, low risk with high potential rewards.
We can have a 10-15% risk (stop-loss), while we aim easily at 60% to start but there can be 100% or more in the weeks to come.
Namaste.
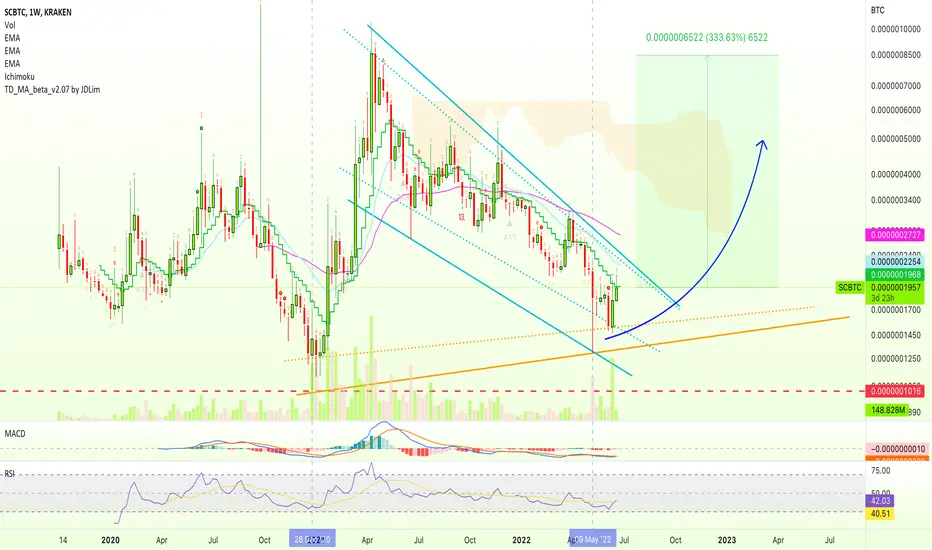
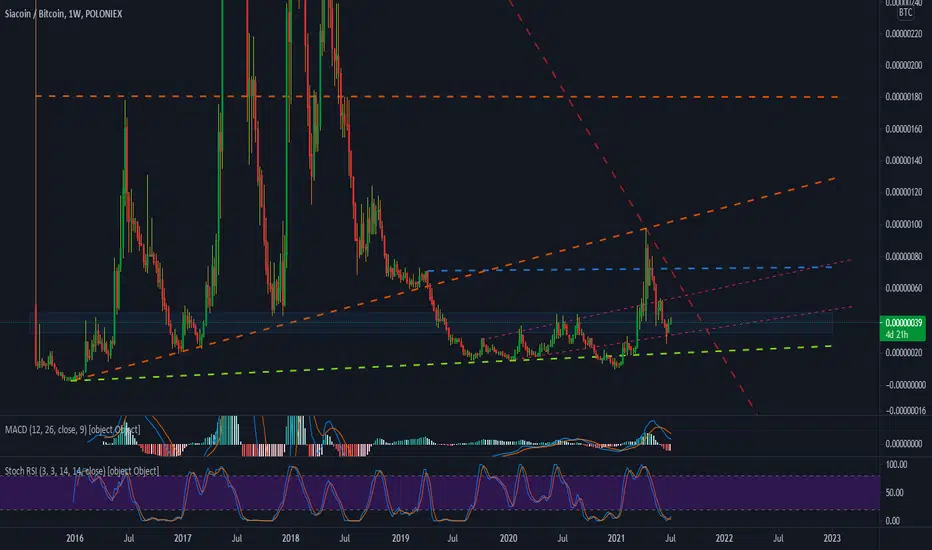
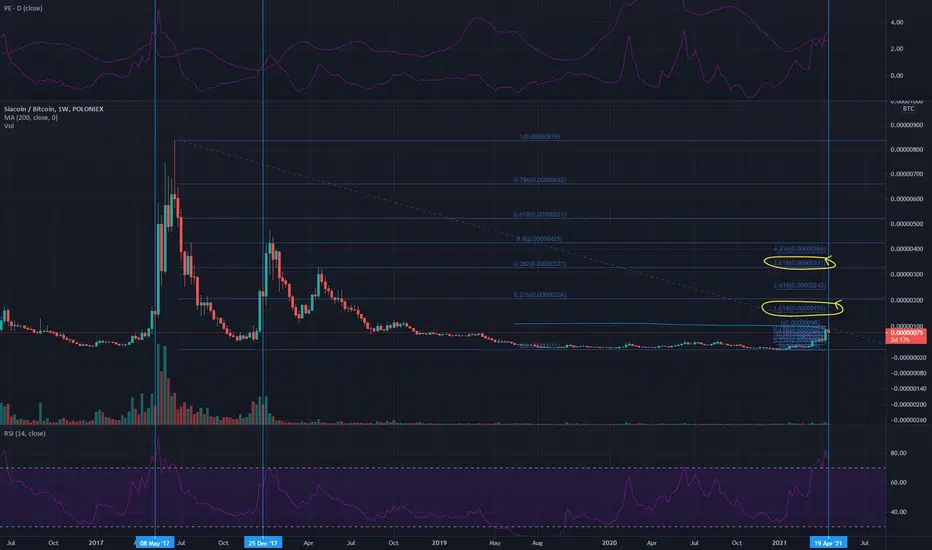
Siacoin Long-Term Higher Low | The Bottom (333%)Alright my friends its been a while since we looked at Siacoin vs Bitcoin so we are going to go long-term.
Is there more downside or will it grow?
We see a low set 9-May 2022 and this is very likely the bottom.
Because of the high volume.
If we look back at December 2020 we can see that right on the candle where the low was set we also have really high volume.
At the same time in both cases the RSI is at its lowest.
I can also see a bullish divergence with the MACD since March 2022.
I am mapping 333% potential long-term but there can be more.
Plan ahead before trading...
Stick to your plan and good luck!
Namaste.
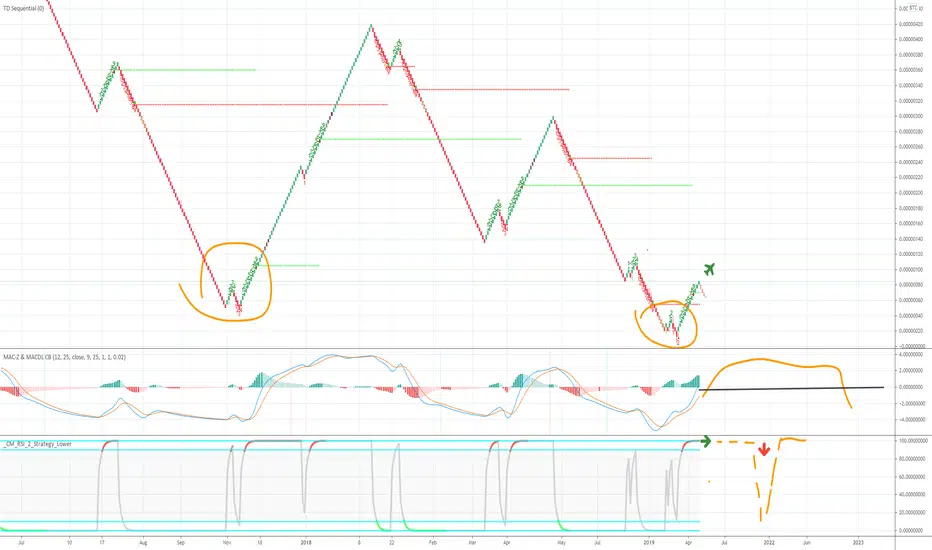
Siacoin bearishUnfortunately rally is done due to btc dropping significantly. Alts including sia will continue to bleed against btc money flow going red and sia broke down from trendline it held previously. Unless btc resumes bull cycle or begins a new one after a bear market, another rally will most likely not happen anytime soon. It is unfortunate as everything has been set up nicely for a great run. For now sia has entered a bear market. If a reversal appears and strength comes back into the market, I will update.
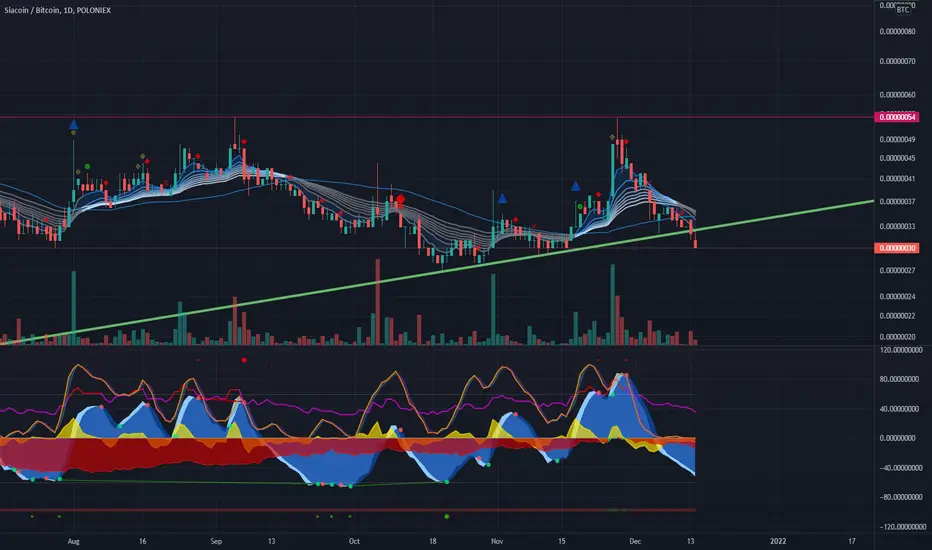
Siacoin very bullish against BTCCipher money flow indicator curling up the same way as before every big explosive bullish run on sia coin during bull market+ strong momentum waves (basic market cipher strategy)+bounce off of the trendline+increase in volume. Looking to break 54+55 sats level. 100sats to 375sats possible if 55sats level broken. Fundamentally skynet is releasing its monetization whitepaper very soon+possible coinbase listing this quarter.

Boomhehehe enjoy the ride. Momentum waves and money flow curling up. In a bull market sia always had huge runs. Enjoy.
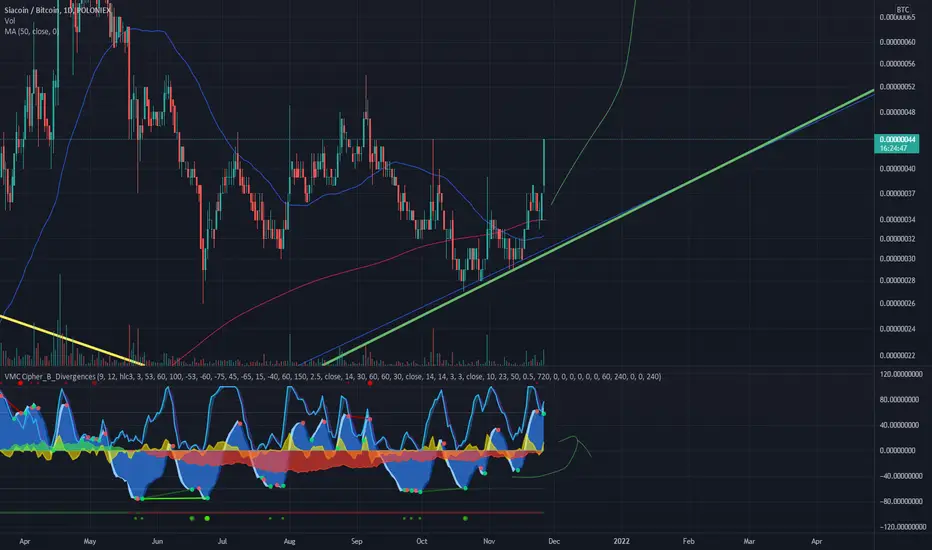
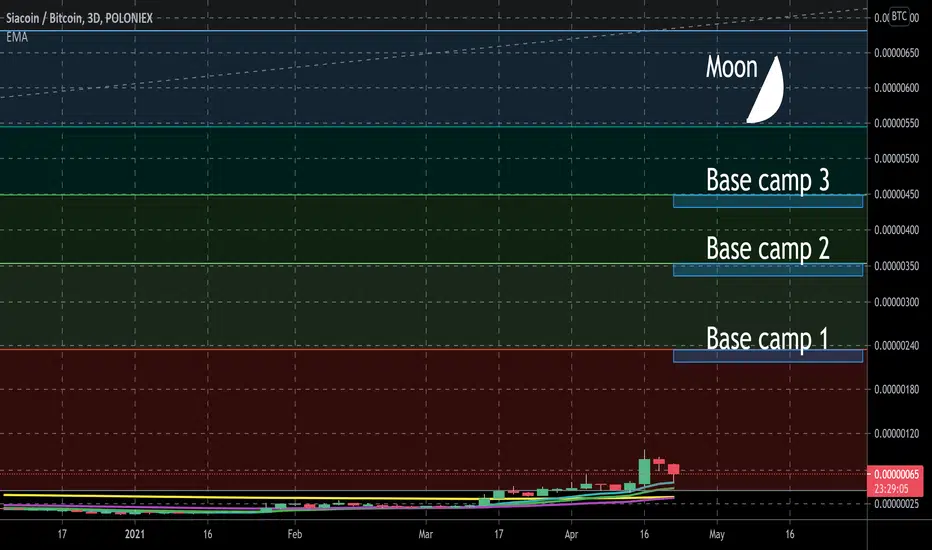
Siacoin Lift off. Very likely bullishSia to the moon. Look at the indicators and try to figure it yourself ,)

Siacoin multiyear breakoutsimilar pattern on XVG and Doge at one point. Decent project, chart looks primed for a moon mission, 17x to 1 R:R
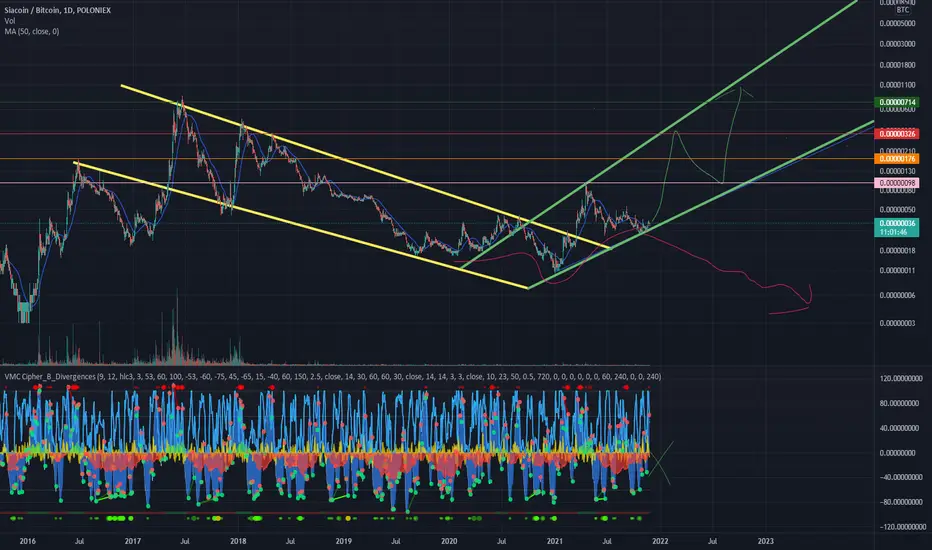
SC/BTC - ALTSummer 🚀 12xIt can be huge. There is no reason why it can't be real. Or? Write to the comment... What do you think about it?


153-310 sats by May 2nd, or exit!Just looking at the previous SC pumps with the paraeye. We had the crossover week, then +1 red candle retracement week. Then both times we had significant continuation (3.6x and 1.6x).
So... I will be looking for SC to pump to 153-310 next week. If not; take that as a bad sign, and find your nearest exit.
sc is "cheap"filecoin mooned. decentralized storage narrative? it's also "cheap" in usd. does it deserve a bigass mcap that will pump even higher? probs not. will it? dunno, uhhh maybe. 150 sats seems possible. 200 or 500 if we go manic like my depression