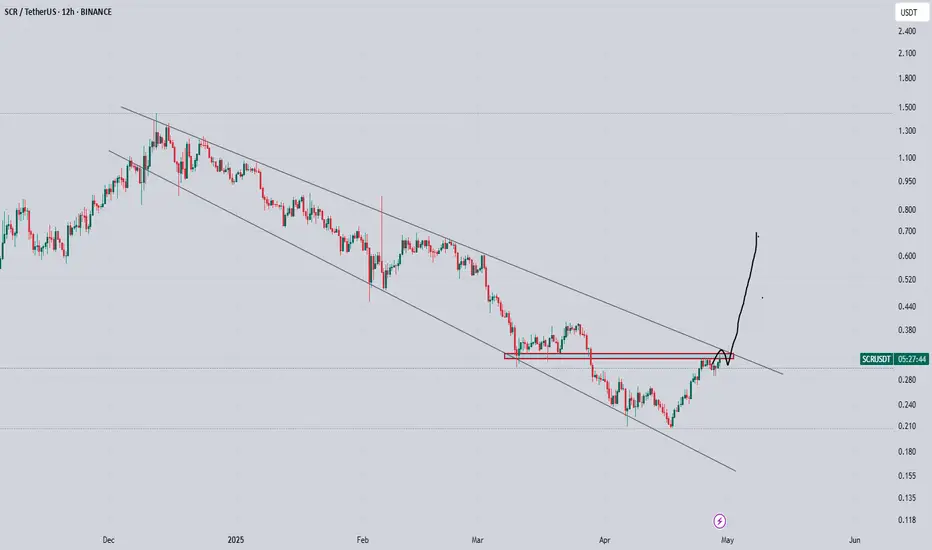
Downtrend Over? $SCR Just Flipped the Script!TSX:SCR just broke out after moving down for 139 days.
This isn’t just another pump, it’s a change in direction.
- Price broke the long-term downtrend
- Jumped above the 200 EMA
- Now testing the breakout zone again
If this area holds, bulls could take control and push higher.
It’s a clean setup

SCRUSDT 1D AnalysisSCR ~ 1D Analysis
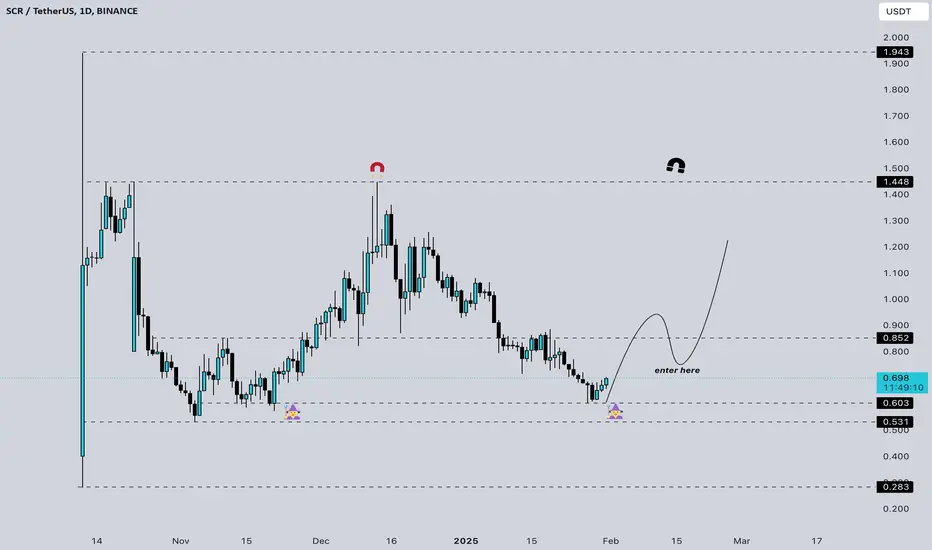
#SCR Buy after successfully penetrating this resistant line with a short -term target of at least 10%++ from here.

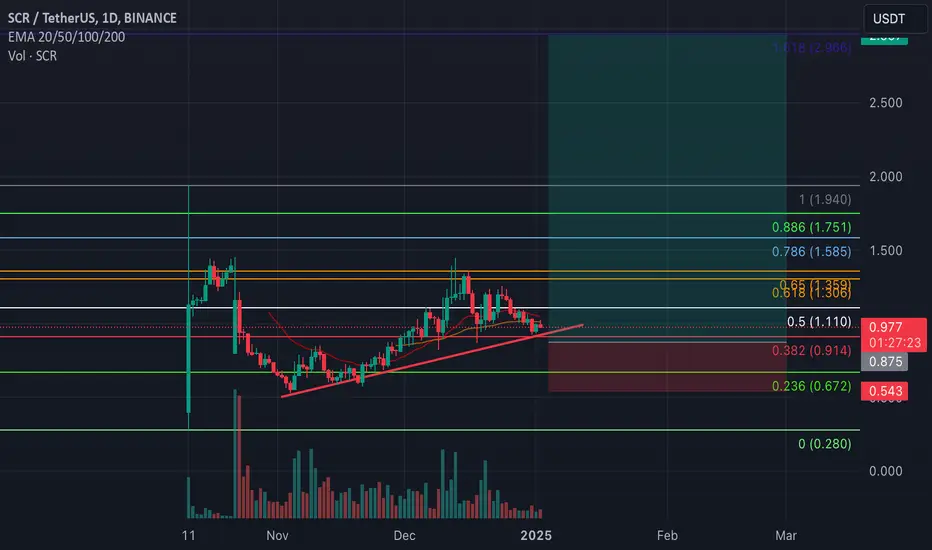
scr looking good for midterm Formed Classical Descending Broadening Wedge, And Currently Approaching Towards Descending Trendline, Trendline Is Weak Now Because It's Already Been Tested Many Times I'm Expecting Breakout This Time, After Breakout Expecting 2x From Scr
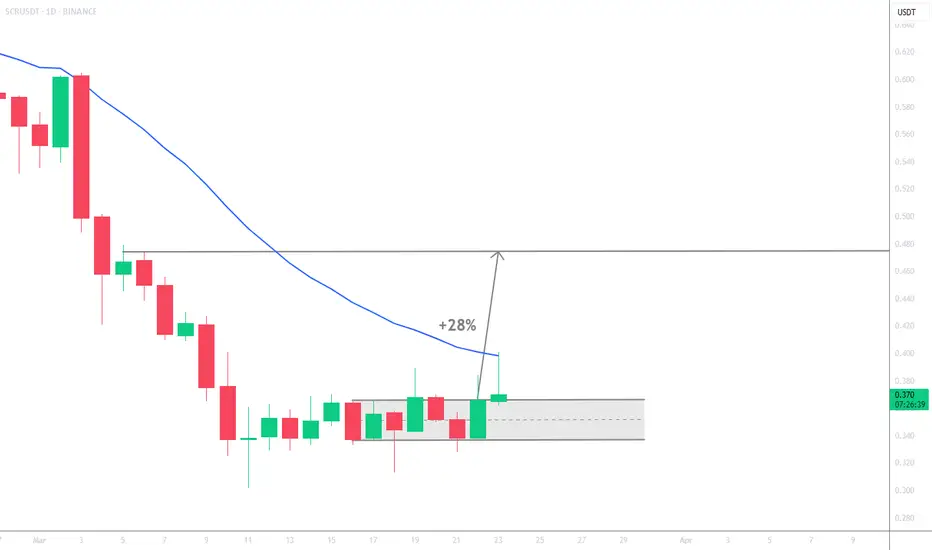
SCRUSDT BullishSCRUSDT buy signal on daily Timeframe. 0.3 is the lowest price on this crypto, now bulls are ready to move higher. Potential TP is 28%
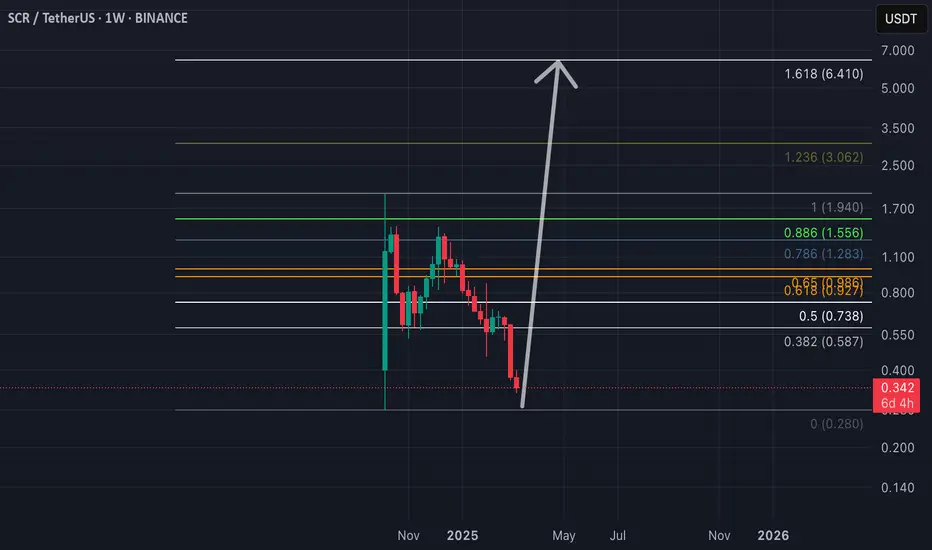
SCR/USDT Analysis – Weekly Chart at March 10, 2025.SCR has completed a significant correction, reaching a key Fibonacci support zone around 0.342. The chart shows a deep retracement, hinting at a potential reversal from this level.
🔹 Fibonacci Levels – The current support aligns closely with the 0.618 Fibonacci retracement level at 0.927, which is
SCR ANALYSIS (4H)From the point where we marked "START" on the chart, it seems that SCR's correction has begun.
This correction appears to be either a diametric or a symmetrical pattern. Currently, the price seems to be completing wave F of this diametric structure.
It may get rejected downward again from the red
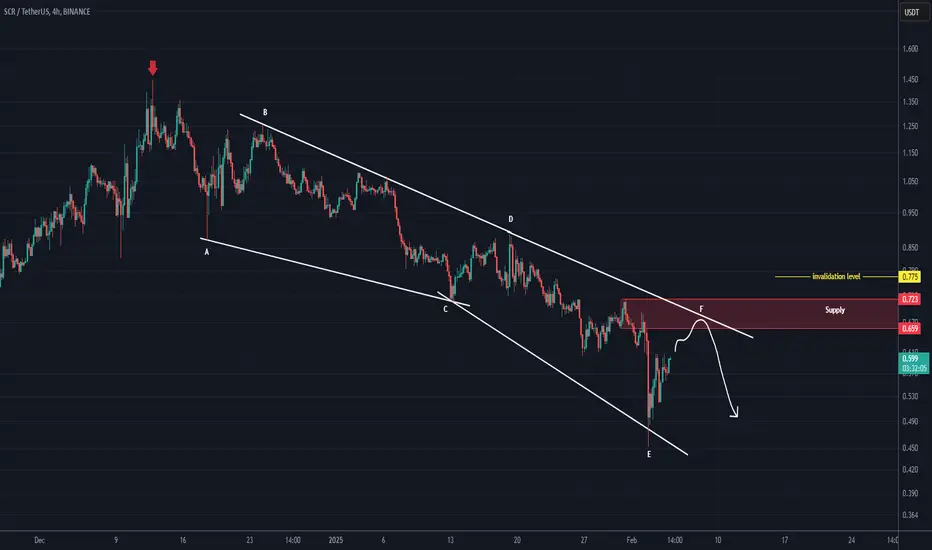
Three White Soldiers pattern at the bottom suggests a potential Your TA looks solid, and the Three White Soldiers pattern at the bottom suggests a potential reversal to the upside. However, let’s break it down:
Bullish Case:
1. Three White Soldiers Pattern – This is a strong bullish reversal signal, especially after a prolonged downtrend.
2. Support Held at ~
SCROLL is taking off this week!Finally the SCR accumulation is over and we are out of the triangle! My global target is 8$! I like how Polychain works with the assets they have invested in. Fibonacci values to lock in your positions on the chart, RSI unloaded, mm typed tokens and already running the script.
Horban Brothers!

Scroll/USDT năm 2025Scroll is a Layer 2 project in the scroll technology group, raising $80 million, mainnet and launching products in 2024
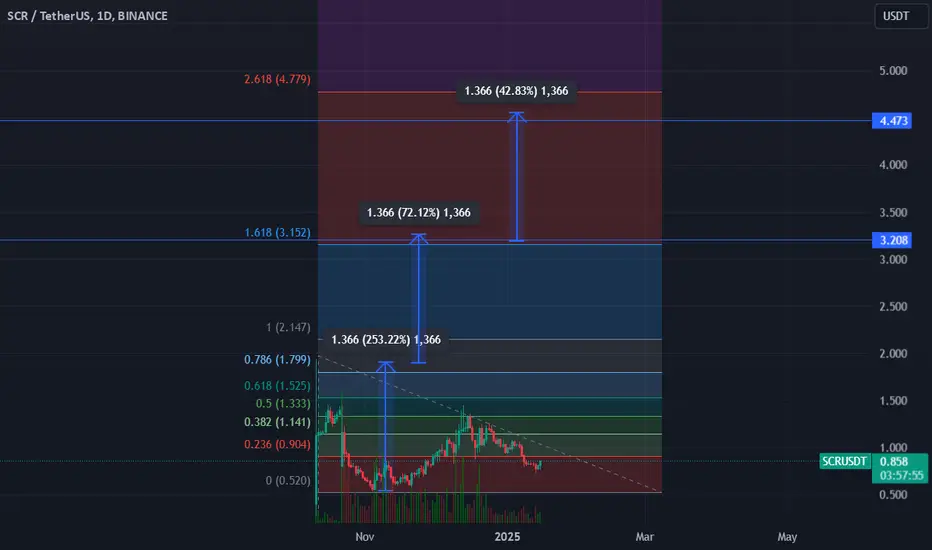
Scroll - January 3, 2025Today, I’m writing about Scroll (SCR/USDT). Currently, SCR is trading at $0.97, sitting close to the 0.382 Fibonacci level at $0.913.
Based on the technicals, I expect SCR to climb to the 1.618 Fibonacci level, around $3, in the next 2-3 months 🚀. During the much-awaited altcoin season, Scroll look
See all ideas
Summarizing what the indicators are suggesting.
Oscillators
Neutral
SellBuy
Strong sellStrong buy
Strong sellSellNeutralBuyStrong buy
Oscillators
Neutral
SellBuy
Strong sellStrong buy
Strong sellSellNeutralBuyStrong buy
Summary
Neutral
SellBuy
Strong sellStrong buy
Strong sellSellNeutralBuyStrong buy
Summary
Neutral
SellBuy
Strong sellStrong buy
Strong sellSellNeutralBuyStrong buy
Summary
Neutral
SellBuy
Strong sellStrong buy
Strong sellSellNeutralBuyStrong buy
Moving Averages
Neutral
SellBuy
Strong sellStrong buy
Strong sellSellNeutralBuyStrong buy
Moving Averages
Neutral
SellBuy
Strong sellStrong buy
Strong sellSellNeutralBuyStrong buy
Displays a symbol's price movements over previous years to identify recurring trends.