SEI Rebound or Final Trap?Yello Paradisers, have you considered that this little bounce might be the last trap before a brutal selloff? SEIUSDT is giving us strong signals that most retail traders are missing and if you’re not reading the structure clearly, you’re walking straight into a setup designed to clean you out.
💎Th
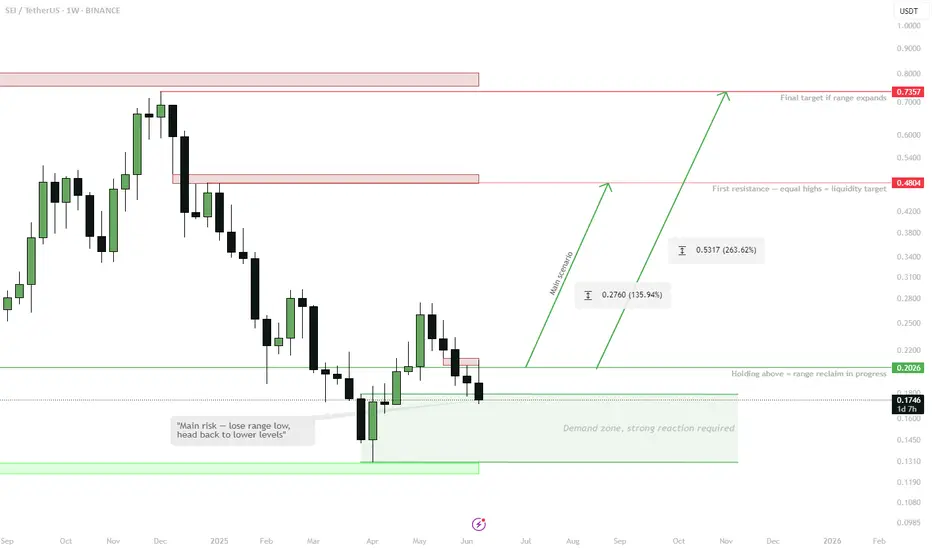
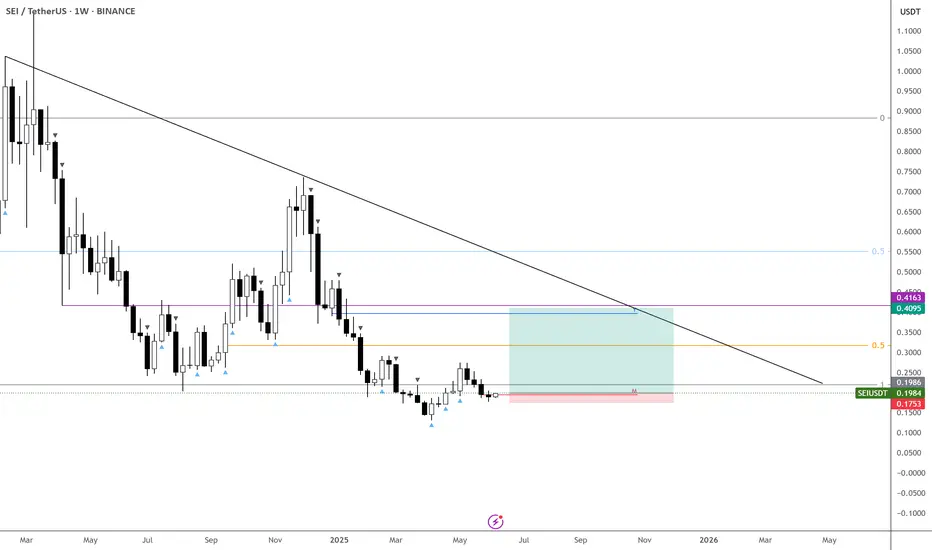
SEI | 1W range reclaim in progress.Holding above $0.20 (range low & demand zone) — expecting a move towards the mid-range ($0.48), where a stack of equal highs is waiting.
Lose $0.20 — invalidation, back to lower support.
Key idea: Range play, targeting liquidity at the mid-range. Macro resistance at $0.75 if breakout extends.
Acc
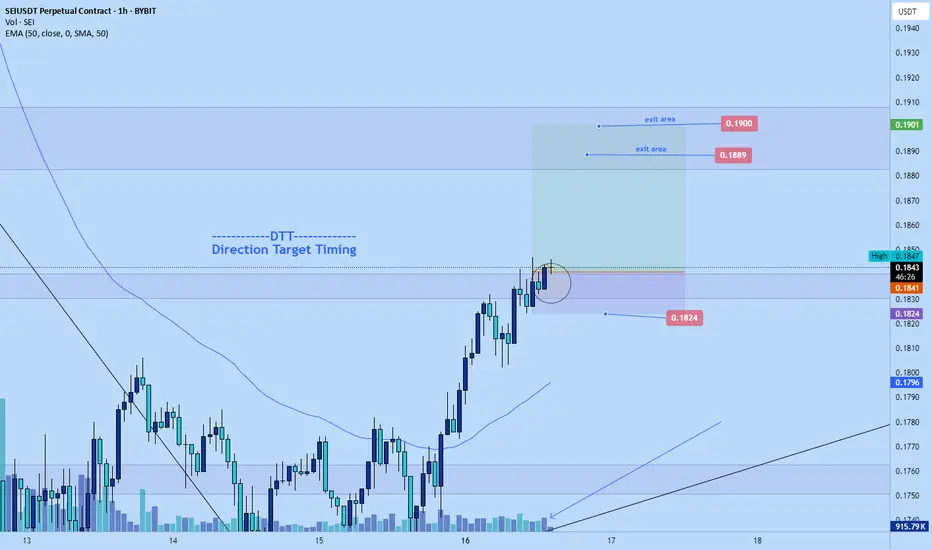
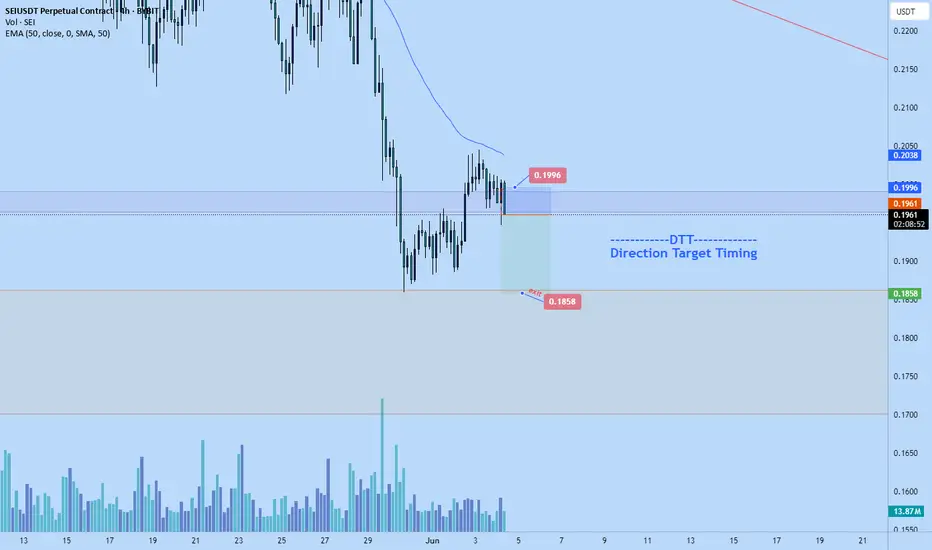
Sei long to $0.19 areaJust hopped into a long position on Sei. Am targeting $0.19 area to get roughly 3RR from the move given plays out.
Stop: $0.1824
Time sensitive.
Its relatively high but if btc continues to pump theres a good chance it will hit tp.
#SEI/USDT#SEI
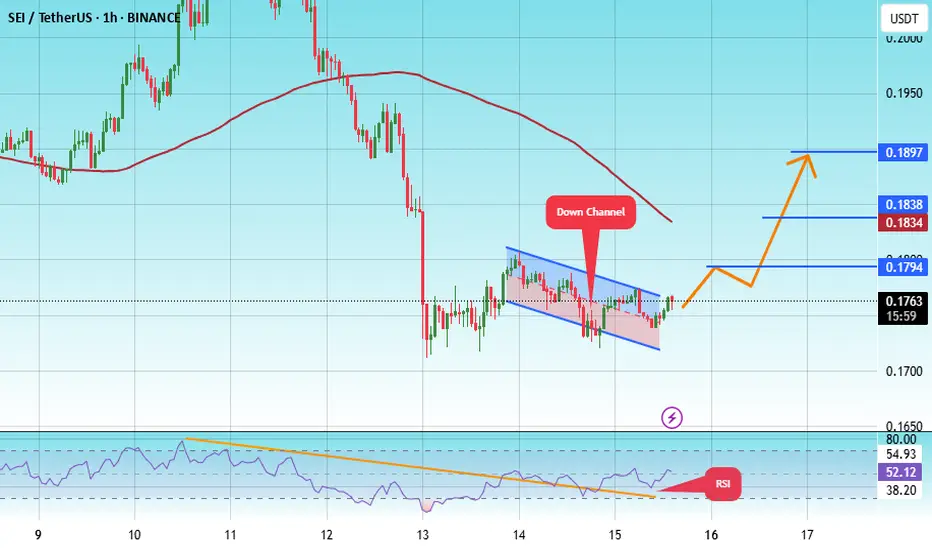
The price is moving within a descending channel on the 1-hour frame, adhering well to it, and is heading for a strong breakout and retest.
We are experiencing a rebound from the lower boundary of the descending channel. This support is at 0.1725.
We are experiencing a downtrend on the RSI ind
SEI – Clear Invalidation, Going Long at 20cGoing long here on $SEI.
Invalidation is straightforward—shouldn’t see new lows from this point.
First target is 40c. If that breaks, we could see solid momentum follow through.
BINANCE:SEIUSDT 2x
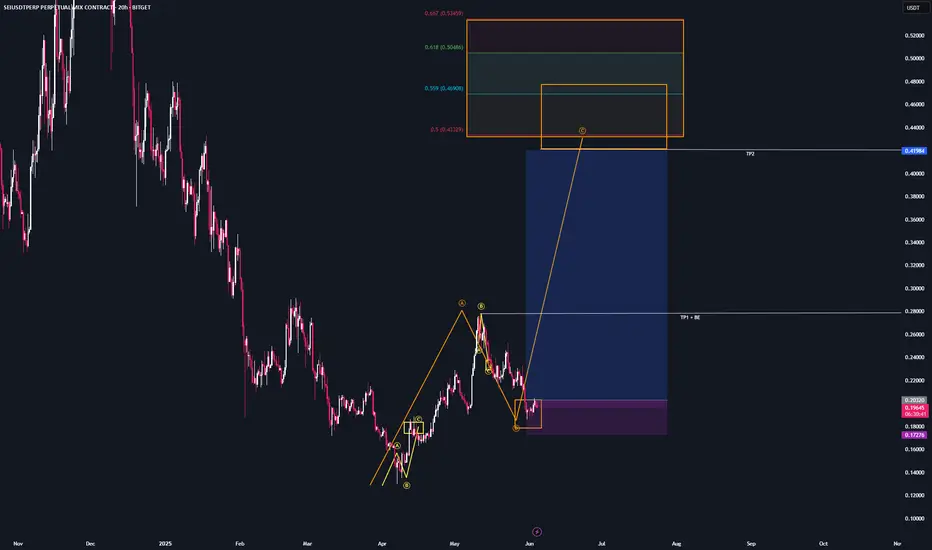
SEI - SetupI don’t have an active position on NYSE:SEI right now — I’m already heavily allocated to my three other setups.
But this is a potential trade I’d consider if I weren’t in the market yet:
Tp1 + BE : at $0.28 — recent highs
Tp2: at $0.41 — target region
If you have any questions about my system
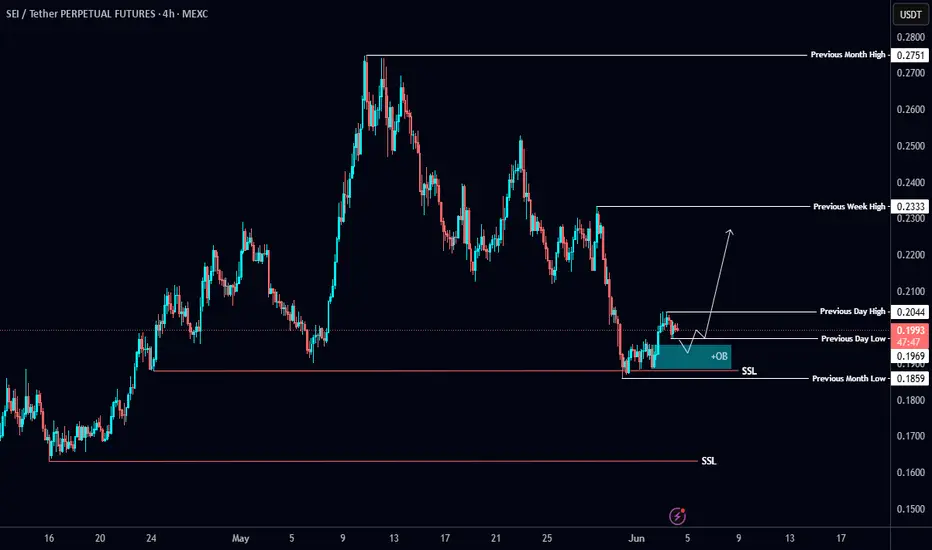
$SEI Analysis📉 NYSE:SEI Analysis 📉
#SEI swept initial sell-side liquidity and bounced 🔄
Next watch: Tuesday’s low — want to see it taken and tapped into the 4H +OB for a long setup 🎯
If that +OB doesn’t hold, expect another liquidity sweep before the real bounce 🧹
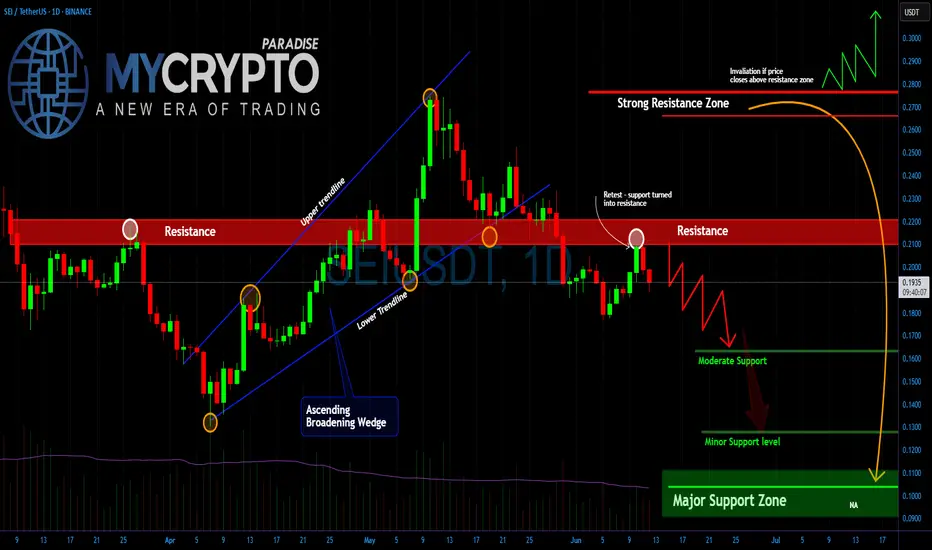
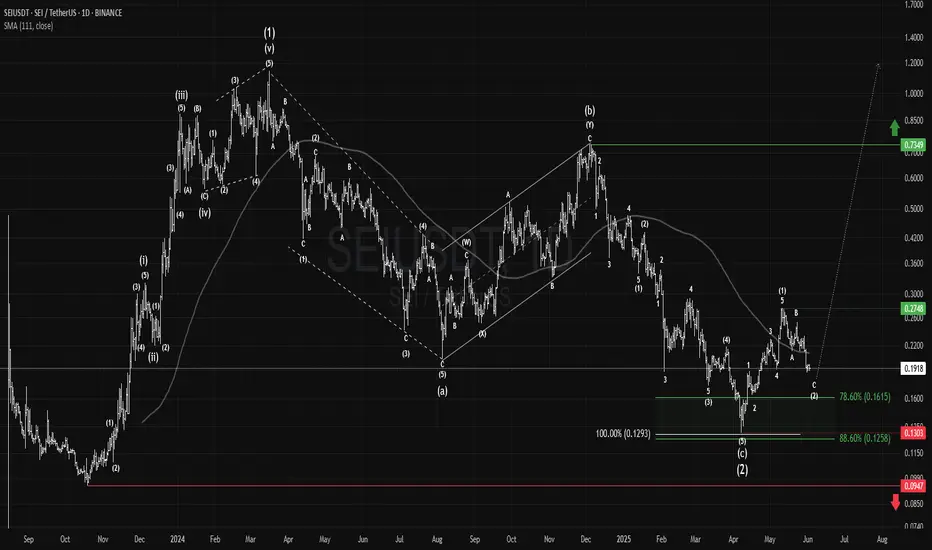
SEI: Fully Locked#SEI showed a clean motive wave after its April low, followed by a corrective wave, forming a classic setup for a powerful third wave.
Holding above $0.130 keeps the idea valid, with $0.095 as final invalidation. Passing $0.275 confirms the pattern; $0.735 targets the ATH.
#SEI/USDT#SEI
The price is moving within a descending channel on the 1-hour frame, adhering well to it, and is heading for a strong breakout and retest.
We are experiencing a rebound from the lower boundary of the descending channel, which is support at 0.1840.
We are experiencing a downtrend on the RSI in

See all ideas
Summarizing what the indicators are suggesting.
Oscillators
Neutral
SellBuy
Strong sellStrong buy
Strong sellSellNeutralBuyStrong buy
Oscillators
Neutral
SellBuy
Strong sellStrong buy
Strong sellSellNeutralBuyStrong buy
Summary
Neutral
SellBuy
Strong sellStrong buy
Strong sellSellNeutralBuyStrong buy
Summary
Neutral
SellBuy
Strong sellStrong buy
Strong sellSellNeutralBuyStrong buy
Summary
Neutral
SellBuy
Strong sellStrong buy
Strong sellSellNeutralBuyStrong buy
Moving Averages
Neutral
SellBuy
Strong sellStrong buy
Strong sellSellNeutralBuyStrong buy
Moving Averages
Neutral
SellBuy
Strong sellStrong buy
Strong sellSellNeutralBuyStrong buy
Displays a symbol's price movements over previous years to identify recurring trends.