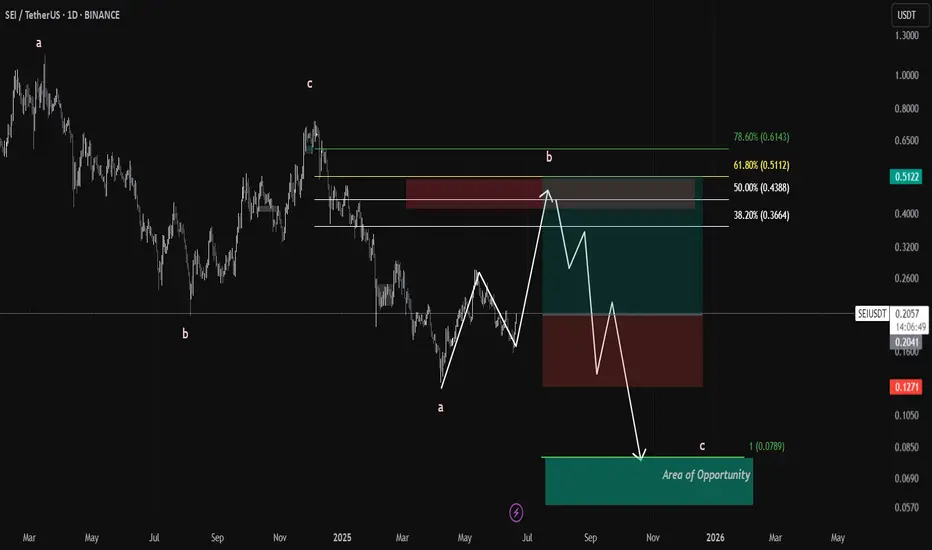
Sei trade plan SEI/USDT – Bearish Zigzag Correction In Play | Waiting for the Final Leg C
📉 Current Structure:
The chart displays a developing A-B-C zigzag correction.
Wave a is complete, and price is currently unfolding wave b, pushing into a key supply zone between 0.4388 – 0.5112 USDT.
This zone also align
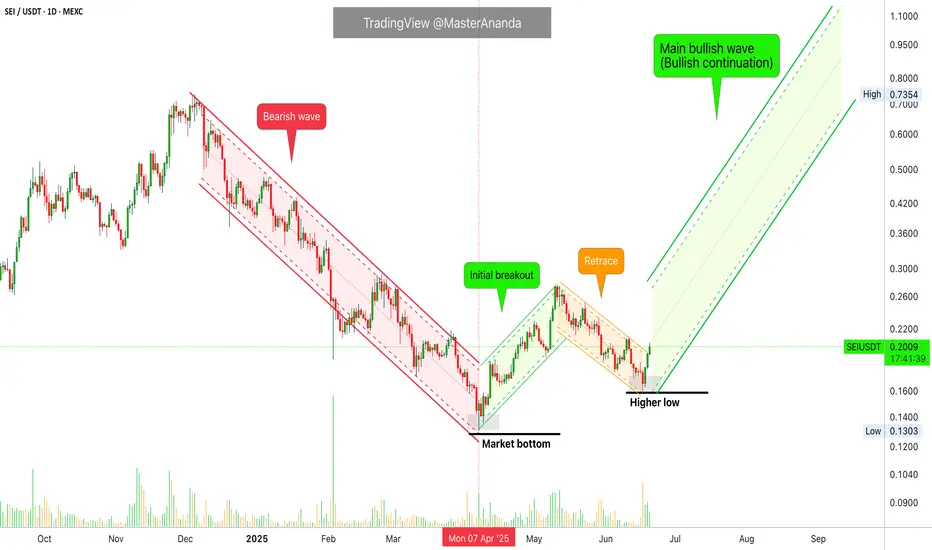
Sei Goes Bullish, Same Pattern & SequenceIt is the same price pattern and sequence. A bullish wave ends December 2024 and leads to a correction. The correction ends with a bottom 7-April. This bottom marks the start of a new phase, the bullish cycle. Recently, SEIUSDT produced a higher low and this higher low marks the start of the next ad
SEIUSDT UPDATEPattern : Falling Wedge Breakout
Current Price: $0.1839
Target Price: $0.3590
Target % Gain: 95.76%
Technical Analysis: SEI has broken out of a falling wedge pattern on the 1D chart, indicating potential reversal. The breakout is supported by increasing bullish momentum. A sustained close above

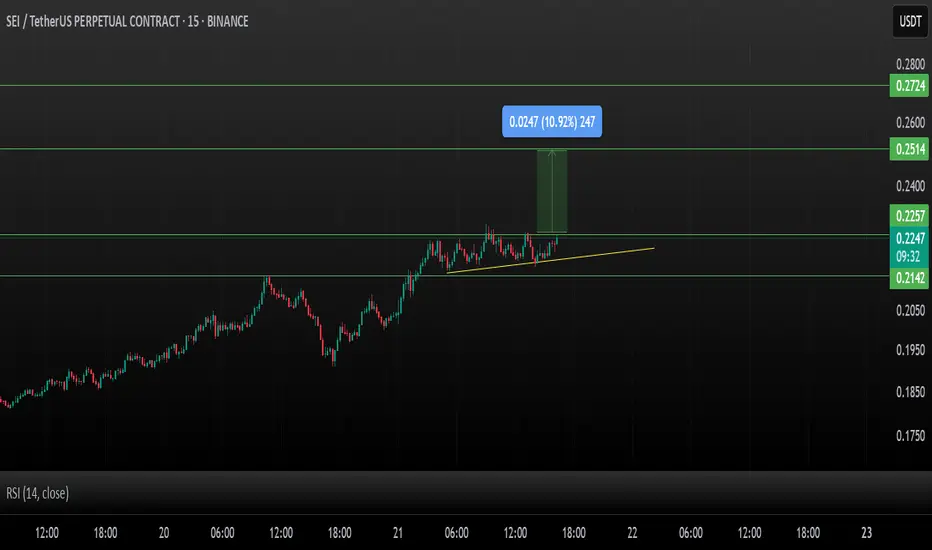
SEI/USDT – Bullish Breakout Setup!SEI consolidates in a classic ascending triangle, showing a strong structure with higher lows and flat resistance.
A breakout above ~$0.225 could trigger a move toward higher targets.
Key Levels:
Support: $0.2142 (triangle base)
Resistance: $0.2257 (breakout level)
Stoploss: Below $0.214 (invalida
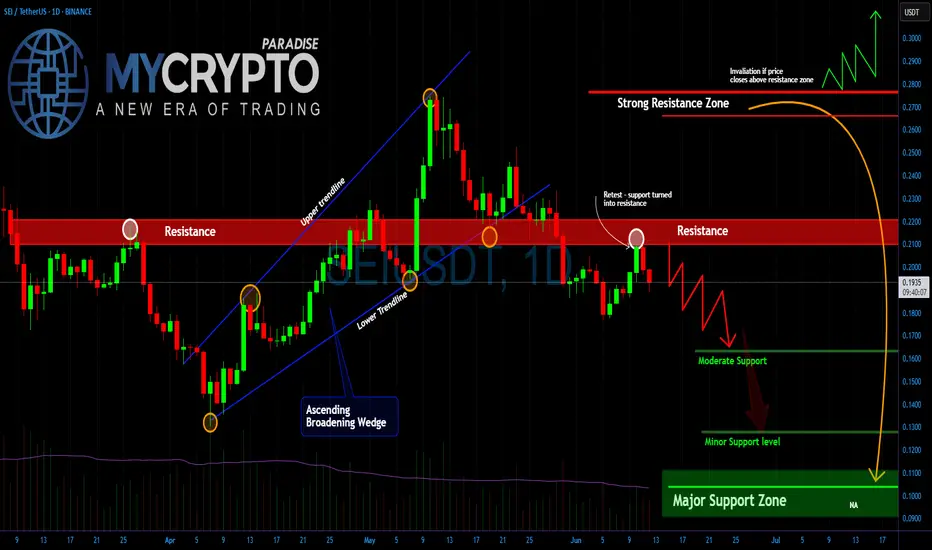
SEI Rebound or Final Trap?Yello Paradisers, have you considered that this little bounce might be the last trap before a brutal selloff? SEIUSDT is giving us strong signals that most retail traders are missing and if you’re not reading the structure clearly, you’re walking straight into a setup designed to clean you out.
💎Th
SEI SELL SETUP ,Sold From $0.2210SEI SELL SETUP
Currently $0.2210
Sold From $0.2210
(Trading plan If SEI go up to $0.23
will add more shorts)
Expecting target $0.2124 OR DOWN
In the event of an early exit,
this analysis will be updated.
Its not a Financial advice

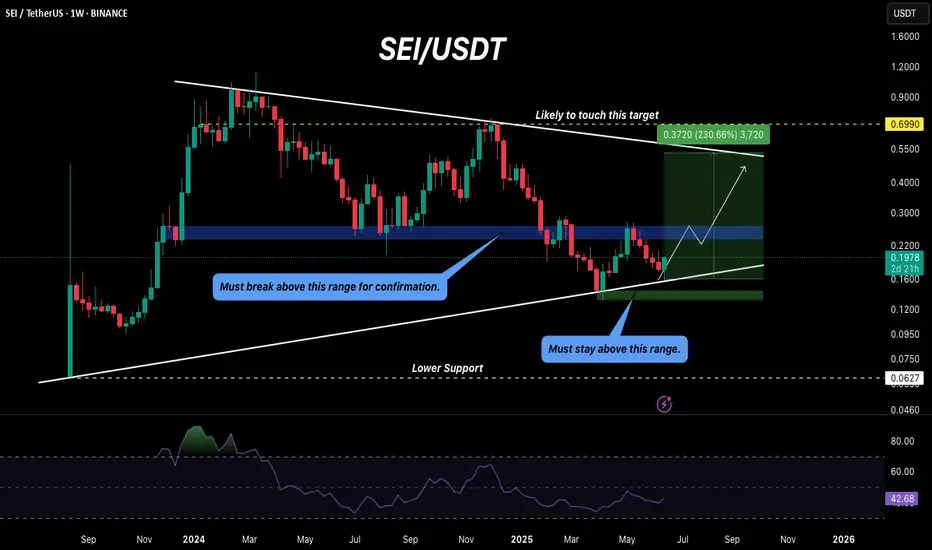
SEI holds potential for a 300% gain!Hello Traders,
Today, we’ll analyze SEI on the weekly timeframe.
SEI is currently rebounding from its support trendline, and we may see a bullish rally of up to 300% if it breaks above the blue box, which ranges between $0.23 and $0.26. The price has dropped significantly from $1 to around $0.40,
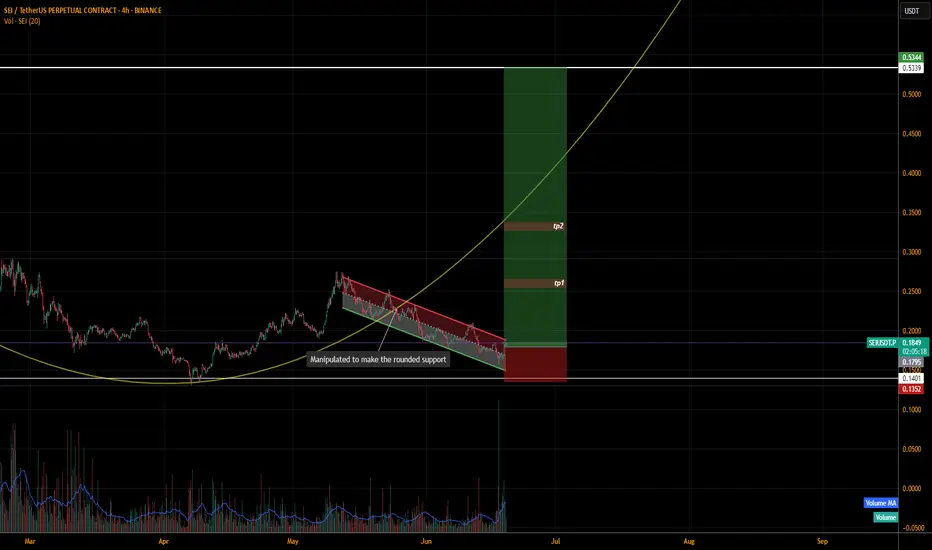
SEIUSDT.P LONGI think we got manipulated to make the rounding support.
The price is recovering nicely to enter in the rounded support.
We can long it now.
The market is very volatile due to geopolitical issues.
Only risk 1 or 2% of the capital.
The setups with the tps are mentioned
DYOR
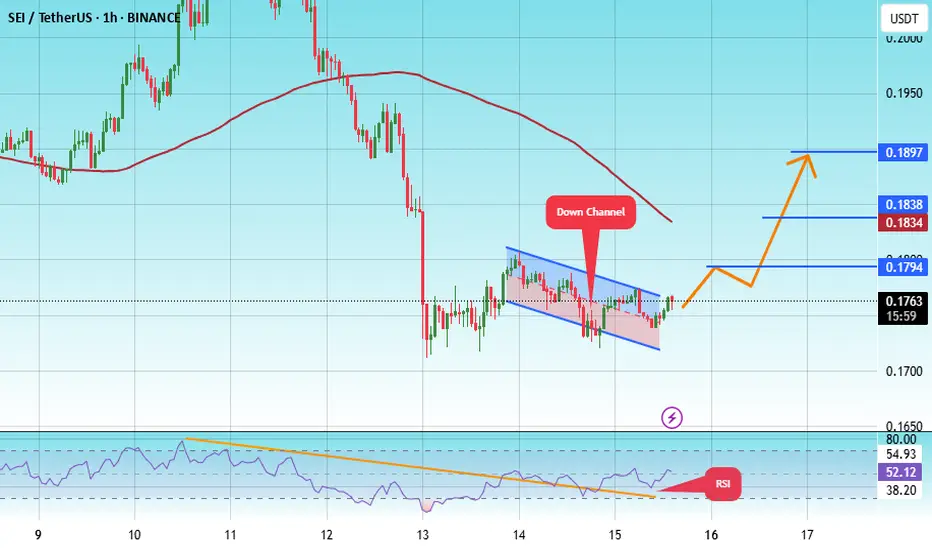
#SEI/USDT#SEI
The price is moving within a descending channel on the 1-hour frame, adhering well to it, and is heading for a strong breakout and retest.
We are experiencing a rebound from the lower boundary of the descending channel. This support is at 0.1725.
We are experiencing a downtrend on the RSI ind
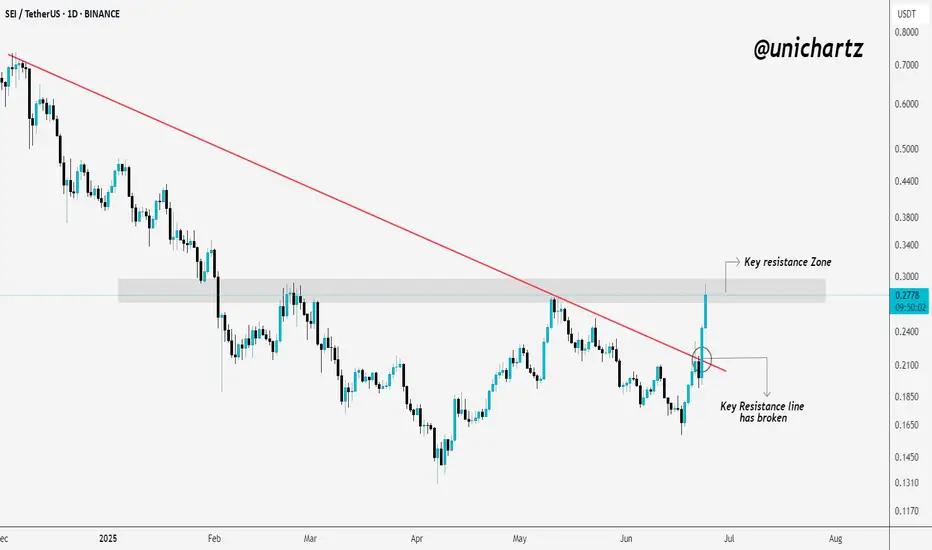
$SEI Testing Critical Resistance After BreakoutNYSE:SEI has finally broken above the long-standing resistance trendline, a strong sign of bullish momentum building up.
Right now, it’s facing some pressure at the marked resistance zone. If bulls manage to flip this area into support, we could see the next leg up. But if it gets rejected here, a
See all ideas
Summarizing what the indicators are suggesting.
Oscillators
Neutral
SellBuy
Strong sellStrong buy
Strong sellSellNeutralBuyStrong buy
Oscillators
Neutral
SellBuy
Strong sellStrong buy
Strong sellSellNeutralBuyStrong buy
Summary
Neutral
SellBuy
Strong sellStrong buy
Strong sellSellNeutralBuyStrong buy
Summary
Neutral
SellBuy
Strong sellStrong buy
Strong sellSellNeutralBuyStrong buy
Summary
Neutral
SellBuy
Strong sellStrong buy
Strong sellSellNeutralBuyStrong buy
Moving Averages
Neutral
SellBuy
Strong sellStrong buy
Strong sellSellNeutralBuyStrong buy
Moving Averages
Neutral
SellBuy
Strong sellStrong buy
Strong sellSellNeutralBuyStrong buy
Displays a symbol's price movements over previous years to identify recurring trends.