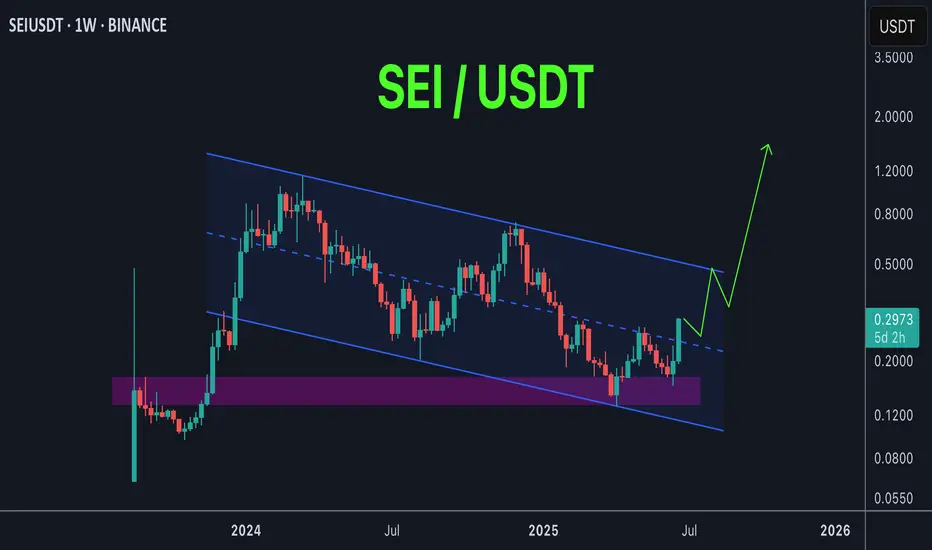
SEI possible playout SEI / USDT
Price is trading inside big descending channel
Next stop : price will hit the upper trendline of the channel and if managed to breakout this resistance it will skyrocket maybe to new ATH
Keep an eye on it …
SEIUSDT.P trade ideas
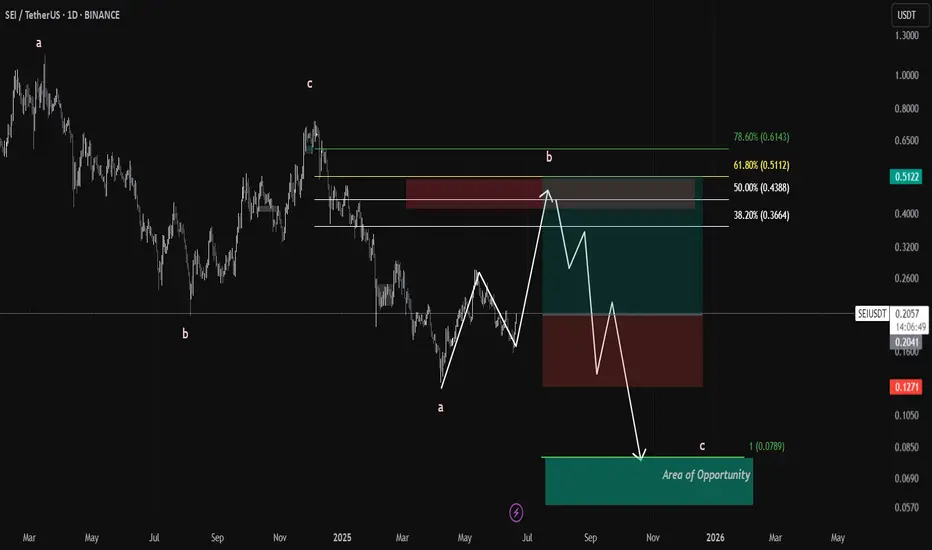
Sei trade plan SEI/USDT – Bearish Zigzag Correction In Play | Waiting for the Final Leg C
📉 Current Structure:
The chart displays a developing A-B-C zigzag correction.
Wave a is complete, and price is currently unfolding wave b, pushing into a key supply zone between 0.4388 – 0.5112 USDT.
This zone also aligns with major Fibonacci retracements:
🟡 50% at 0.4388 TP1
🟢 61.8% at 0.5112 TP 2
🔵 78.6% at 0.6143 (max deviation before invalidation) TP3 if given
traders can trade the wave b I have marked the entry and Sl it's a 4RR high probability setup
Targets for Wave C:
🎯 Primary Target (1.0 extension): 0.0789 USDT
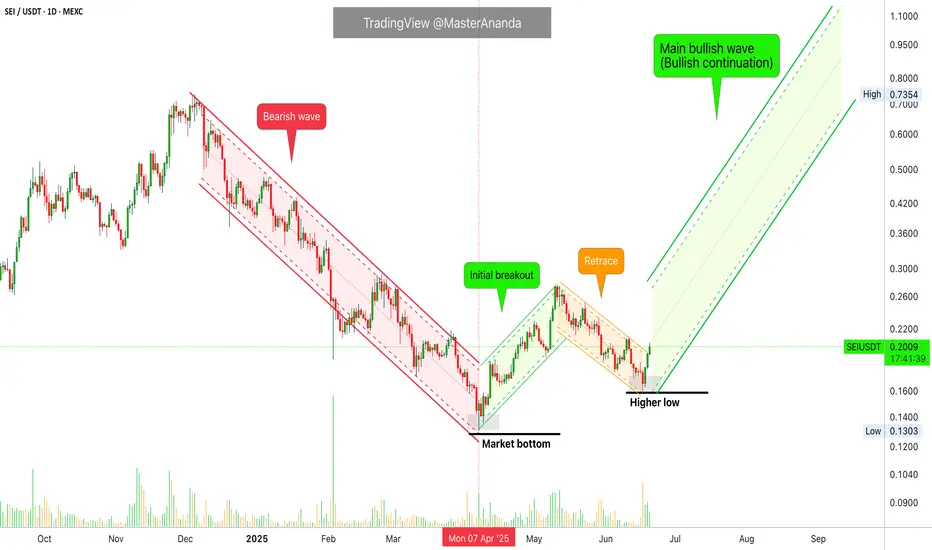
Sei Goes Bullish, Same Pattern & SequenceIt is the same price pattern and sequence. A bullish wave ends December 2024 and leads to a correction. The correction ends with a bottom 7-April. This bottom marks the start of a new phase, the bullish cycle. Recently, SEIUSDT produced a higher low and this higher low marks the start of the next advance, a bullish continuation.
Makes sense?
Bullish action already confirmed —The bigger picture
Today we have three green candles and the most bullish since the end of the initial bullish breakout. If you take this chart together with my other recent publications: COIN, ETH, DOGS, NOT and BCH, you can start to decipher the bigger picture. It is already confirmed.
A great opportunity
I am here to alert you of the event before it happens. Taking action now can be life changing or simply put, taking action now can translate into huge profits; the best possible entry after the 7-April low.
Don't worry, even if this opportunity gets away from you, the market will continue to produce countless more; endless opportunities the Cryptocurrency market has to offer for sure.
Thanks a lot for your continued support.
Namaste.
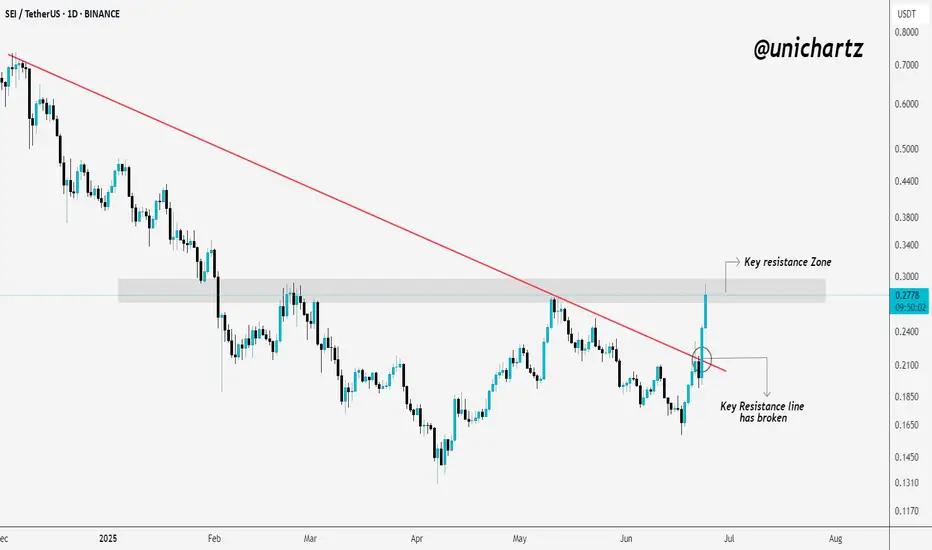
SEIUSDT UPDATEPattern : Falling Wedge Breakout
Current Price: $0.1839
Target Price: $0.3590
Target % Gain: 95.76%
Technical Analysis: SEI has broken out of a falling wedge pattern on the 1D chart, indicating potential reversal. The breakout is supported by increasing bullish momentum. A sustained close above resistance confirms the move.
Time Frame: 1D

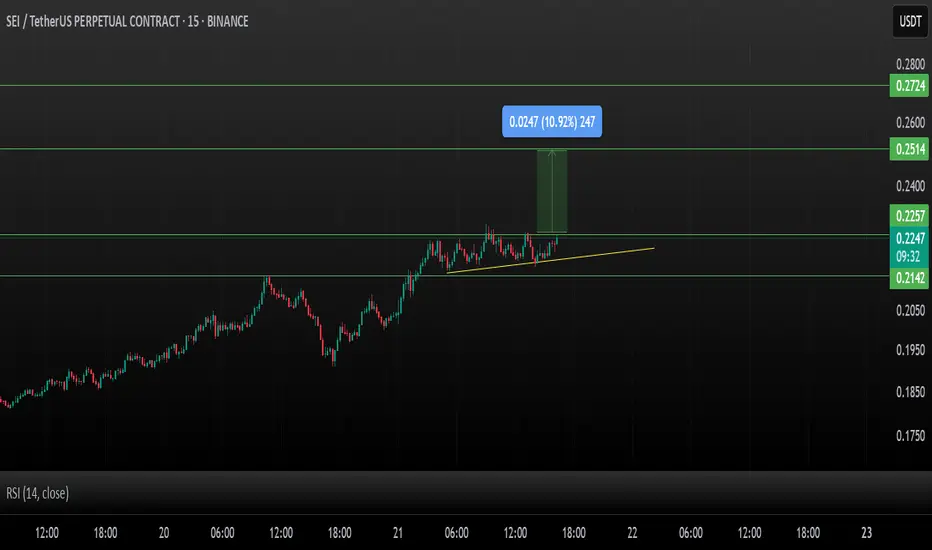
SEI/USDT – Bullish Breakout Setup!SEI consolidates in a classic ascending triangle, showing a strong structure with higher lows and flat resistance.
A breakout above ~$0.225 could trigger a move toward higher targets.
Key Levels:
Support: $0.2142 (triangle base)
Resistance: $0.2257 (breakout level)
Stoploss: Below $0.214 (invalidation of structure)
Targets on Breakout:
TP1: $0.2514
TP2: $0.2724
RSI is climbing from mid-range with a bullish crossover, indicating strengthening momentum.
Structure looks favorable as long as support holds. Wait for volume confirmation on breakout for higher probability.
Not financial advice. Do your own research before investing (DYOR).
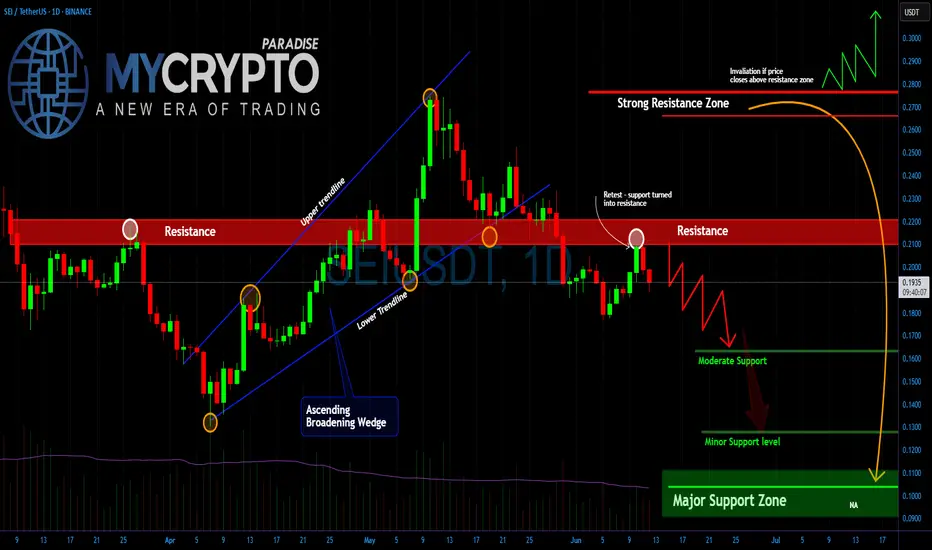
SEI Rebound or Final Trap?Yello Paradisers, have you considered that this little bounce might be the last trap before a brutal selloff? SEIUSDT is giving us strong signals that most retail traders are missing and if you’re not reading the structure clearly, you’re walking straight into a setup designed to clean you out.
💎The recent price action shows a clear rejection from the $0.22 level, which has now confirmed itself as a strong resistance zone. What’s more concerning is that this resistance rejection comes right after the price broke down from an Ascending Broadening Wedge. This is not a random pattern it’s a classic formation that tends to attract breakout buyers and then punishes them with aggressive downside moves once the structure fails.
💎Currently, the market is drifting just below that resistance, attempting weak bounces. However, there is a clear lack of bullish momentum. If this weakness persists, the next stop is around the $0.16 region, where moderate support is likely to be tested.
💎If sellers get aggressive, that level might not hold, and we could head lower into the $0.13 area still not where true value lies. The major support zone sits far below, around the psychological $0.10 level, and that’s where the real high-probability bounce setup is likely to occur.
MyCryptoParadise
iFeel the success🌴
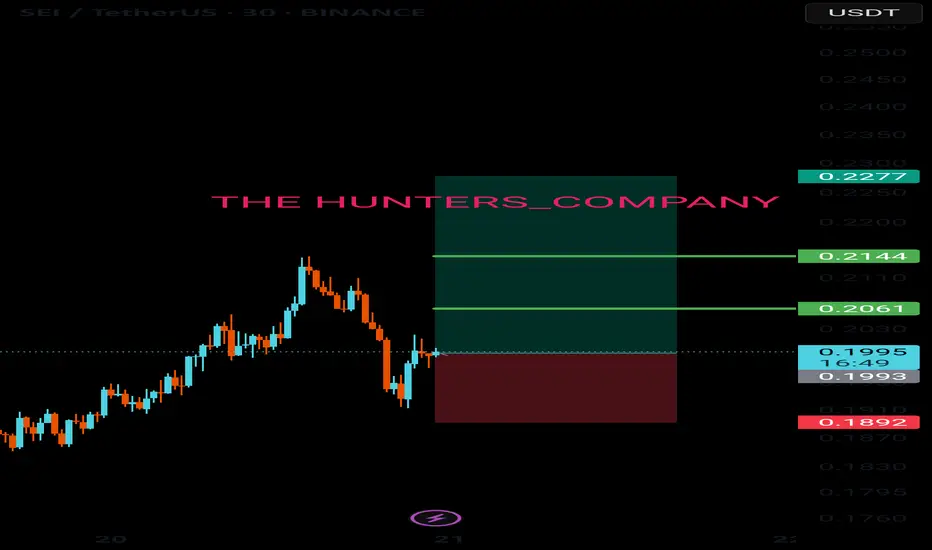
SEI SELL SETUP ,Sold From $0.2210SEI SELL SETUP
Currently $0.2210
Sold From $0.2210
(Trading plan If SEI go up to $0.23
will add more shorts)
Expecting target $0.2124 OR DOWN
In the event of an early exit,
this analysis will be updated.
Its not a Financial advice

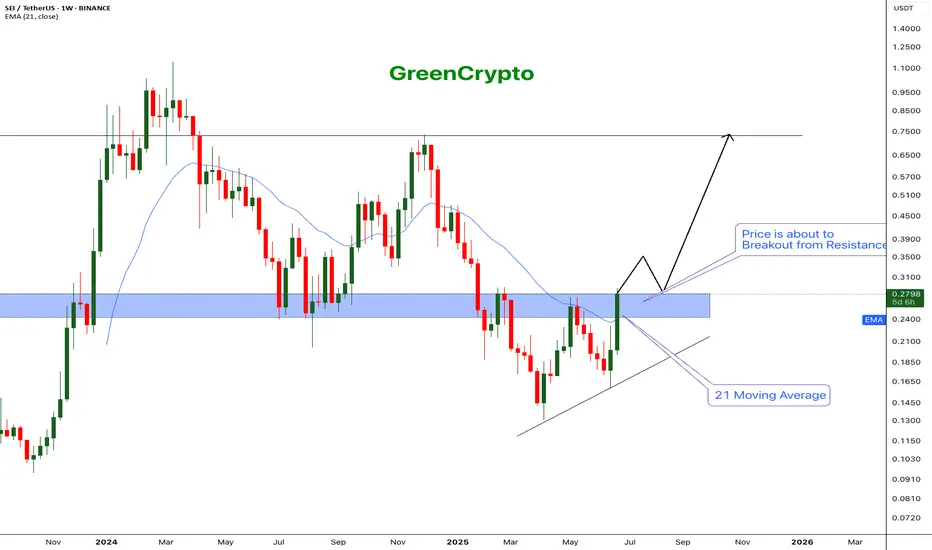
SEI - The next big runner$BINANCE:SEI/USDT (1W CHART) Technical Analysis Update
SEI is currently trading at $0.2785 and showing overall bullish sentiment
Price successfully breached the 21 EMA and now price is trading near one of the major resistance zone.
If the weekly candles closes above the resistance then we can expect further bullish momentum.
I'm expecting the price to easily break the resistance and hit the next major resistanc e around 0.75
Entry: After close above resistance (0.285)
StopLoss: 0.18
TakeProfit 1: 0.3506
TakeProfit 2: 0.4962
TakeProfit 3: 0.7367
Don't forget to keep stoploss!
Follow our TradingView account for more technical analysis updates. | Like, share, and comment your thoughts.
Cheers
GreenCrypto
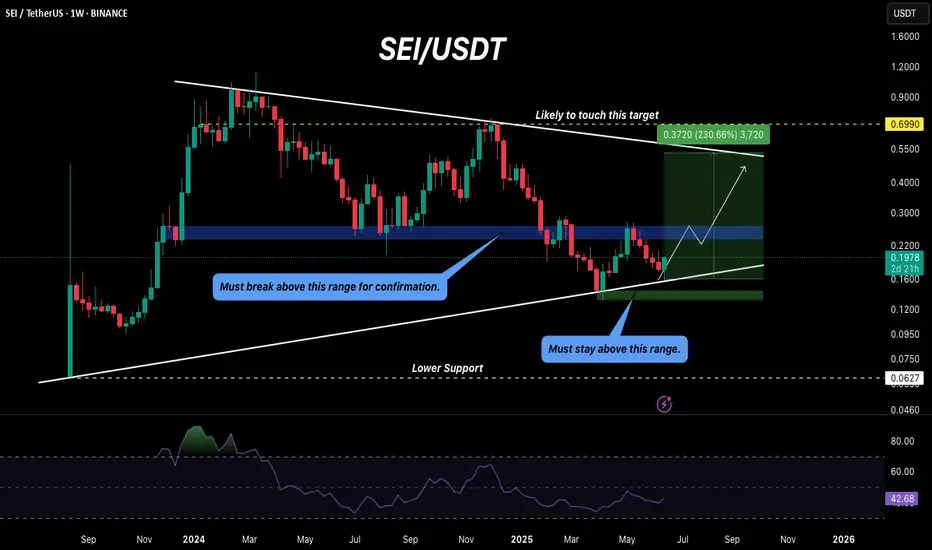
SEI holds potential for a 300% gain!Hello Traders,
Today, we’ll analyze SEI on the weekly timeframe.
SEI is currently rebounding from its support trendline, and we may see a bullish rally of up to 300% if it breaks above the blue box, which ranges between $0.23 and $0.26. The price has dropped significantly from $1 to around $0.40, which could present a good opportunity—if accumulated in time.
On the bearish side, SEI must not fall below the green box ($0.13–$0.14). If it does, the price could drop as low as $0.06.
Note: Always do your own research and analysis before investing.
Regards,
Dexter
Live trade hello friends✋️
Considering the price drop, you can now see that we are in important support and now we can take advantage of this situation and enter into a transaction with risk and capital management.
🔥Follow us for more signals🔥
*Trade safely with us*
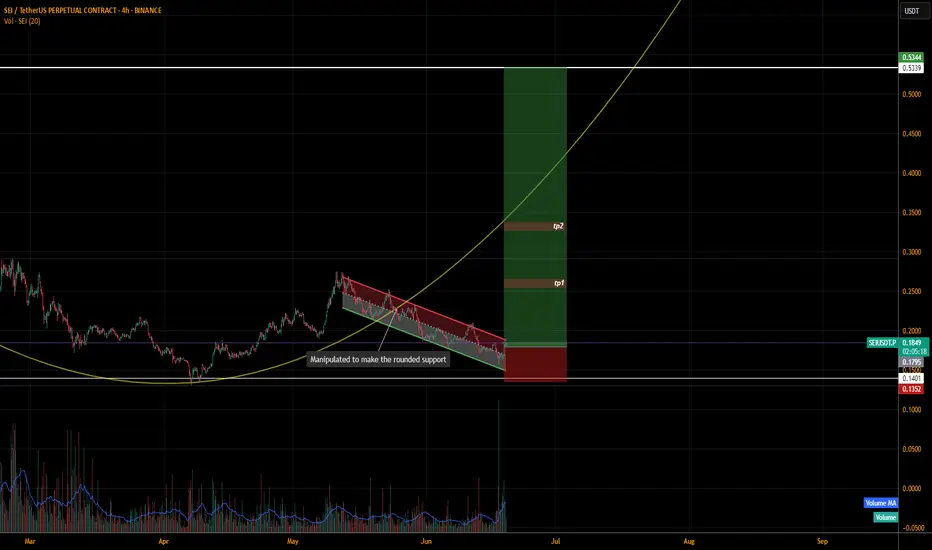
SEIUSDT.P LONGI think we got manipulated to make the rounding support.
The price is recovering nicely to enter in the rounded support.
We can long it now.
The market is very volatile due to geopolitical issues.
Only risk 1 or 2% of the capital.
The setups with the tps are mentioned
DYOR
$SEI Testing Critical Resistance After BreakoutNYSE:SEI has finally broken above the long-standing resistance trendline, a strong sign of bullish momentum building up.
Right now, it’s facing some pressure at the marked resistance zone. If bulls manage to flip this area into support, we could see the next leg up. But if it gets rejected here, a short pullback or retest isn’t off the table.
Let the level decide the next move — no need to chase.
DYOR, NFA
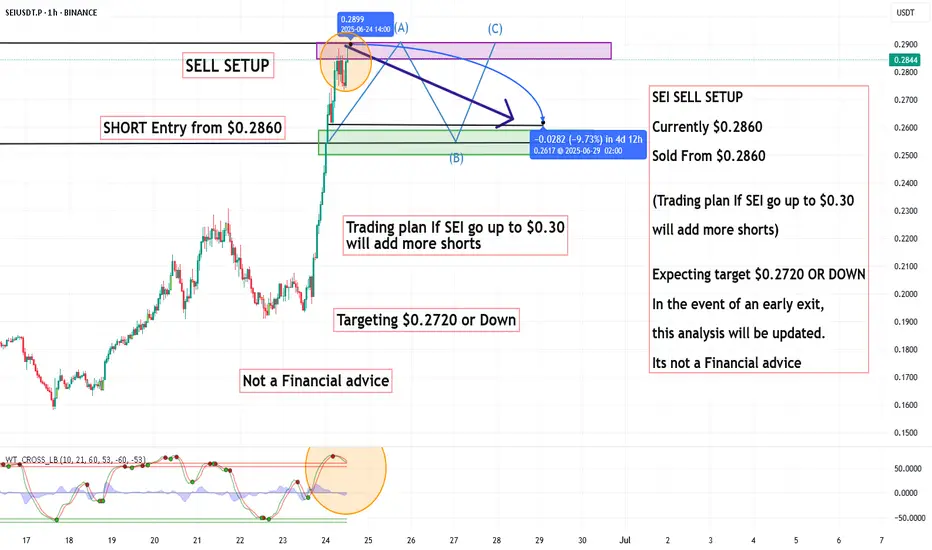
SEI SELL SETUP , Sold From $0.2860SEI SELL SETUP
Currently $0.2860
Sold From $0.2860
(Trading plan If SEI go up to $0.30
will add more shorts)
Expecting target $0.2720 OR DOWN
In the event of an early exit,
this analysis will be updated.
Its not a Financial advice
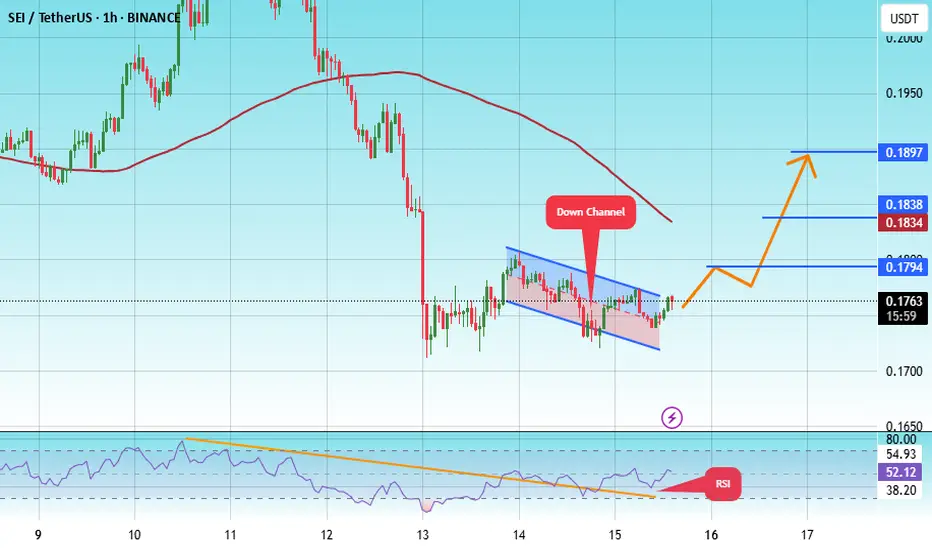
#SEI/USDT#SEI
The price is moving within a descending channel on the 1-hour frame, adhering well to it, and is heading for a strong breakout and retest.
We are experiencing a rebound from the lower boundary of the descending channel. This support is at 0.1725.
We are experiencing a downtrend on the RSI indicator, which is about to break and retest, supporting the upward trend.
We are heading for stability above the 100 Moving Average.
Entry price: 0.1766
First target: 0.1794
Second target: 0.1834
Third target: 0.1890
SEIUSDT Forming Falling WedgeSEIUSDT has recently confirmed a falling wedge breakout, a strong bullish reversal pattern that often marks the end of a downtrend and the start of an impulsive move upward. The breakout has occurred with solid momentum, and volume is supportive—indicating that buyers are stepping in with conviction. This technical formation suggests a potential price surge ranging between 60% to 70%, aligning with historical projections from similar wedge breakouts.
As shown in the daily chart, SEIUSDT has broken above the wedge resistance and followed up with strong bullish candles. This surge confirms growing demand and positive sentiment in the market. Notably, the immediate targets are marked at $0.34 and $0.37, with upside potential of over 83% from the breakout point, offering attractive risk-reward for traders and swing investors.
Fundamentally, SEI is gaining traction within the decentralized ecosystem. Its focus on high-performance blockchain scalability and its growing developer community is drawing significant attention. Social media chatter and on-chain data also reflect increasing accumulation from retail and mid-tier wallets. Such organic traction often translates into sustainable price movements, especially when paired with strong technical setups like this.
Overall, SEIUSDT is shaping up as a high-potential altcoin play. With technical confirmation, investor interest, and bullish sentiment across the board, this breakout could be just the beginning of a larger trend. Traders should keep an eye on pullbacks for potential entries and watch for continuation above local resistance levels.
✅ Show your support by hitting the like button and
✅ Leaving a comment below! (What is You opinion about this Coin)
Your feedback and engagement keep me inspired to share more insightful market analysis with you!
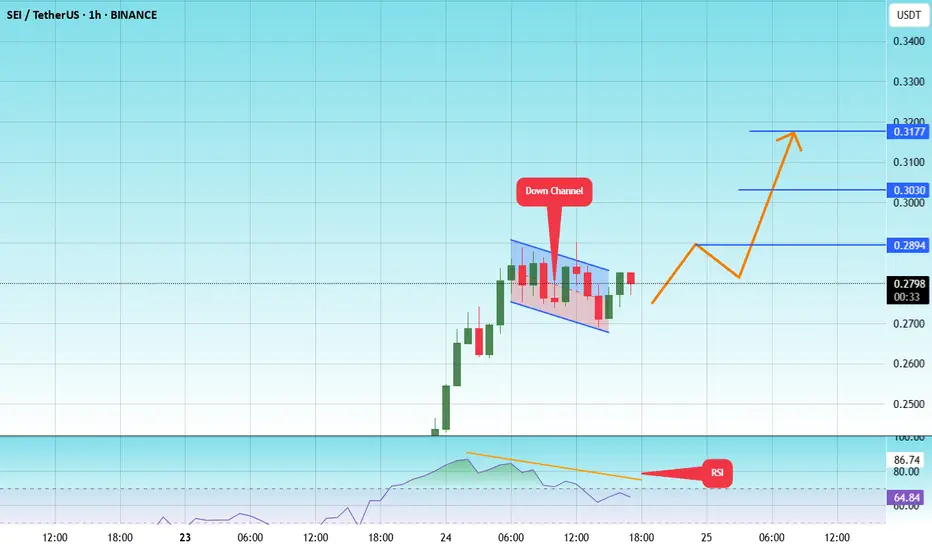
#SEI/USDT#SEI
The price is moving within a descending channel on the 1-hour frame and is expected to break and continue upward.
We have a trend to stabilize above the 100 moving average once again.
We have a downtrend on the RSI indicator, which supports the upward move by breaking it upward.
We have a support area at the lower limit of the channel at 0.2696, acting as strong support from which the price can rebound.
Entry price: 0.2790
First target: 0.2894
Second target: 0.3030
Third target: 0.3177
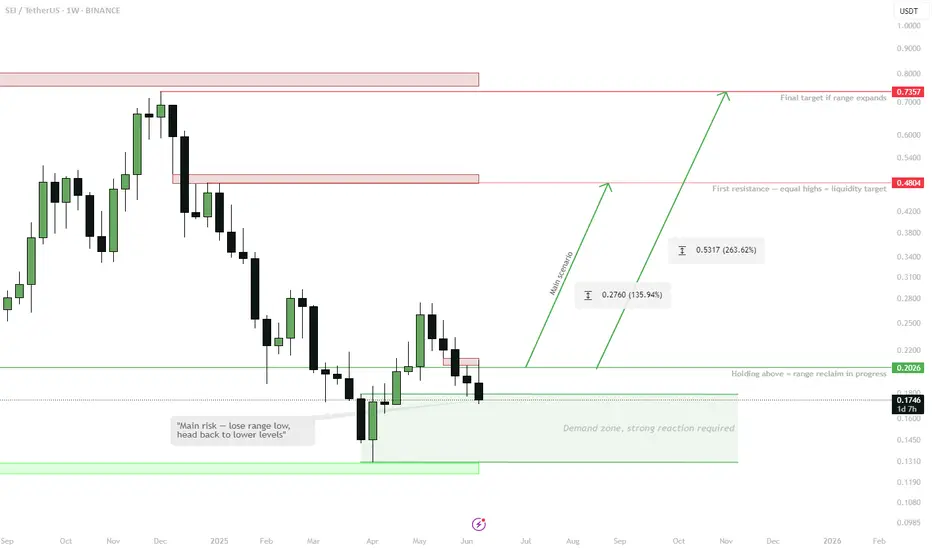
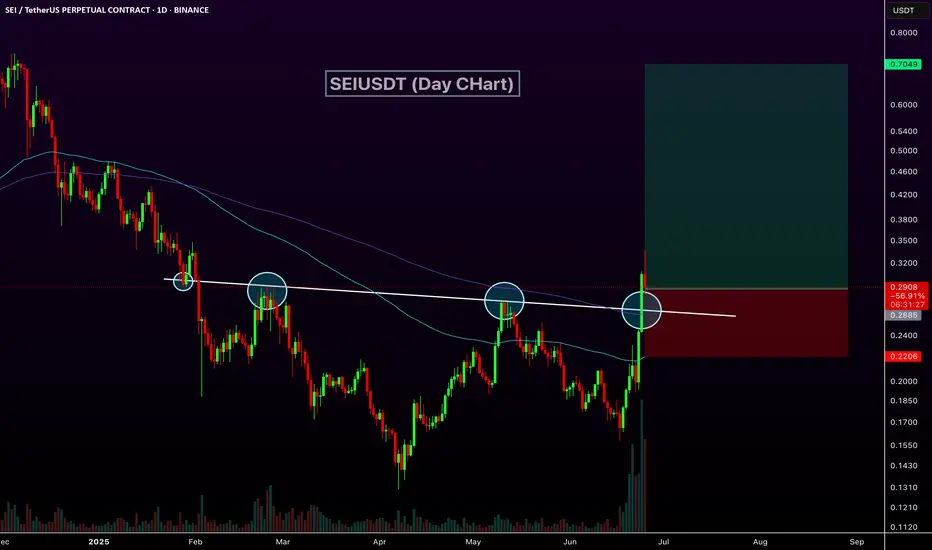
SEI | 1W range reclaim in progress.Holding above $0.20 (range low & demand zone) — expecting a move towards the mid-range ($0.48), where a stack of equal highs is waiting.
Lose $0.20 — invalidation, back to lower support.
Key idea: Range play, targeting liquidity at the mid-range. Macro resistance at $0.75 if breakout extends.
Accumulation still visible, bullish bias above range low.
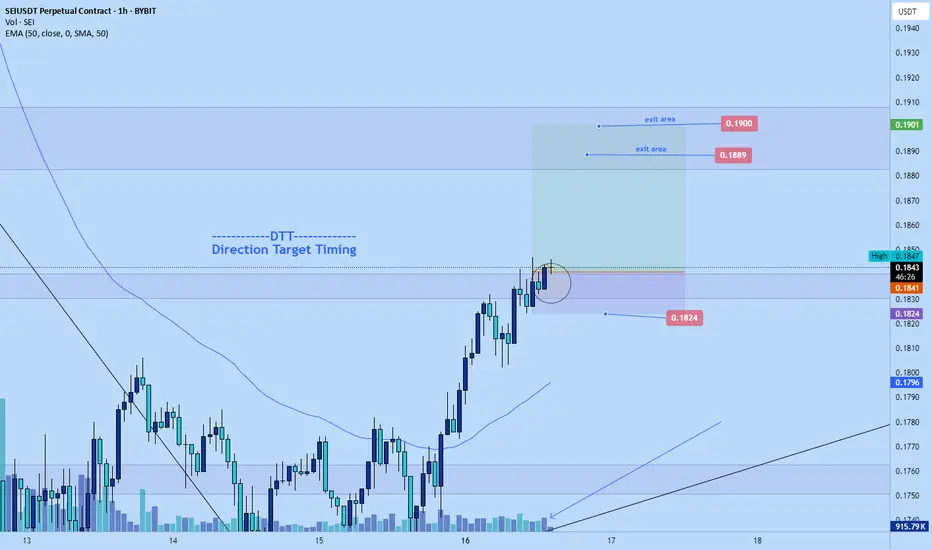
Sei long to $0.19 areaJust hopped into a long position on Sei. Am targeting $0.19 area to get roughly 3RR from the move given plays out.
Stop: $0.1824
Time sensitive.
Its relatively high but if btc continues to pump theres a good chance it will hit tp.
SEI Just Broke Out - Massive Rally Incoming?SEIUSDT Technical analysis update
SEIUSDT is testing a long-term descending trendline, which has acted as strong resistance on multiple occasions. Price has now broken above this level with strong volume, signaling a potential trend reversal. And price trading above 100 and 200 EMA, in the coming trading days, we can see a strong bullish move in SEI
NYSE:SEI
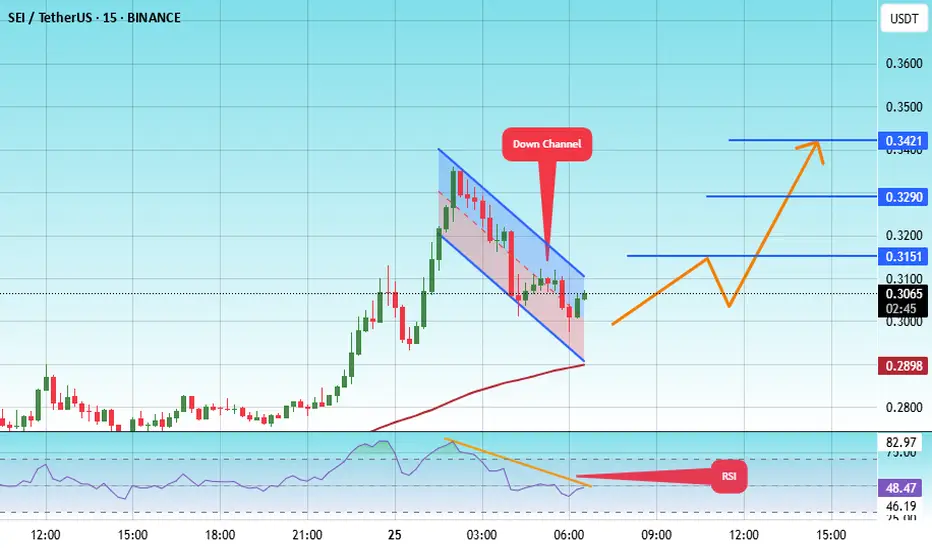
#SEI/USDT#SEI
The price is moving within a descending channel on the 1-hour frame, adhering well to it, and is on its way to breaking it strongly upwards and retesting it.
We are seeing a rebound from the lower boundary of the descending channel, which is support at 0.2942.
We have a downtrend on the RSI indicator that is about to break and retest, which supports the upward trend.
We are looking for stability above the 100 moving average.
Entry price: 0.3062
First target: 0.3151
Second target: 0.3290
Third target: 0.3421
Phemex Analysis #92: Pro Tips for Trading Sei (SEI) Sei ( PHEMEX:SEIUSDT.P ) Network’s recent advancements underscore its commitment to extreme scalability, Ethereum Virtual Machine (EVM) compatibility, and streamlined user experience, all backed by strong institutional support and rapid adoption.
The recent launch of Sei V2 marks a major milestone, enhancing Sei’s performance dramatically. With this upgrade, the network now processes an impressive 5 gigagas per second, equating to approximately 200,000 transactions per second (TPS) with sub-400 millisecond finality. Such metrics position Sei among the fastest EVM-compatible blockchains globally, facilitating groundbreaking real-time applications in DeFi, AI, and trading. Improvements like the SeiDB storage layer further boost efficiency by accelerating node syncing and reducing state bloat.
Institutionally, Sei is experiencing remarkable momentum. Recently, Canary Capital filed with the US SEC for the first-ever SEI-based Exchange Traded Fund (ETF), offering regulated access to staked SEI and on-chain yields. Additionally, prominent investors like Circle Ventures, Multicoin Capital, and Delphi Digital strongly validate Sei’s potential as a high-performance Layer-1 blockchain.
These significant developments—technical excellence, streamlined ecosystem, and strong institutional backing—position Sei Network as a top-tier contender in the blockchain industry.
Possible Scenarios
1. Bullish Continuation (Further Uptrend)
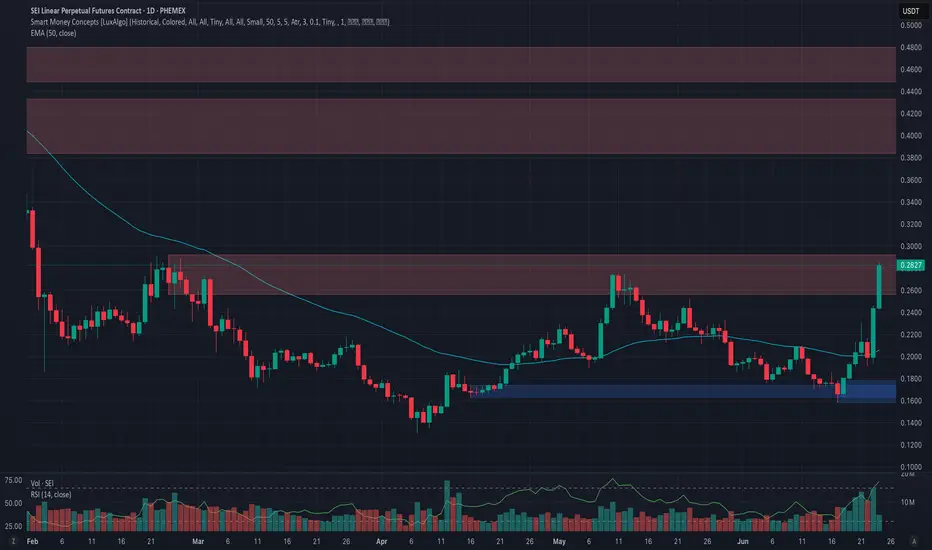
Over the past two days, SEI’s price surged by more than 45%, indicating robust bullish momentum. The immediate resistance at $0.292 appears attainable if bullish strength persists.
However, traders should anticipate significant resistance at higher levels, notably at $0.43 and $0.50. Approaching these key levels, market volatility could increase substantially.
Pro Tips:
Profit-Taking: Strategically take partial profits as SEI approaches the critical resistance zones near $0.43 and subsequently $0.50.
Risk Management: Implement protective stop-loss orders just below recent support zones, such as $0.255, to manage unexpected reversals.
2. Rejection at $0.292 (Potential Retracement)
Considering the sharp recent gains in a relatively uncertain market environment, a rejection at the $0.292 resistance is plausible. Should this occur, SEI might seek support at lower levels, primarily around $0.19 and $0.158, before stabilizing.
Pro Tips:
Buy-the-Dip Strategy: Monitor the lower support levels ($0.19 and $0.158) closely. These areas might offer favorable opportunities for accumulating SEI at discounted valuations.
Volume Confirmation: Keep an eye on trading volume during pullbacks; lower volume would indicate a potentially healthy correction rather than a sustained bearish move.
3. Breakthrough $0.292 but Retrace to Accumulate Momentum (Consolidation Scenario)
Another scenario involves SEI initially breaking above $0.292, then experiencing mild pullbacks toward approximately $0.255 to consolidate momentum. In this pattern, price may gradually climb higher, with smaller upward moves interspersed by brief retracements.
Pro Tips:
Long Grid Bots: Leverage grid trading bots effectively to capture profits from the smaller price fluctuations typical in this scenario. Start long-grid bots around the support level at $0.255 and target modest incremental gains.
Patience and Adaptability: Maintain discipline, patiently letting positions unfold while continuously managing your exposure through proper stop-loss placements and profit-taking strategies.
Conclusion
Sei Network’s robust technical performance, institutional backing, and recent bullish price action provide traders with several actionable scenarios. By carefully observing the outlined resistance and support levels and employing disciplined trading strategies—including timely profit-taking, grid bot deployment, and vigilant risk management—traders can confidently navigate SEI’s volatility to optimize returns effectively.
🔥 Tips:
Armed Your Trading Arsenal with advanced tools like multiple watchlists, basket orders, and real-time strategy adjustments at Phemex. Our USDT-based scaled orders give you precise control over your risk, while iceberg orders provide stealthy execution.
Disclaimer: This is NOT financial or investment advice. Please conduct your own research (DYOR). Phemex is not responsible, directly or indirectly, for any damage or loss incurred or claimed to be caused by or in association with the use of or reliance on any content, goods, or services mentioned in this article.
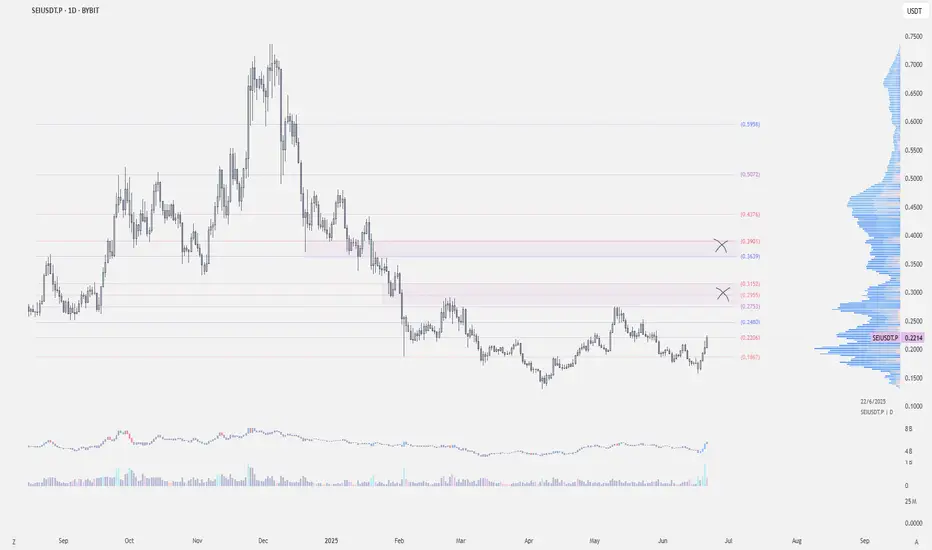
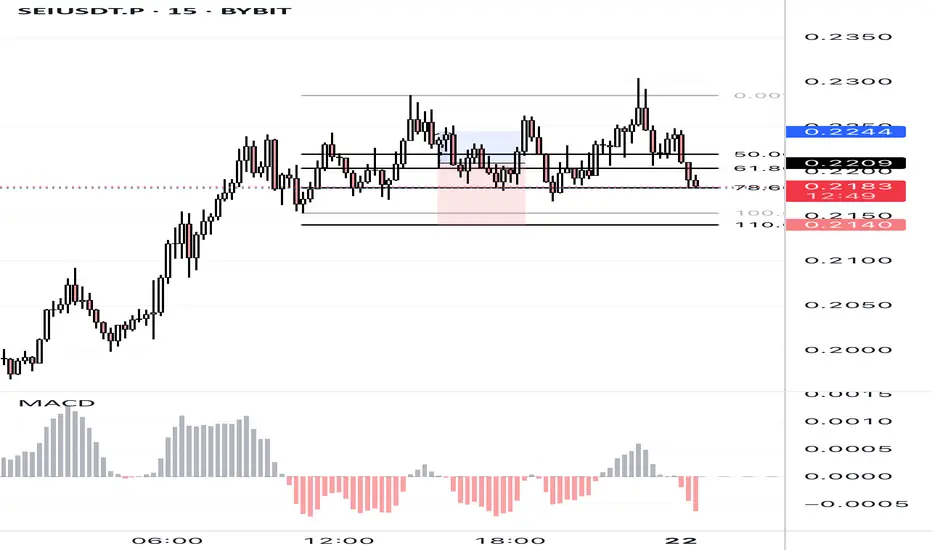
SEIUSDT.P – Long Setup in Fib Golden Zone with Volatility CompreSEIUSDT.P is consolidating after a strong bullish move. Price is now retracing into the 61.8–78.6% Fibonacci zone, which historically acts as a key reversal area. Multiple rejections and compression in this range suggest a potential bounce.
MACD shows signs of bearish momentum fading. If confirmed, this could be a solid risk-managed long with upside toward previous highs.
$SEI - Long Trade IdeaBINANCE:SEIUSDT is showing relative strength despite the dump
If CRYPTOCAP:BTC holds above 103k–102.7k, I’m looking for a move toward 0.27–0.32 (initial target)
Entry: .22-.20
Stoploss: Below .175
Targets:
.27 - .32
.36 - .38
.42 - .44