Live trade hello friends✋️
Considering the price drop, you can now see that we are in important support and now we can take advantage of this situation and enter into a transaction with risk and capital management.
🔥Follow us for more signals🔥
*Trade safely with us*
SEIUSDT.P trade ideas
#SEI/USDT#SEI
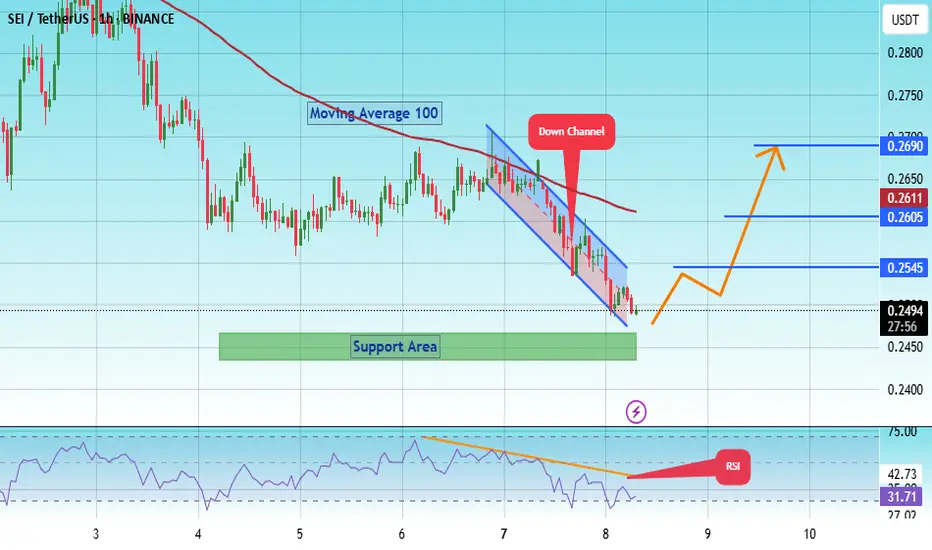
The price is moving within a descending channel on the 1-hour frame, adhering well to it, and is on its way to breaking it strongly upwards and retesting it.
We have a bounce from the lower boundary of the descending channel. This support is at 0.2470.
We have a downtrend on the RSI indicator that is about to be broken and retested, supporting the upside.
There is a major support area in green at 0.2440, which represents a strong basis for the upside.
Don't forget a simple thing: ease and capital.
When you reach the first target, save some money and then change your stop-loss order to an entry order.
For inquiries, please leave a comment.
We have a trend to hold above the 100 Moving Average.
Entry price: 0.2494
First target: 0.2545
Second target: 0.2600
Third target: 0.2690
Don't forget a simple thing: ease and capital.
When you reach the first target, save some money and then change your stop-loss order to an entry order.
For inquiries, please leave a comment.
Thank you.
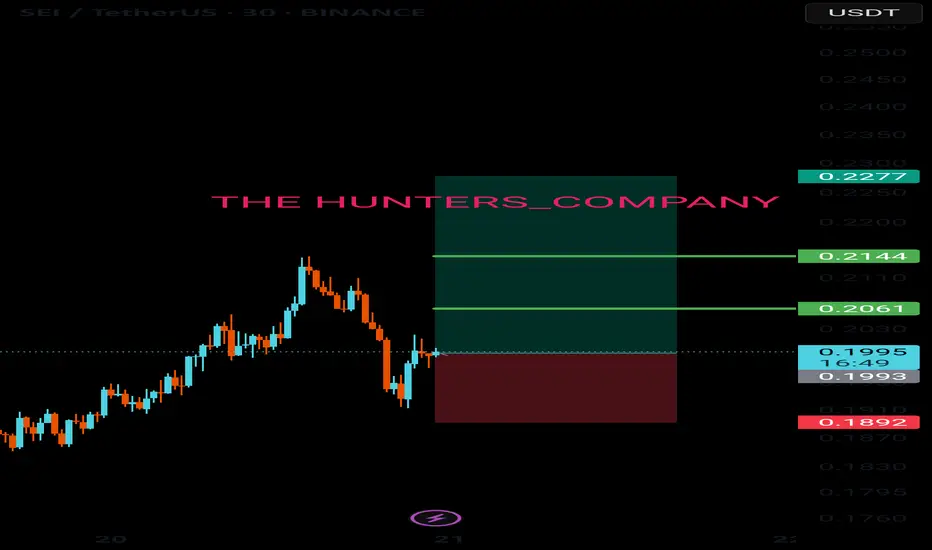
Sei long before further dump Based on my analysis am anticipating a correction up tonight before continuation dump.
Stop: $0.2501
Tp: $0.2627 area
Roughly 2RR
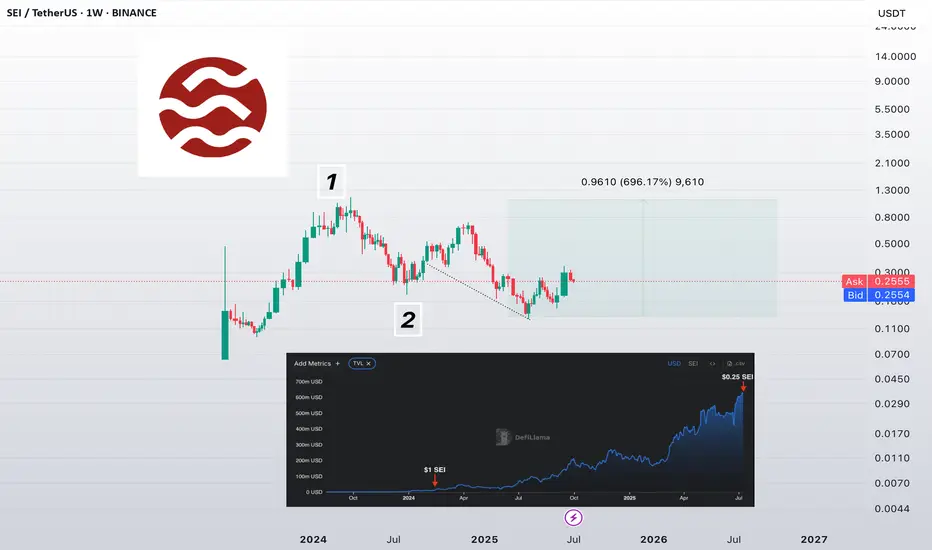
$SEI — the most underrated monster right now?
➡️ February 2024:
TVL = $13M
Price = $1
Market Cap ≈ $2.4B
➡️ Now:
TVL = $624M ❗️
Price = $0.25
Market Cap ≈ $1.4B
❓ How can you ignore these numbers? The project grew 48x in TVL, but the market cap dropped nearly 2x. Where's the logic?
If you're whining about the $0.25 price —
🔴 you're only looking at the chart, but missing what’s happening under the hood.
👉 My view: the second half of 2025 will be epic for the SEI ecosystem.
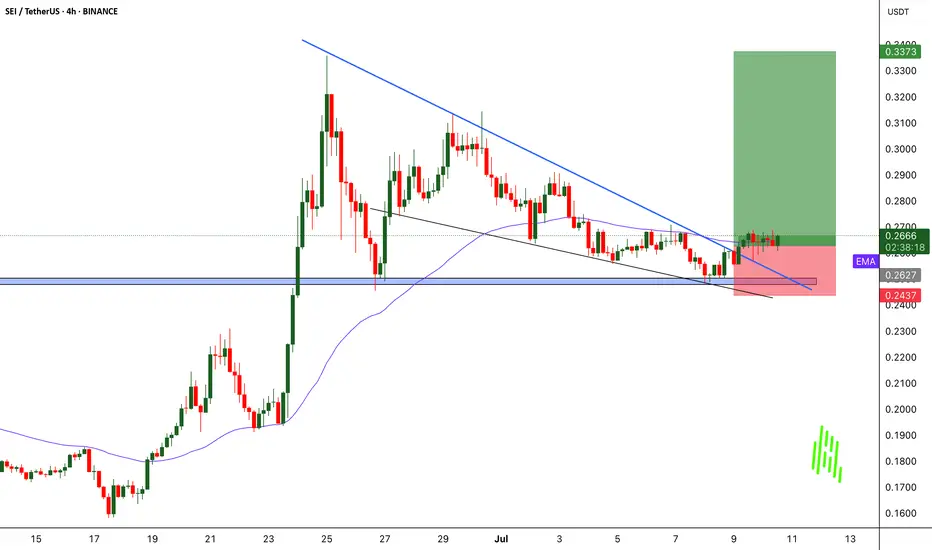
SEIUSDT Rebounds from Key Support - Pump Loading?BINANCE:SEIUSDT Rebounds from Key Support - Pump Loading?
BINANCE:SEIUSDT just touched a major support level on the 4H chart and is now showing signs of a bullish reversal after breaking above the descending trendline. This setup looks similar to previous price actions where NYSE:SEI delivered sudden explosive moves post-breakout. If history repeats, we could be looking at another strong rally ahead.
Entry looks promising, but as always, manage your risk wisely and set a proper stop loss to protect your capital.
BINANCE:SEIUSDT Currently trading at 0.265
Buy level : Above $0.263
Stop loss : Below $0.243
Target : $0.337
Max leverage 5x
Always keep stop loss
Follow Our Tradingview Account for More Technical Analysis Updates, | Like, Share and Comment Your thoughts
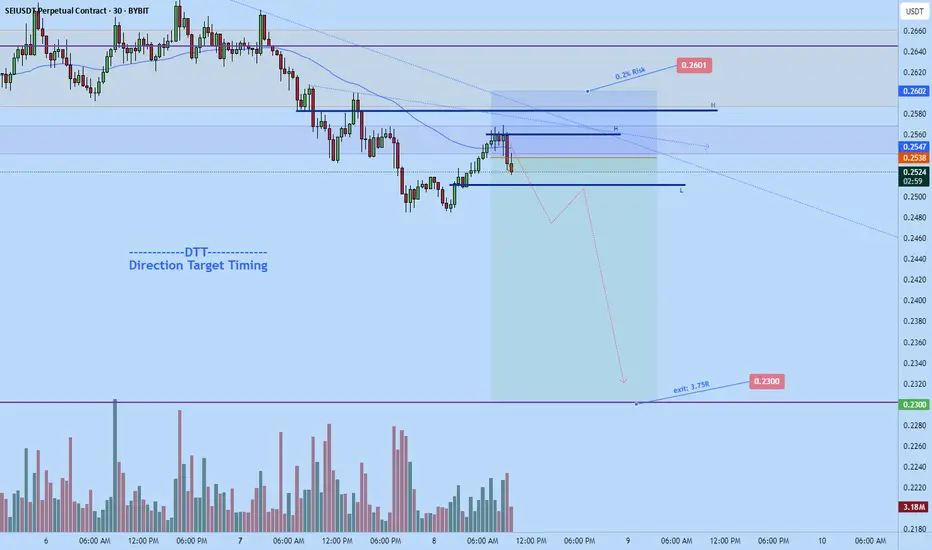
Sei big dump to $0.23Opened a short on sei a while ago. Aiming for $0.23 based on my DTT strategy.
Stop: $0.2601
Exit: $0.23 area
Roughly 3.75 RR if plays out.
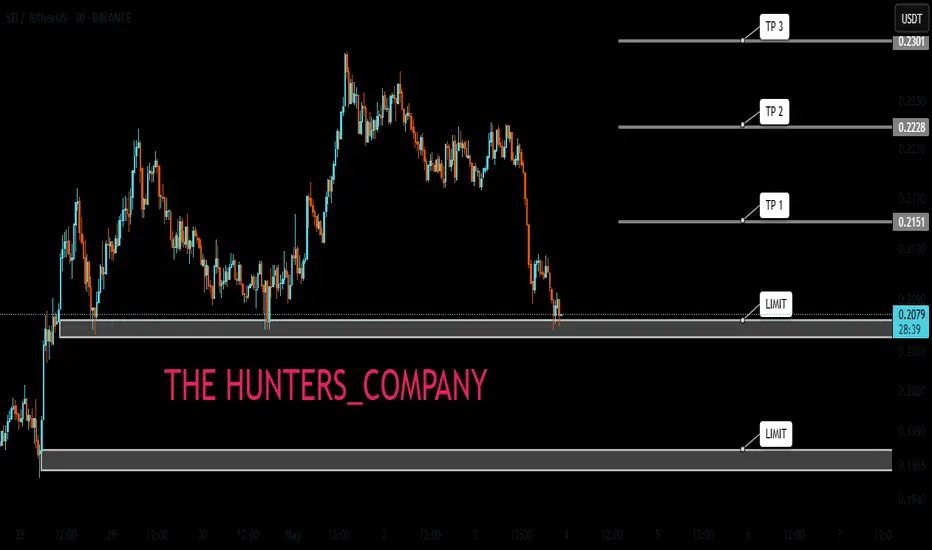
SEI LIMIT FOR BUYHello friends
Due to the price drop, we can buy on the drop within the specified limits and move with it to the specified targets, of course with capital and risk management.
*Trade safely with us*
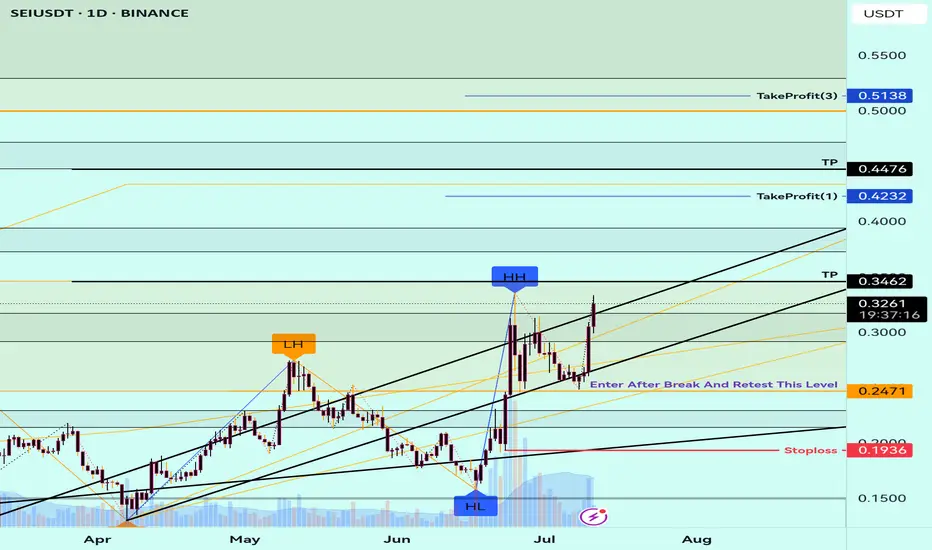
SEI Long – Breakout with Relative Strength & Trend ContinuationSEI is showing strong relative strength and has just broken out of recent structure. We’re watching for a higher low to form above the $0.22 zone, confirming trend continuation and unlocking upside liquidity.
📌 Trade Setup:
• Entry Zone: Around $0.22
• Take Profit Targets:
o 🥇 $0.29
o 🥈 $0.39
o 🥉 $0.49
• Stop Loss: Daily close below $0.19
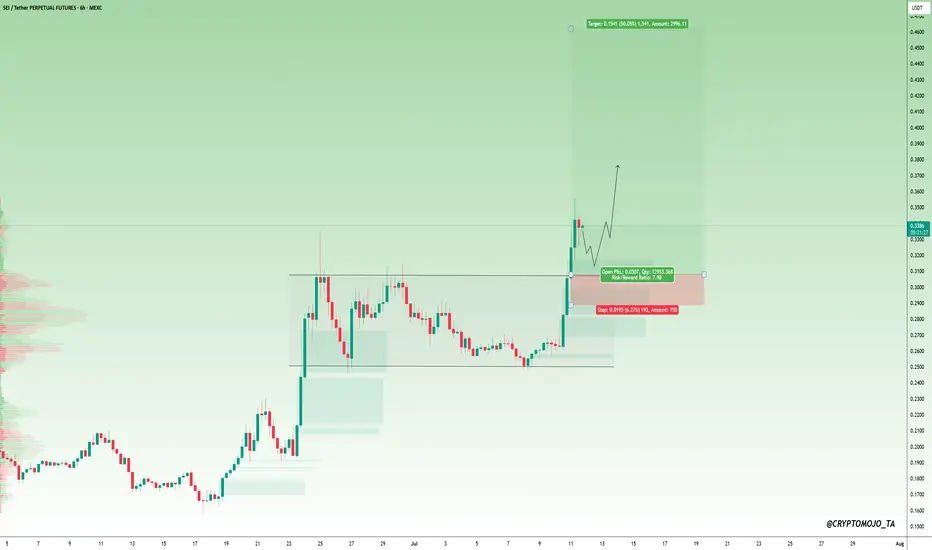
#SEI Breakout Update!#SEI Breakout Update 🚀
NYSE:SEI has broken out of its range on the 6H chart with strong momentum.
The price is now retesting the breakout zone.
If the support holds, it could move up toward $0.46 (around +36%).
Keep an eye on it! 👀
SEI | Waiting for a Higher LowSEI/USDT is currently setting up for a potential higher low formation, but confirmation is still pending. The price action shows promise but requires patience for the setup to materialize.
Current Situation:
Price is testing the orange ascending trendline support around $0.21
Waiting for a confirmed bounce to establish the higher low
The projected path (pink arrow) outlines the anticipated bullish trajectory
Key Levels to Watch:
Critical Support: Orange trendline around $0.21 (must hold)
Confirmation Level: Clean bounce above $0.22-0.23
Target: $0.33 resistance zone if higher low confirms
What's Needed:
Strong rejection from current support levels
Volume increase on any bounce attempt
RSI showing bullish divergence signals
Risk Factors:
Break below orange trendline would invalidate the setup
Failure to establish higher low could lead to further downside
Market conditions may impact the pattern's success
This is a wait-and-see scenario where patience is key. The higher low formation will only be confirmed once price demonstrates clear rejection from support and begins moving higher.
Buy Trade Strategy for SEI: Backing High-Performance Layer 1 Description:
This trading idea highlights SEI, a purpose-built Layer 1 blockchain optimized for trading and decentralized finance applications. SEI stands out in the crowded blockchain space thanks to its high throughput, low latency, and parallelized transaction processing, which are essential for the next generation of DeFi and on-chain trading platforms. With growing developer interest, ecosystem expansion, and strategic integrations, SEI is positioning itself as a foundational layer for scalable financial applications.
Its focus on performance and specialization makes SEI a strong contender for long-term growth, especially as institutional and retail demand for faster, more efficient blockchain infrastructure continues to rise. However, like all cryptocurrencies, SEI’s price and adoption remain influenced by market dynamics, regulatory factors, and competition in the Layer 1 sector.
Disclaimer:
This trading idea is for educational purposes only and does not represent financial advice. Cryptocurrency investments, including SEI, are highly speculative and come with substantial risk, including the potential for a complete loss of capital. Always conduct your own research, evaluate your risk tolerance, and consult with a financial advisor before making any investment decisions. Past performance is not indicative of future results.
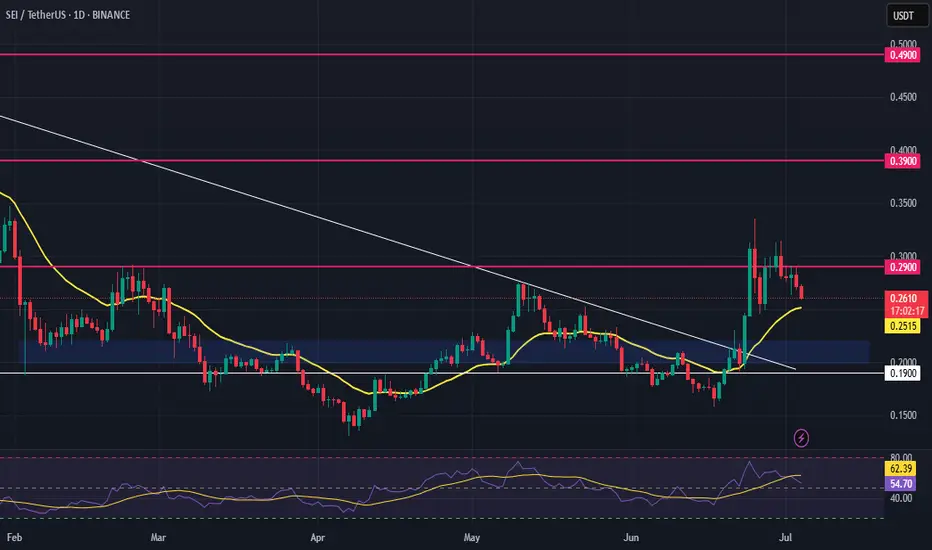
SEI/USDT Poised for a Major Breakout – Will It Surge Toward $0.7📊 Full Technical Analysis:
The SEI/USDT daily chart reveals a compelling setup with strong breakout potential. Here's a detailed breakdown:
🔍 Pattern & Key Structure:
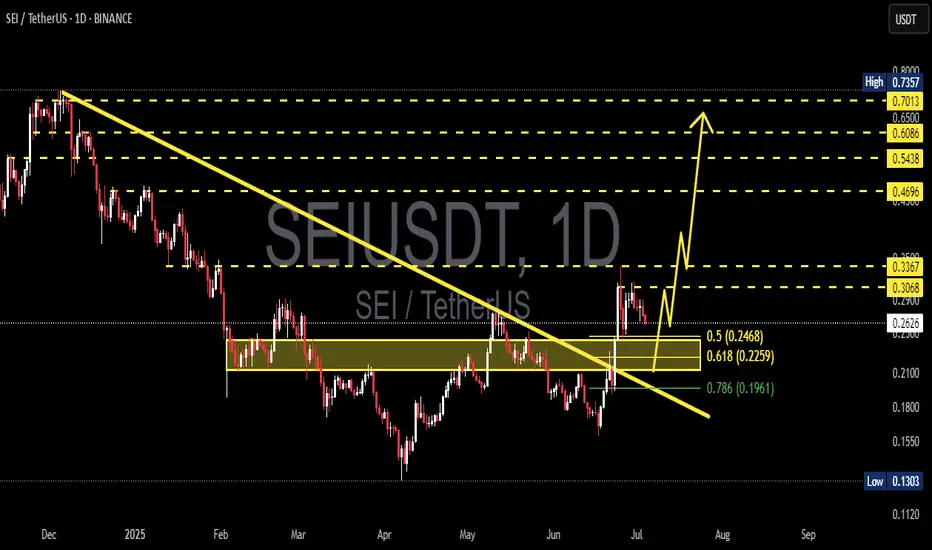
Descending Trendline Breakout: SEI has successfully broken out of a long-term descending trendline that has suppressed price action since December 2024 — a strong early signal of a bullish reversal.
Bullish Retest in Progress: The price is currently retesting the breakout area, aligning with a historical demand zone and Fibonacci retracement levels of 0.5 ($0.2468) and 0.618 ($0.2259).
Previous Consolidation Zone: SEI previously moved sideways within a yellow box between $0.18 – $0.25. The breakout from this zone adds bullish confirmation.
🟢 Bullish Scenario:
If SEI holds above the key demand zone ($0.2259 – $0.2468), a strong rally could follow, targeting these Fibonacci resistance levels:
🔸 $0.3068
🔸 $0.3367
🔸 $0.4696
🔸 $0.5438
🔸 $0.6086
🔸 $0.6500
🔸 Final target: $0.7013 (major resistance)
This scenario is validated by a higher low formation and a continuation of the current uptrend, especially if backed by strong volume.
🔴 Bearish Scenario:
If the price breaks below the demand zone ($0.2259 – $0.2468), further downside may be expected, with potential support levels at:
🔻 0.786 Fibonacci at $0.1961
🔻 Historical support zones at $0.18 and $0.13
A bearish breakdown would invalidate the bullish structure and suggest sellers remain in control.
📐 Pattern Summary:
Pattern Type: Descending Trendline Breakout + Bullish Retest
Validation: Retest aligned with Fibonacci & prior consolidation
Bias: Bullish, as long as the price holds above $0.2259
📝 Conclusion:
SEI/USDT is showing early signs of a bullish reversal after a breakout from its long-term downtrend. A continuation toward higher Fibonacci levels is likely if the price holds the key demand zone. Traders should watch for bullish confirmation signals near support before entering.
#SEI #SEIUSDT #CryptoBreakout #BullishSetup #TechnicalAnalysis #FibonacciTrading #CryptoSignals #AltcoinSeason #ChartPattern #CryptoTA
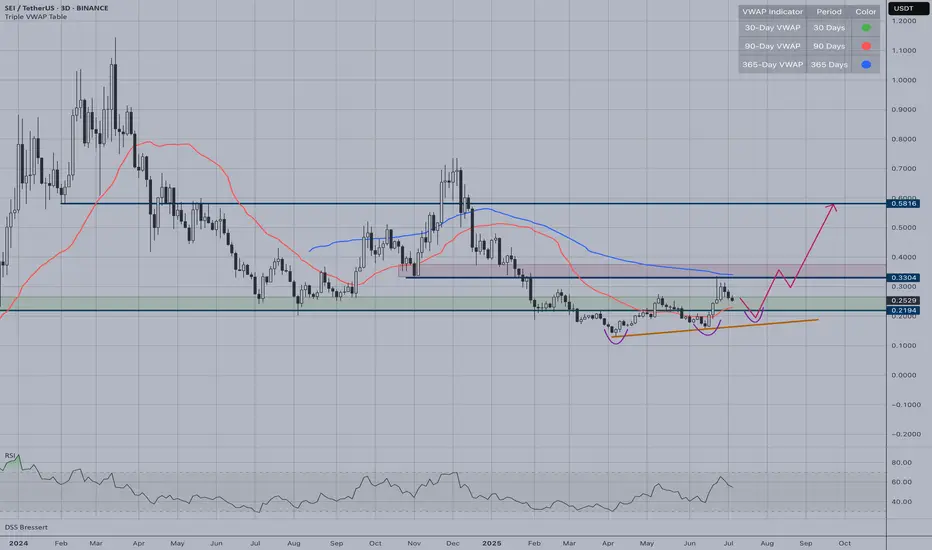
Recently Circle launched native USDC & CCTP on $SEIThis enables fast, low-cost stablecoin transfers on the efficient L1 blockchain, boosting liquidity and institutional adoption
This news made me curious about the chart
The price itself is reclaiming and holding a critical HTF level while breaking the bearish structure
The RSI above the 50 level is signaling a regaining of the bullish momentum
Perfect alignment to grab some for the longterm portfolio
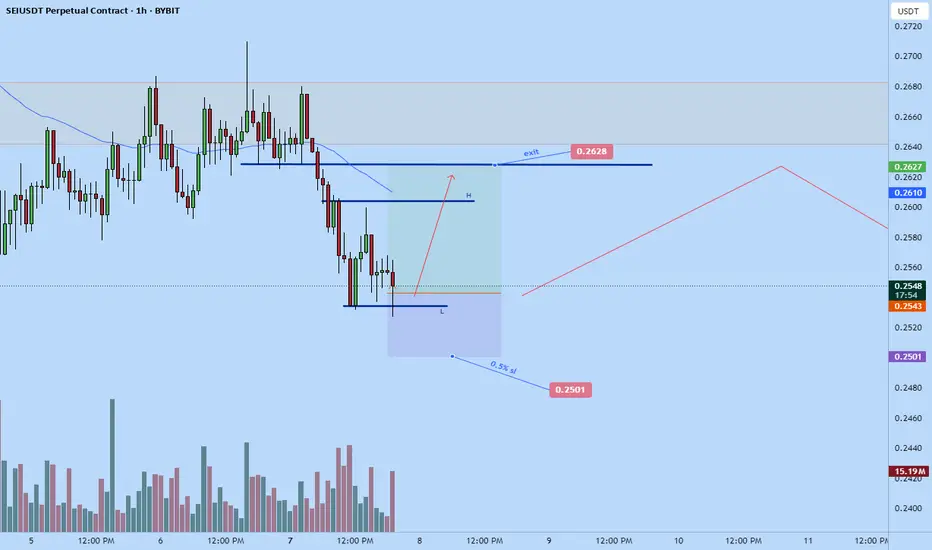
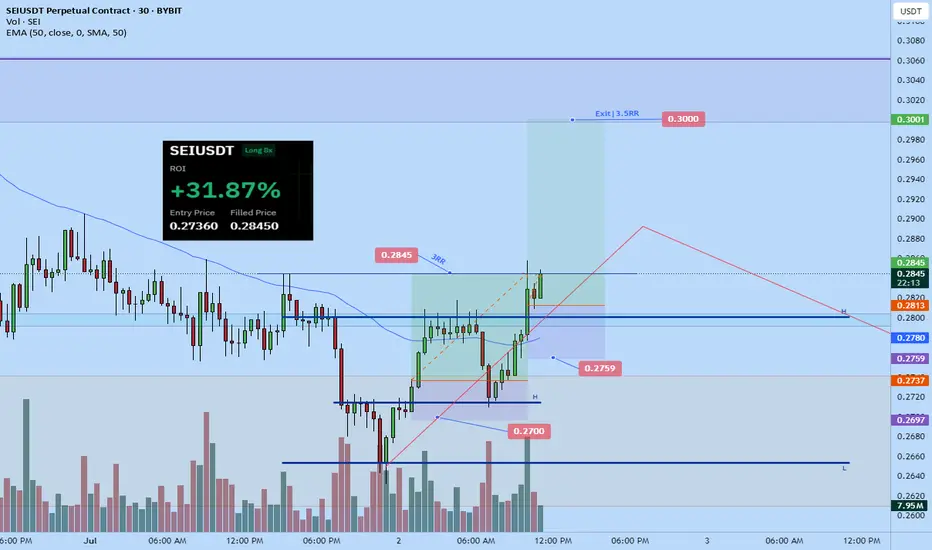
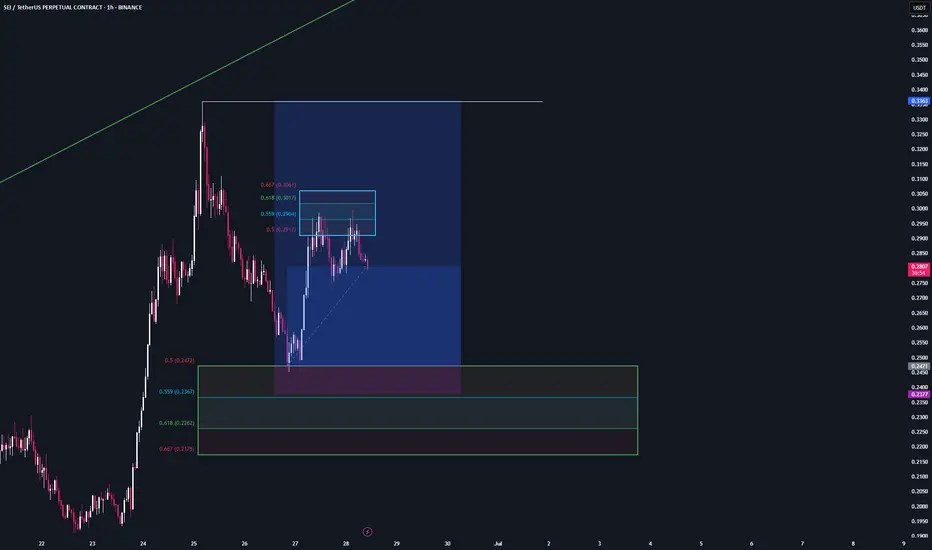
Sei long to $0.2845Sei long to $0.2845. Just went long.
Currently attempting to flip bullish on 1hr tf and will also likely push to flip bullish on 4hr tf as well based on my analysis.
Roughly 3RR setup
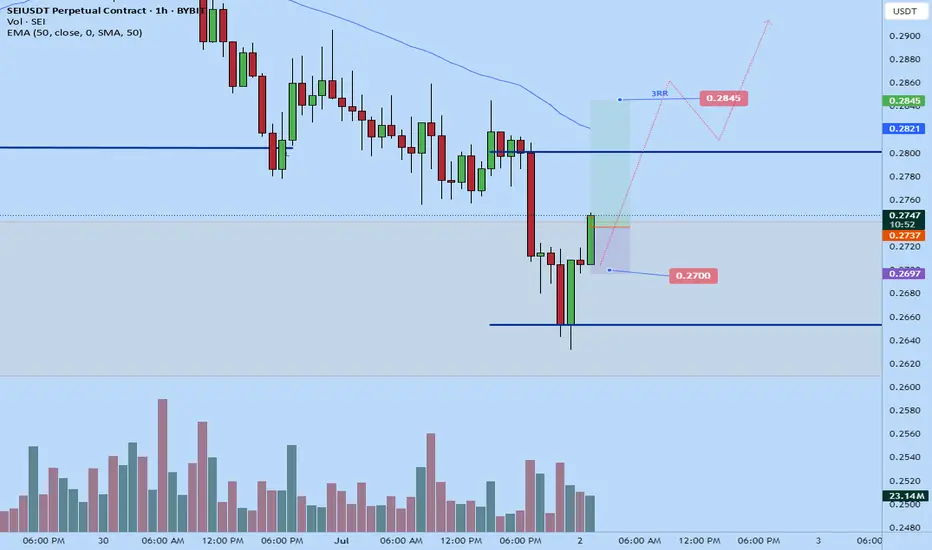
Important volume profile area: 0.2392
Hello, traders.
If you "follow", you can always get the latest information quickly.
Have a nice day today.
-------------------------------------
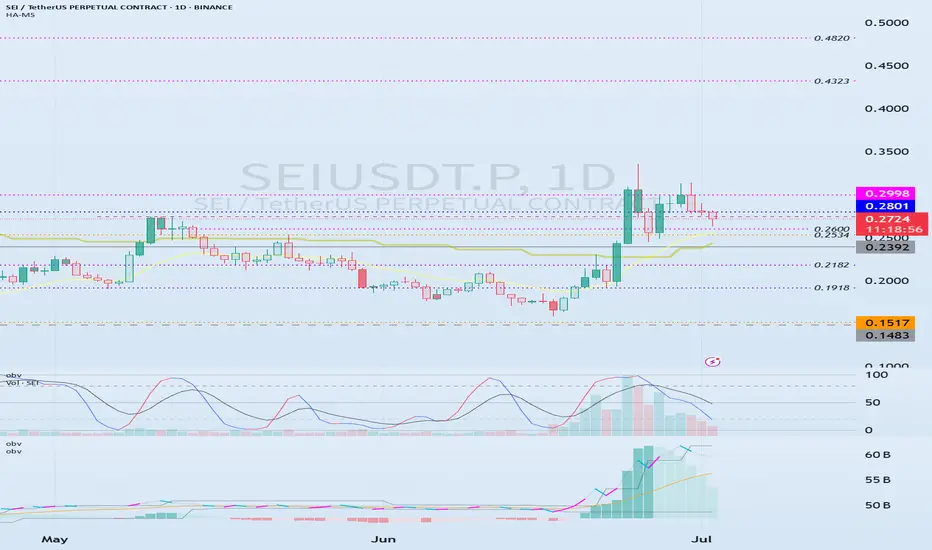
(SEIUSDT.P 1M chart)
I wonder what the 1M chart means on the futures chart, but if you know the current big picture trend, I think you can trade according to your main and secondary positions.
Currently, the volume profile section is formed at 0.2392 on the 1M chart, so it is expected that the major trend will be determined based on this point.
In other words, if the price is maintained above 0.2392, I think it is highly likely to turn into an uptrend.
-
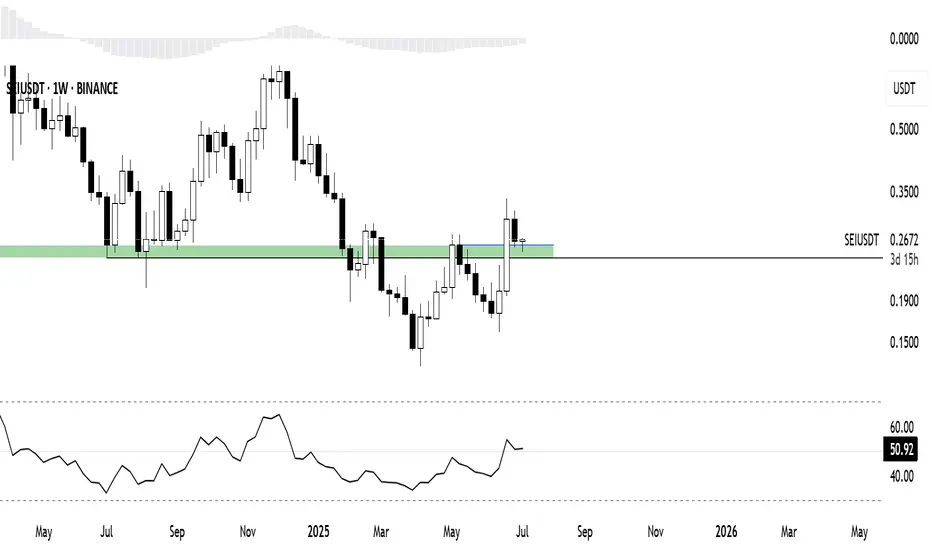
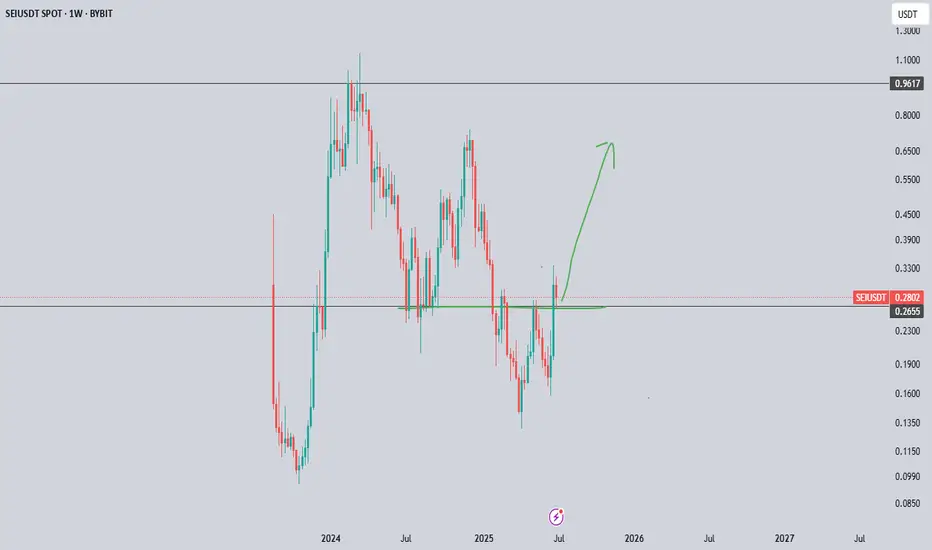
(1W chart)
Currently, on the 1W chart, we are checking for support near the 0.2750 point, which is the StochRSI 80 indicator point.
The StochRSI 80 indicator is one of the indicators that indicates the high point section.
Therefore, if it is supported near the StochRSI 80 indicator, it is highly likely to rise.
On the other hand, if it is not supported, it is important to check for support because it corresponds to the resistance point.
Once the rise begins, it is basically likely to rise until it meets the HA-High indicator.
The HA-High indicator is currently formed at 0.7406.
However, when rising, there is a possibility of receiving resistance near the area where the arrow is pointing, so you should think about a countermeasure.
-
(1D chart)
In order to rise, the price must rise above the 0.2801-0.2998 range and maintain it.
If not, there is a possibility of falling until the HA-Low indicator is met.
However, since an important volume profile range is formed at the 0.2392 range, whether there is support near this area is an important issue.
Therefore, if it falls below 0.2392, it is recommended to stop trading and check the situation if possible.
If it rises above 0.2998, it seems likely to surge to the 0.4323-0.4820 range because the resistance range is weak.
-
Thank you for reading to the end.
I hope you have a successful trade.
--------------------------------------------------
- Here is an explanation of the big picture.
(3-year bull market, 1-year bear market pattern)
I will explain more details when the bear market starts.
------------------------------------------------------
sei long again to $0.3Recently went long on sei, targeted the 4hr HH point. corrected a bit and went long again, this time targeting $0.3
Time sensitive. Still one can get Like 2RR + from it I think
stop could be tigher as well to around $0.2780
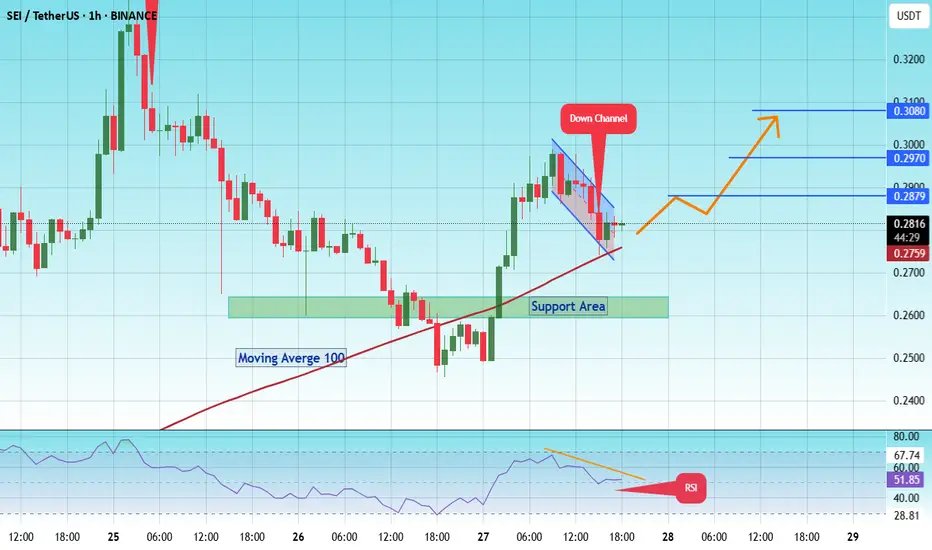
SEI The next big Move#SEI
The price is moving within a descending channel on the 1-hour frame and is expected to break and continue upward.
We have a trend to stabilize above the 100 moving average once again.
We have a downtrend on the RSI indicator that supports the upward break.
We have a support area at the lower boundary of the channel at 0.2750, acting as strong support from which the price can rebound.
We have a major support area in green that pushed the price upward at 0.2600.
Entry price: 0.2813
First target: 0.2879
Second target: 0.2970
Third target: 0.3080
To manage risk, don't forget stop loss and capital management.
When you reach the first target, save some profits and then change your stop order to an entry order.
For inquiries, please comment.
Thank you.
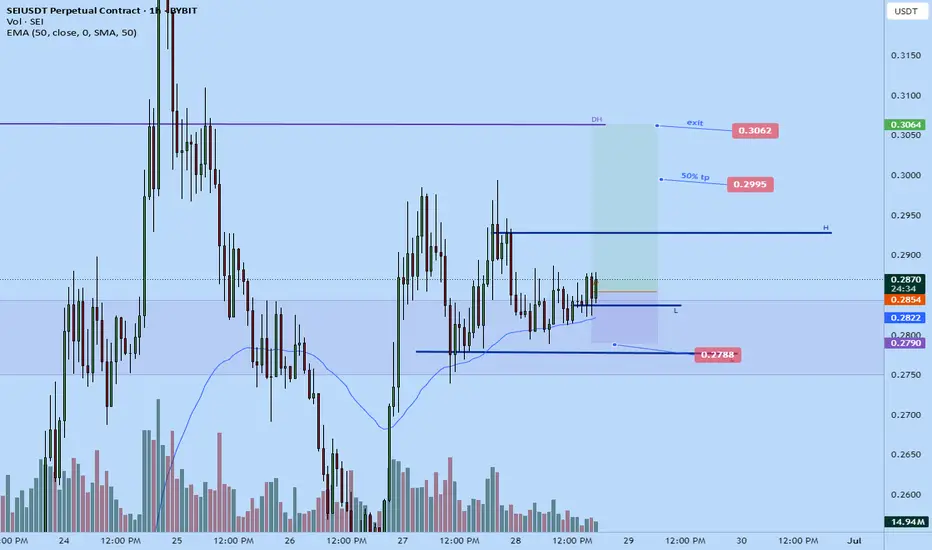
Sei long to $0.3062Recently entered long on sei
Targetting the daily high area around $0.3062
Stop: 0.2788
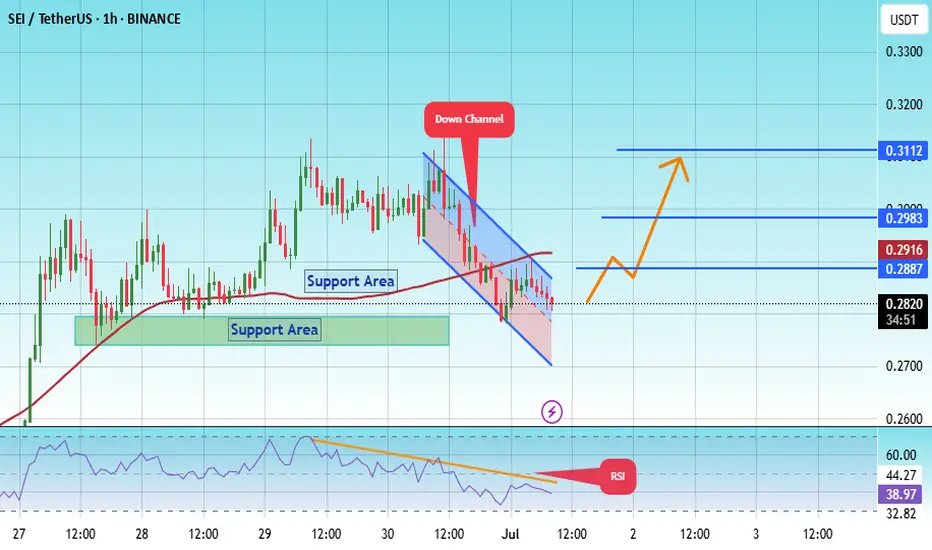
#SEI/USDT#SEI
The price is moving within a descending channel on the 1-hour frame, adhering well to it, and is heading for a strong breakout and retest.
We have a bounce from the lower boundary of the descending channel. This support is at 0.2745.
We have a downtrend on the RSI indicator that is about to be broken and retested, supporting the upside.
There is a major support area (in green) at 0.2710, which represents a strong basis for the upside.
Don't forget a simple thing: ease and capital.
When you reach the first target, save some money and then change your stop-loss order to an entry order.
For inquiries, please leave a comment.
We have a trend to hold above the 100 Moving Average.
Entry price: 0.2813
First target: 0.2887
Second target: 0.2983
Third target: 0.3112
Don't forget a simple thing: ease and capital.
When you reach the first target, save some money and then change your stop-loss order to an entry order.
For inquiries, please leave a comment.
Thank you.
Sei - Trade✅ Entry at the green trend reversal zone
✅ 50% Fibonacci level hit perfectly
✅ Expected reaction – impulsive move toward TP1
Our first take profit at the trend reversal zone at $0.29 has been reached, and the stop-loss has been moved to break-even.
TP2 is set at the 100% correction level at $0.336 — I’ll realize most of my profits there and let a small amount run from that point on.
Looking for reversal trades usimng the 6H CPRLooking for reversal trades usimng the 6H CPR combining it with using the PAR momentum indicator.

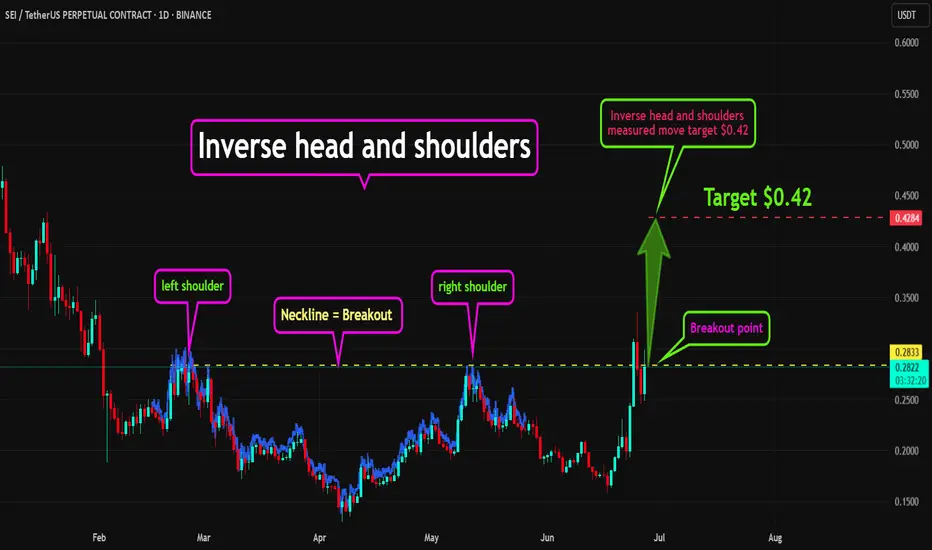
$SEI READY FOR NEXT MAJOR RALLY +80%Whats up traders!?! If i could ask you to LIKE if you found this content worth viewing and could provide value to others then smash that LIKE button and if you want to FOLLOW that would be awesome too! Thanks
A simple analysis on NYSE:SEI
The NYSE:SEI team is cooking and when i say cooking i mean building heavily thats why we saw a massive price swing up last week on NYSE:SEI which i publicly shared on X and also exclusively shared the entry, target and stoploss to the massive NYSE:SEI pump in my private tg.
Resistance
$0.3060
$0.3354
$0.3500
$0.4273
$0.4743
Your Entry is NOW below $0.30 cents
Highly likely we go to almost $0.50 cents once we break $0.30 cents as there is an inverse head and shoulders formation that has a measured move to at least $0.42 cents
Make sure to trade responsibly and always use proper risk management. If you need help with that contact e on tradingview and i will be more then happy to help!
Thanks, Liquidmex