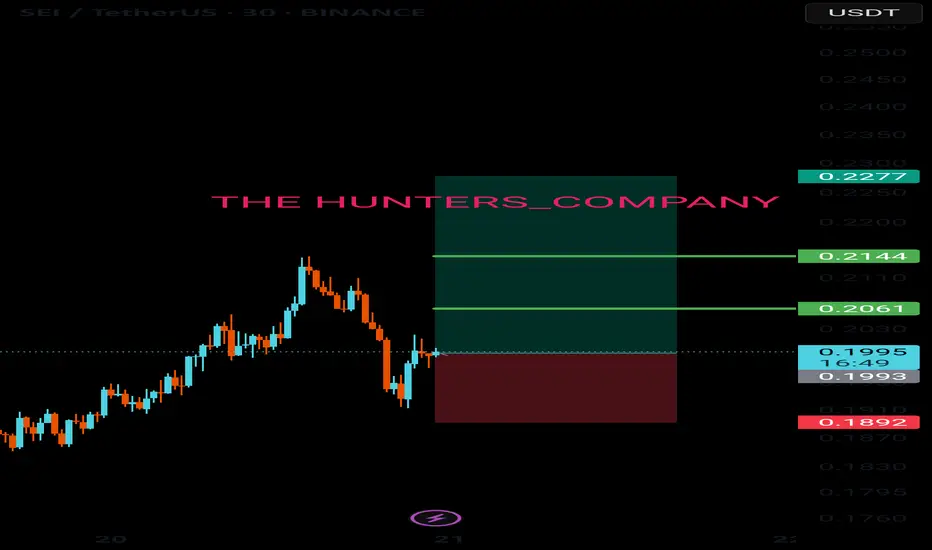
Live trade hello friends✋️
Considering the price drop, you can now see that we are in important support and now we can take advantage of this situation and enter into a transaction with risk and capital management.
🔥Follow us for more signals🔥
*Trade safely with us*
Related pairs
#SEI/USDT#SEI
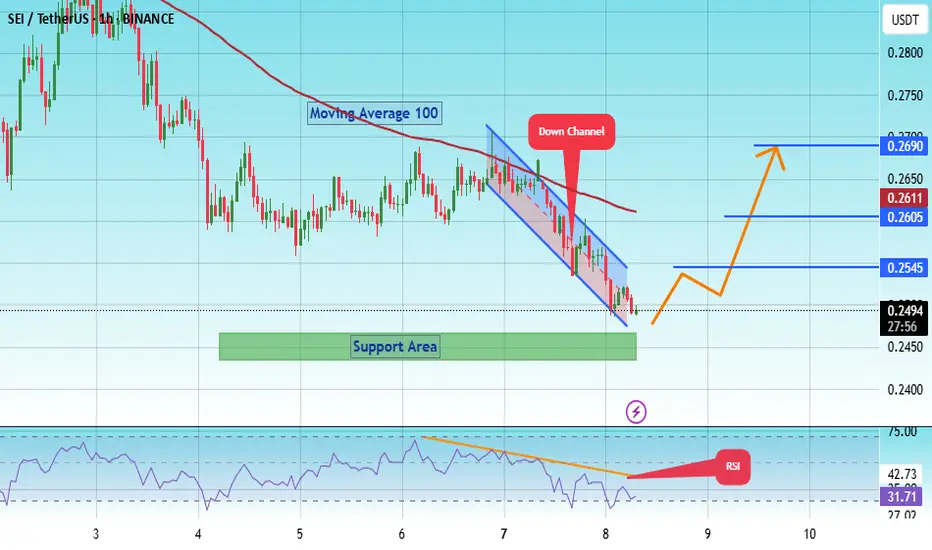
The price is moving within a descending channel on the 1-hour frame, adhering well to it, and is on its way to breaking it strongly upwards and retesting it.
We have a bounce from the lower boundary of the descending channel. This support is at 0.2470.
We have a downtrend on the RSI indicato
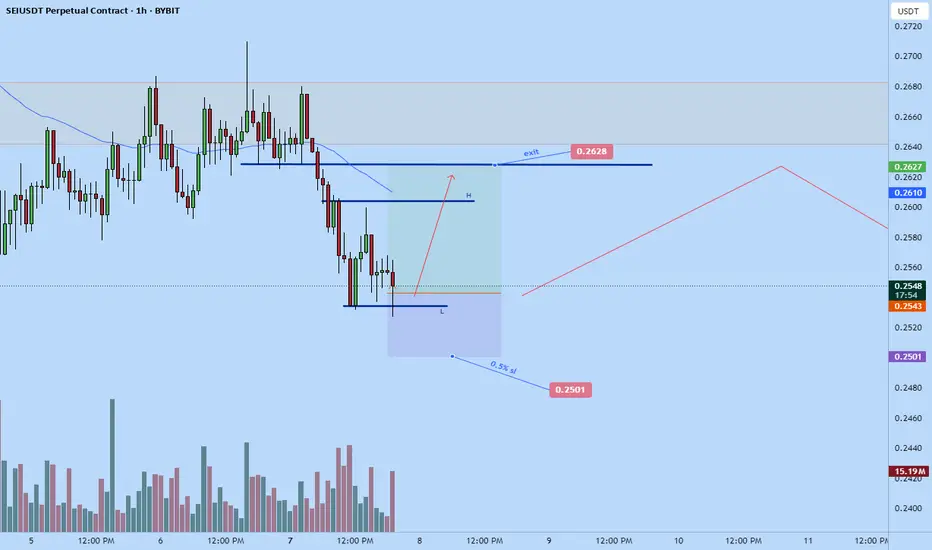
Sei long before further dump Based on my analysis am anticipating a correction up tonight before continuation dump.
Stop: $0.2501
Tp: $0.2627 area
Roughly 2RR
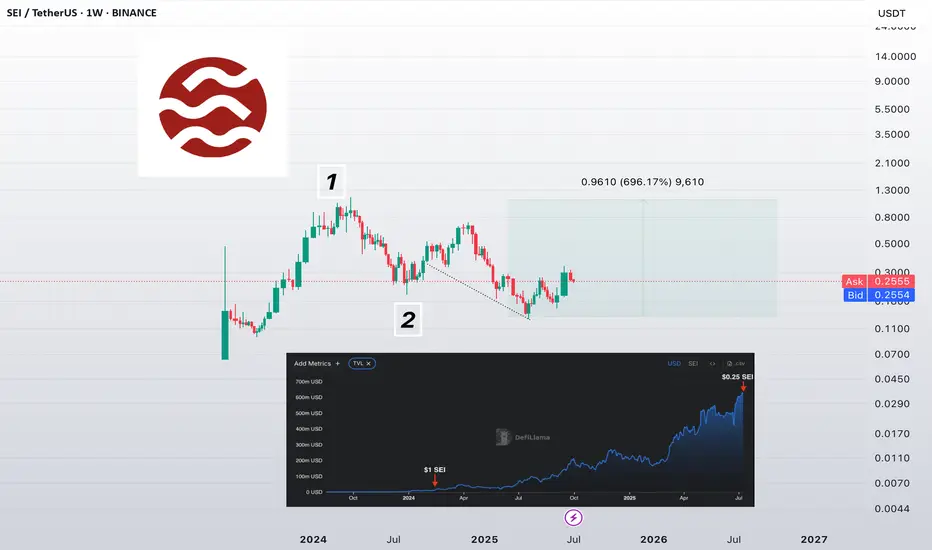
$SEI — the most underrated monster right now?
➡️ February 2024:
TVL = $13M
Price = $1
Market Cap ≈ $2.4B
➡️ Now:
TVL = $624M ❗️
Price = $0.25
Market Cap ≈ $1.4B
❓ How can you ignore these numbers? The project grew 48x in TVL, but the market cap dropped nearly 2x. Where's the logic?
If you're whining about the $0.25 price —
🔴 you're only loo
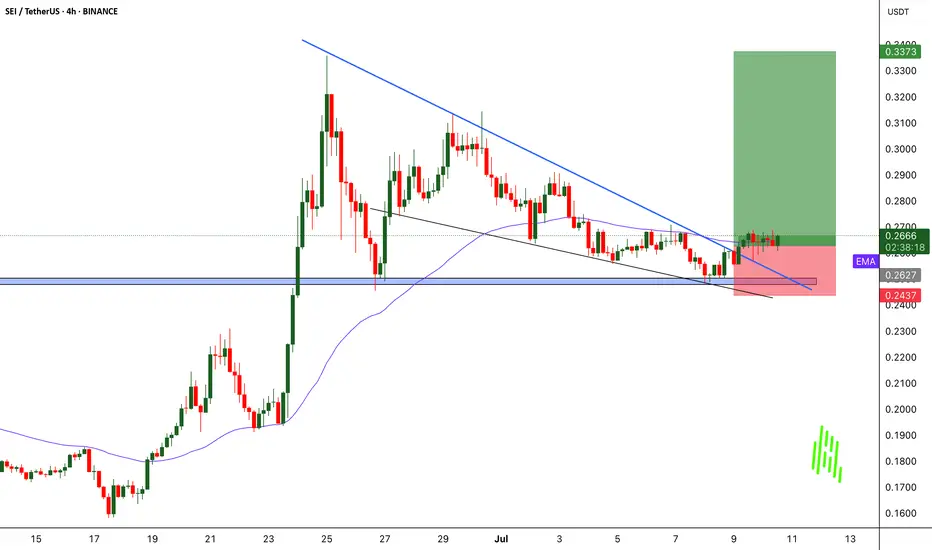
SEIUSDT Rebounds from Key Support - Pump Loading?BINANCE:SEIUSDT Rebounds from Key Support - Pump Loading?
BINANCE:SEIUSDT just touched a major support level on the 4H chart and is now showing signs of a bullish reversal after breaking above the descending trendline. This setup looks similar to previous price actions where NYSE:SEI delivered
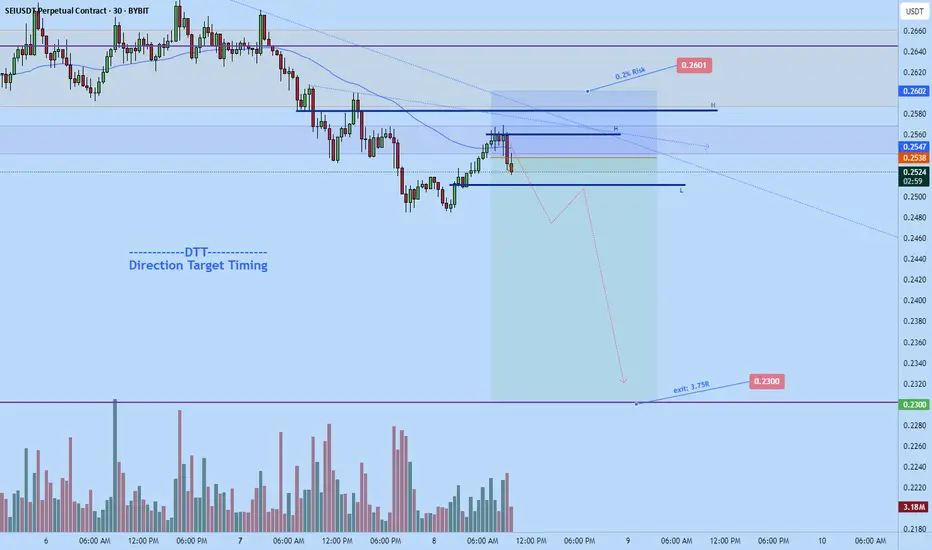
Sei big dump to $0.23Opened a short on sei a while ago. Aiming for $0.23 based on my DTT strategy.
Stop: $0.2601
Exit: $0.23 area
Roughly 3.75 RR if plays out.
SEI LIMIT FOR BUYHello friends
Due to the price drop, we can buy on the drop within the specified limits and move with it to the specified targets, of course with capital and risk management.
*Trade safely with us*
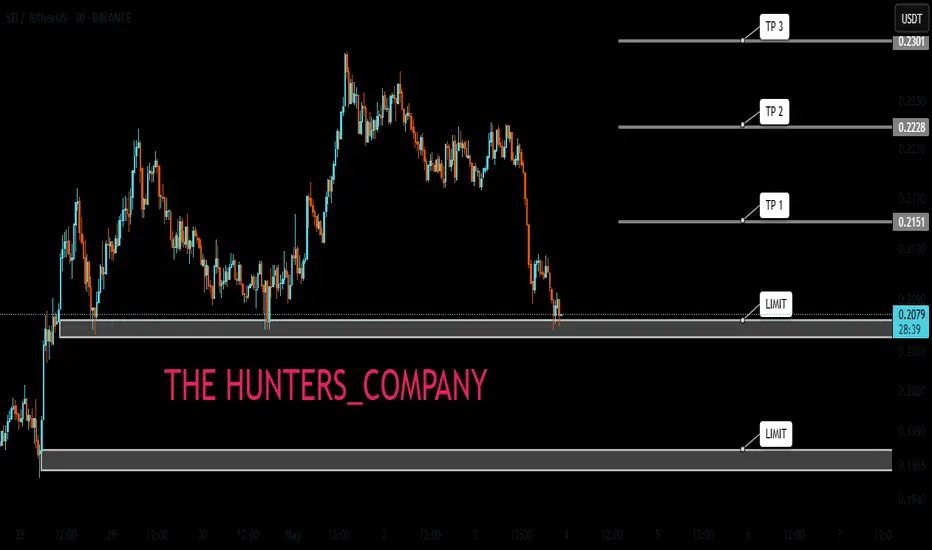
SEI Long – Breakout with Relative Strength & Trend ContinuationSEI is showing strong relative strength and has just broken out of recent structure. We’re watching for a higher low to form above the $0.22 zone, confirming trend continuation and unlocking upside liquidity.
📌 Trade Setup:
• Entry Zone: Around $0.22
• Take Profit Targets:
o 🥇 $0.29
o 🥈 $0.39
o 🥉
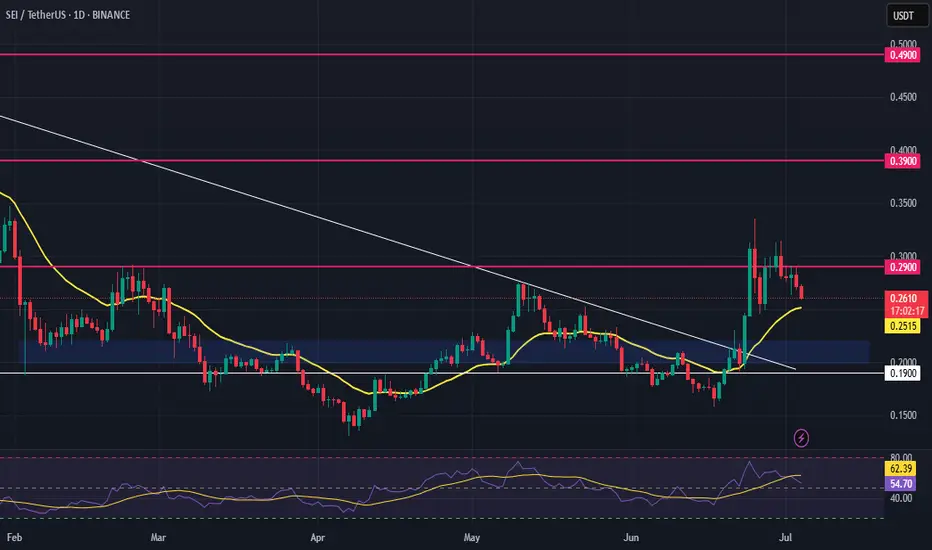
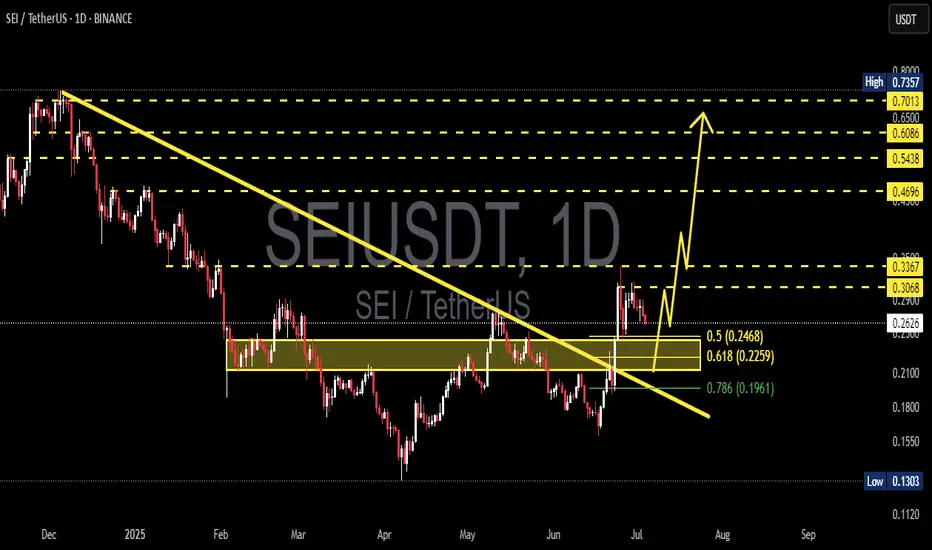
SEI/USDT Poised for a Major Breakout – Will It Surge Toward $0.7📊 Full Technical Analysis:
The SEI/USDT daily chart reveals a compelling setup with strong breakout potential. Here's a detailed breakdown:
🔍 Pattern & Key Structure:
Descending Trendline Breakout: SEI has successfully broken out of a long-term descending trendline that has suppressed price actio
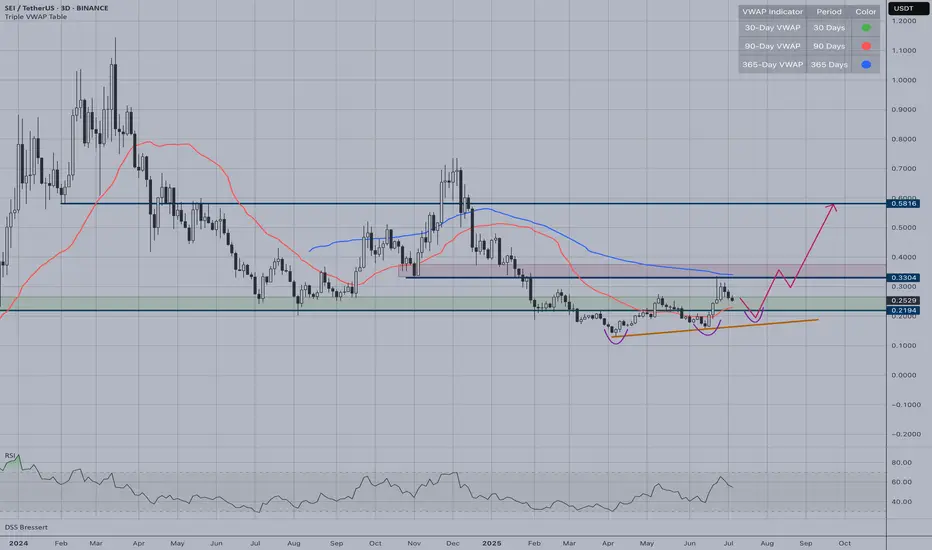
SEI | Waiting for a Higher LowSEI/USDT is currently setting up for a potential higher low formation, but confirmation is still pending. The price action shows promise but requires patience for the setup to materialize.
Current Situation:
Price is testing the orange ascending trendline support around $0.21
Waiting for a confir
See all ideas
Summarizing what the indicators are suggesting.
Oscillators
Neutral
SellBuy
Strong sellStrong buy
Strong sellSellNeutralBuyStrong buy
Oscillators
Neutral
SellBuy
Strong sellStrong buy
Strong sellSellNeutralBuyStrong buy
Summary
Neutral
SellBuy
Strong sellStrong buy
Strong sellSellNeutralBuyStrong buy
Summary
Neutral
SellBuy
Strong sellStrong buy
Strong sellSellNeutralBuyStrong buy
Summary
Neutral
SellBuy
Strong sellStrong buy
Strong sellSellNeutralBuyStrong buy
Moving Averages
Neutral
SellBuy
Strong sellStrong buy
Strong sellSellNeutralBuyStrong buy
Moving Averages
Neutral
SellBuy
Strong sellStrong buy
Strong sellSellNeutralBuyStrong buy
Displays a symbol's price movements over previous years to identify recurring trends.
Frequently Asked Questions
The current price of SEI/USD TETHER (SEI) is 0.3374 USDT — it has risen 11.37% in the past 24 hours. Try placing this info into the context by checking out what coins are also gaining and losing at the moment and seeing SEI price chart.
SEI/USD TETHER price has risen by 25.19% over the last week, its month performance shows a 63.19% increase, and as for the last year, SEI/USD TETHER has increased by 7.55%. See more dynamics on SEI price chart.
Keep track of coins' changes with our Crypto Coins Heatmap.
Keep track of coins' changes with our Crypto Coins Heatmap.
SEI/USD TETHER (SEI) reached its highest price on Dec 5, 2024 — it amounted to 0.7362 USDT. Find more insights on the SEI price chart.
See the list of crypto gainers and choose what best fits your strategy.
See the list of crypto gainers and choose what best fits your strategy.
SEI/USD TETHER (SEI) reached the lowest price of 0.1300 USDT on Apr 7, 2025. View more SEI/USD TETHER dynamics on the price chart.
See the list of crypto losers to find unexpected opportunities.
See the list of crypto losers to find unexpected opportunities.
The safest choice when buying SEI is to go to a well-known crypto exchange. Some of the popular names are Binance, Coinbase, Kraken. But you'll have to find a reliable broker and create an account first. You can trade SEI right from TradingView charts — just choose a broker and connect to your account.
Crypto markets are famous for their volatility, so one should study all the available stats before adding crypto assets to their portfolio. Very often it's technical analysis that comes in handy. We prepared technical ratings for SEI/USD TETHER (SEI): today its technical analysis shows the strong buy signal, and according to the 1 week rating SEI shows the strong buy signal. And you'd better dig deeper and study 1 month rating too — it's neutral. Find inspiration in SEI/USD TETHER trading ideas and keep track of what's moving crypto markets with our crypto news feed.
SEI/USD TETHER (SEI) is just as reliable as any other crypto asset — this corner of the world market is highly volatile. Today, for instance, SEI/USD TETHER is estimated as 18.59% volatile. The only thing it means is that you must prepare and examine all available information before making a decision. And if you're not sure about SEI/USD TETHER, you can find more inspiration in our curated watchlists.
You can discuss SEI/USD TETHER (SEI) with other users in our public chats, Minds or in the comments to Ideas.