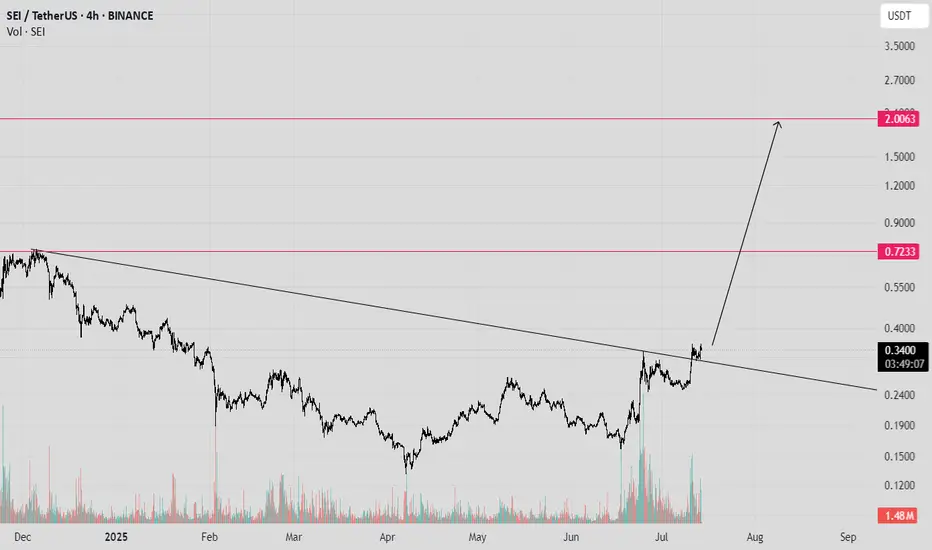
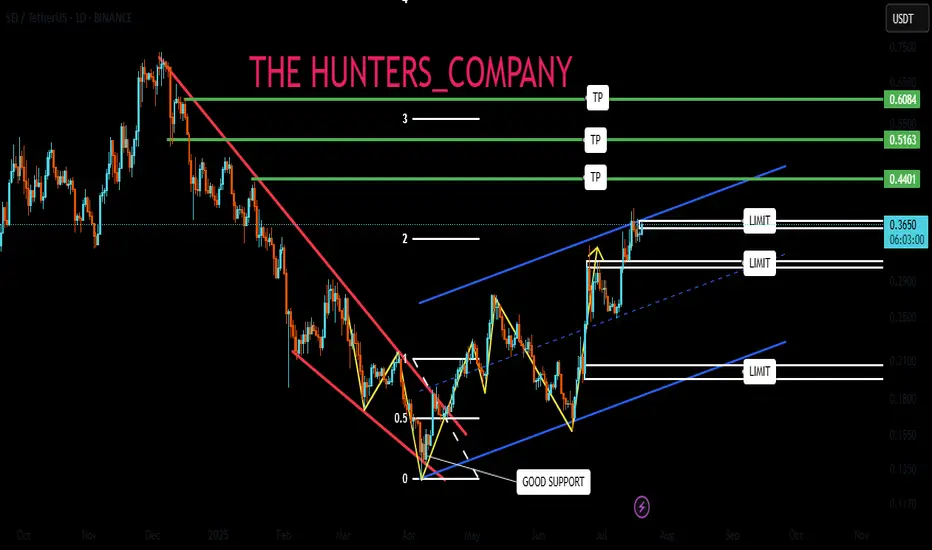
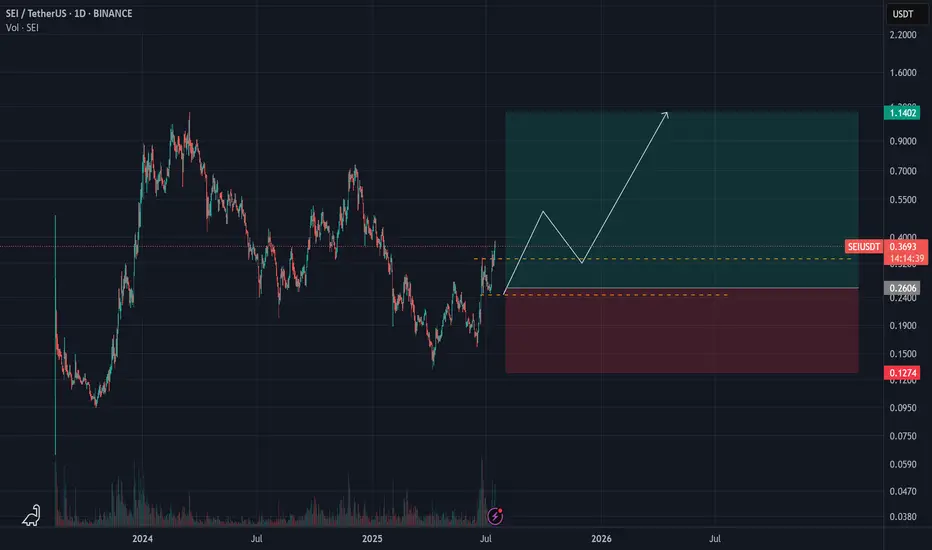
SEI Breakout Setup: Buy the Dip Before the Next Leg UpAfter the low around 0.13 in April, SEI started to recover, and although the first attempt to reclaim the 0.25–0.26 zone failed in mid-May, that key area—a former support from last year—was finally broken at the end of June.
Now, this previous resistance has turned into support, and even though gains have so far been capped by the falling trendline, price is consolidating above support – which could be a sign of bullish pressure building.
If we get a clean break above this descending trendline, momentum could accelerate, opening the way for a push toward the 0.75 resistance.
This is exactly the scenario I’m working with.
I'm looking to buy dips, with an ideal entry around 0.30, while keeping in mind that a move below 0.25 would invalidate the setup.
✅ Risk-reward? With a stop below 0.25, this setup offers a 1:4 R:R, and even a realistic chance at a 2x trade, which would be quite reasonable under current market conditions.
SEIUSDT trade ideas

Sei · Technical Analysis · Beyond Trading —The Soul in the ChartThis is a nice chart. It is well structured. It is also basic and standard. You can know where a project is at based on the drawings (patterns) on the chart. When you look at hundreds of charts, for years, you can see the signature of the trading bots on each chart. Each exchange has a different set of algorithms doing the trading. It is fascinating to say the least. Once you learn their language and understand their behaviour, you can time the market and predict market moves. I've seen the same patterns, actions and reactions repeating thousands of times, over and over, again and again. This is good, it helps us predict the market.
Even if humans are the ones doing most of the trading, their habits and customs will show up on the chart. These will appear as different sequences, fractals and patterns. People act based on instincts, emotions, impulses and intuitions. These come based on the weather, the environment, our relations, physical chemistry and the effect of the astros on our bodies and minds. If we can put all these things together we can time the market. Doing it consciously sounds (feels/looks) like a very hard task but most of it is done subconsciously, like driving. You learn to perform the craft consciously but once you have practice and engage in it then it comes out naturally; you don't have to think about changing gears or pressing on the gas, you just do it; like riding a bike. That's technical analysis for you, that's trading. It can be approached in the same way. If you engage the market long enough, with an open mind always ready to adapt and accept new input, eventually you move with the market and this movement will tend to be the right choice when it comes to making a decision.
This or that? Your intuition is when solutions and answers come forth from a vast array of subconscious material. So we read, we trade and we participate and our minds take care of the rest. The way to organize all this subconscious information and make it useful—and available to the conscious mind—is through meditation.
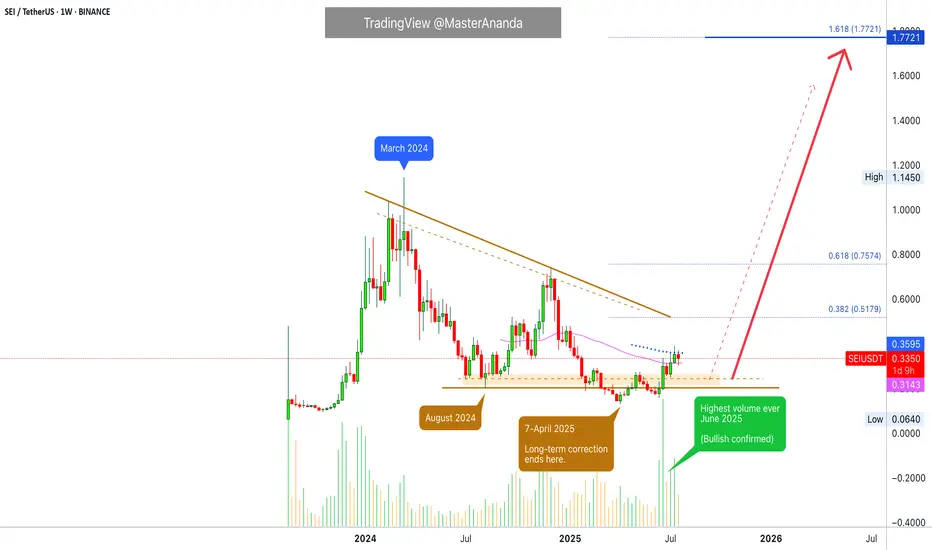
I am going to go with the volume signal. The highest volume ever happened in June after a higher low. The main low from the March 2024 high happened in 2025-April, the market bottom. There was a low in August 2024 and this becomes an important level. When the action moved below, it activates signals for buyers; when the action moves back above, we are in the bullish zone. Current price action confirms this, SEIUSDT is long-time bullish now. Rising for months but momentum is yet to show. This is only the start.
The action is happening above EMA55 below EMA89. Support and resistance.
Considering the bigger picture and the overall growth potential we can say the market is still trading at the bottom. I am using the linear chart to make this clear.
After the highest volume ever the market cannot start dropping. After more than a year of bearish action, between March 2024 and April 2025, seeing a full green candle with the highest volume ever after a higher low means that the bulls are in. Coming from a technical analysis perspective, this means that the bullish bias is confirmed.
The break and close above EMA55 weekly gives this signal additional strength, and what is happening across the altcoins market; every single day several pairs are growing more than 100%, in just one day; reveals what the future holds.
This is not speculation. This is not my speculative opinion. This is a translation of actual price data, which is the action the market participants are taking, that says we are going up.
It is not "I" that is saying "we are going up." It is the chart, the market, the data. It is inevitable, it is already confirmed based on the information that I've been showing you month after month after month.
It is not predicting the future. It is simply pointing out the logical conclusion of a series of events. If someone has an idea to build a house and from this idea starts to work; accumulate the necessary money, hire an engineer and take all the necessary steps to build a house, you can easily say, if you have access to this information, that a house will be built at some point. You don't have to be genius to do it, but you know this person has been putting the money and effort, has been taking all the steps that are necessary to get it done. Knowing this, you can say with a high level of certainty that it will be done, based on the data of course. Crypto is going up. Only a Black Swan event can stop this, and you can't predict those. So we go with what is possible and what we know. Just watch!
Thanks a lot for your continued support.
It might be hard to be 100% right or predict minor swings and changes short-term, but when it comes to the bigger picture? It is impossible to miss.
Thank you for reading.
Namaste.
Sei long to $0.3556just now opened up a long position on sei. Aiming for 0.3556
Tp1: $0.35
Tp2: $0.3556
Sl: $0.3374

SEI | Full AnalysisHere is the top-down analysis for Sei as requested 🫡
Weekly Timeframe:
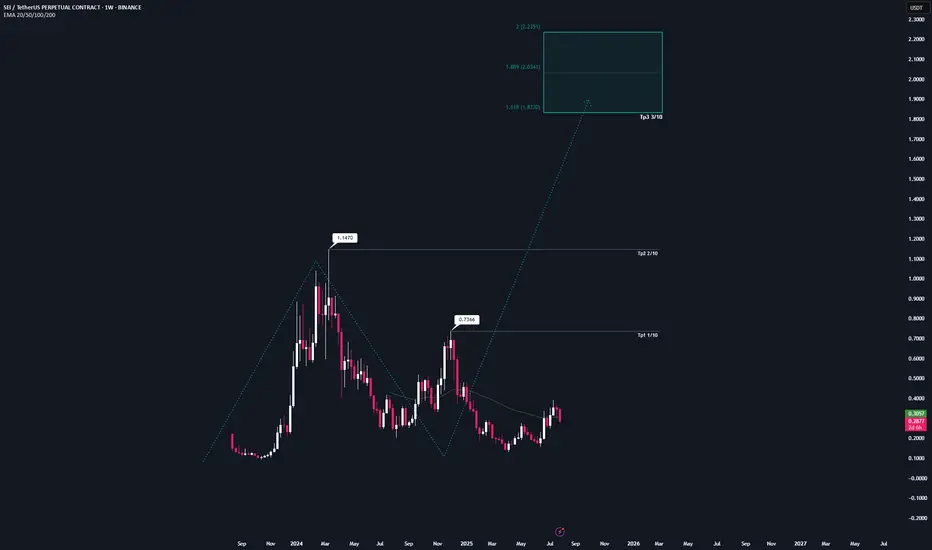
We have a potential large structure forming on the weekly chart that will be activated once we break the ATH. Its target zone lies between $1.8 and $2.2.
My sell targets for SEI this cycle are:
TP1: $0.73
TP2: $1.14
TP3: $1.83
These are my sell targets based on my technical analysis. However, I won’t rely on them alone — I also follow several on-chain indicators. Once retail euphoria kicks in and my indicators trigger, I’ll start selling accordingly.
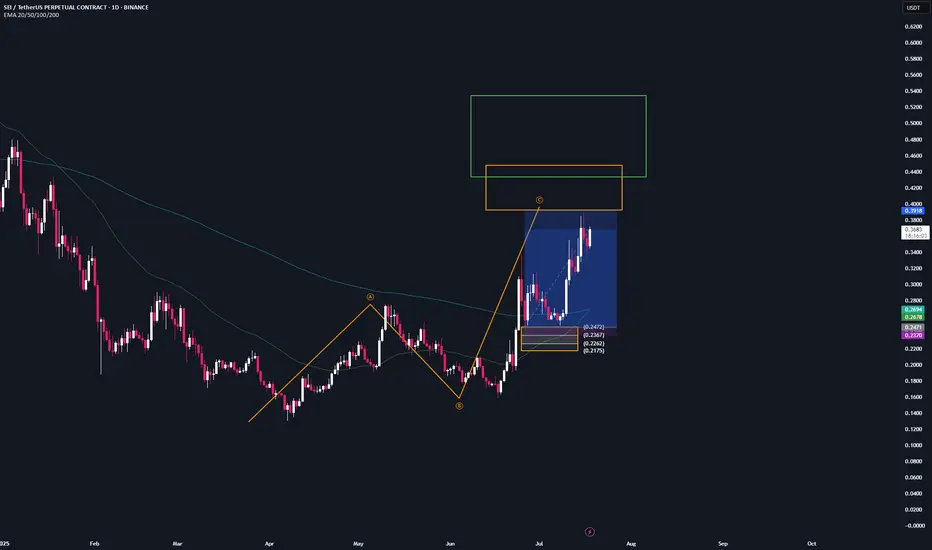
Daily chart:
On the daily, we have a sequence that has already been activated and almost reached its target zone. That’s why the B–C correction level remains a valid buy zone, which I’ll also use for additional long entries.
This would be the second attempt from a B–C correction level, as we’ve already tapped it once (where I went long) and I’ll be entering again here.
Target zone for this sequence: $0.39–$0.44
Local Price action:
On the lower timeframe, we’ve just completed a bearish structure that perfectly overlaps with the B–C correction level. This increases the probability of this setup significantly, as both sides (bulls and bears) want the same thing here: bulls are buying the market, while bears are covering shorts and taking profits.
-----
Thats the my full Analysis for SEI, hope it was helpful if you want me to do another analysis for any other pair just comment down below.
Also, if anyone is interested in how my trading system works, let me know and I’ll post some educational content about it.
Thanks for reading❤️
[Deep Dive] SEI – Edition 2: From Pain to Power: A Bull Cycle?SEIUSDT may have just flipped the script.
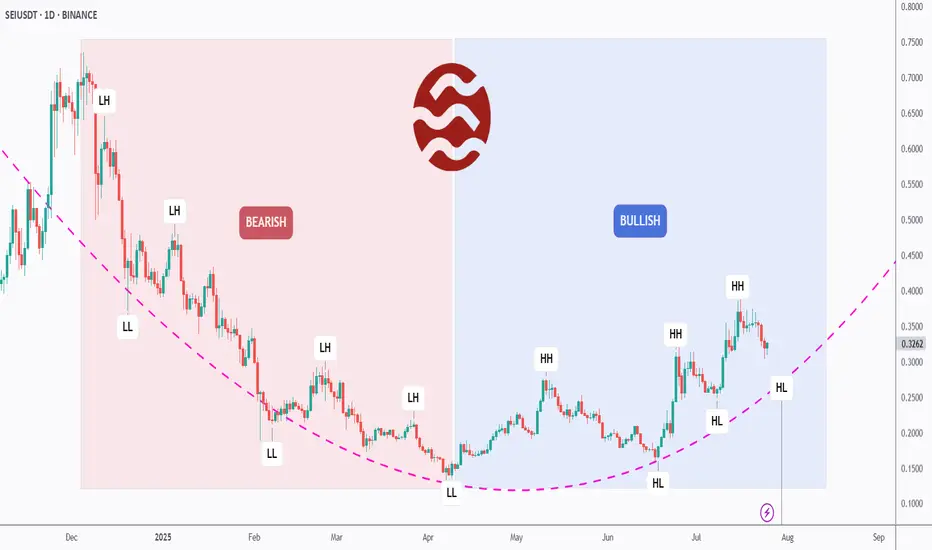
After months of consistent lower highs and lower lows, SEI has officially broken its bearish structure and is now printing clear higher highs (HH) and higher lows (HL) — a textbook sign of a trend reversal.
📉 Left Side: Bearish Breakdown
From late 2023 to Q2 2025, SEI was stuck in a painful macro downtrend. The structure was brutally clean: LH → LL → LH → LL. Each bounce was weaker than the last, reflecting exhausted buyers and relentless supply.
But something changed in late Q2…
📈 Right Side: Bullish Rebuild
Since its final low around April, SEI began to carve a new path. What started as a subtle accumulation quickly morphed into a solid structure of higher highs and higher lows.
The arc-shaped pink trendline tracks this momentum shift — and we’re now watching a potential continuation of the bullish cycle.
The most recent HL is forming exactly on that curve — a critical moment where bulls may step in for the next impulsive move.
🔥 What’s Fueling the Shift?
SEI is gaining traction as a high-performance Layer 1 designed for trading apps, with native parallelization and a focus on speed and throughput.
Its recent ecosystem growth — including projects in DeFi, gaming, and infrastructure — has started to attract both retail and VC attention.
On-chain metrics are showing increased activity, and whispers of upcoming protocol incentives could be the spark that pushes SEI toward the $0.45–$0.50 range.
🧠 What We’re Watching
- The current HL zone — will bulls defend this level?
- If SEI can break above the previous HH, the bullish structure strengthens.
- A failure to hold this HL would suggest a range or even deeper correction — so risk management is key.
Let’s recap:
- Structure has flipped bullish ✅
- SEI is riding a fresh higher low ✅
- Fundamental momentum is building behind the scenes ✅
It’s now up to the market to decide if this was just a bounce — or the beginning of a much bigger move.
💬 What do YOU think: Is SEI building steam for a breakout, or just teasing us with a fakeout?
🔔 Disclaimer: This analysis is for educational and informational purposes only. It does not constitute financial advice or a recommendation to buy or sell any asset. Always do your own research and manage your risk accordingly.
📚 Always follow your trading plan => including entry, risk management, and trade execution.
Good luck!
All strategies are good, if managed properly.
~ Richard Nasr
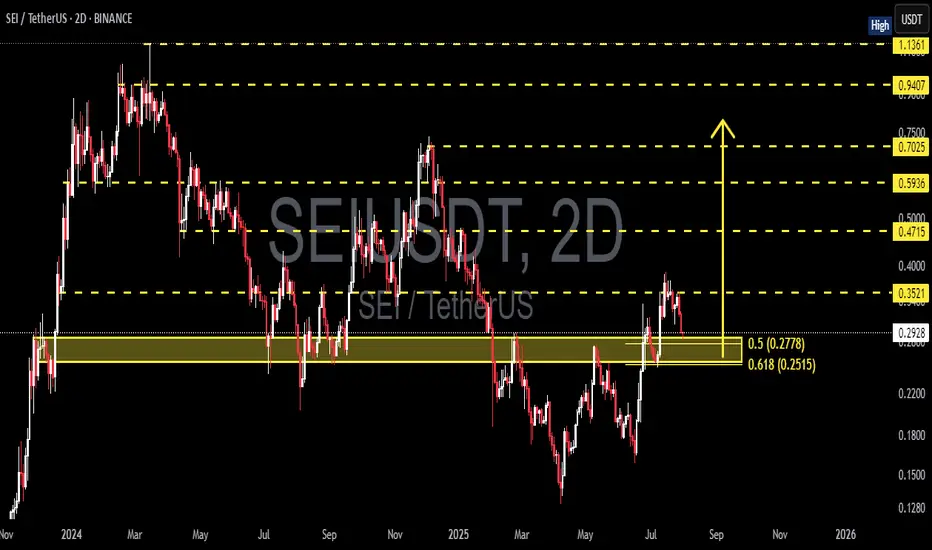
SEI/USDT at a Critical Level Golden Pocket Reaction Will Define?🔍 Technical Analysis:
1. Market Structure:
SEI/USDT is in a recovery phase after a significant downtrend.
Price is currently testing a crucial area between the Fibonacci retracement levels of 0.5 (0.2778) and 0.618 (0.2515) — known as the Golden Pocket Zone.
2. Key Support & Resistance Levels:
Strong support lies within the highlighted yellow zone (0.2515 – 0.2778), a historical support-resistance flip level.
Key resistance levels to watch:
🔸 0.3521
🔸 0.4715
🔸 0.5936
🔸 0.7025
🔸 0.9407
🔸 1.1361
---
📈 Bullish Scenario:
If price holds above the golden pocket:
A strong rebound is likely, forming a higher low structure.
Bullish confirmation occurs if price breaks and closes above 0.3521 with strong volume.
Upside targets: 0.4715 → 0.5936 → 0.7025 in sequence.
🔹 Additional Confirmation: Bullish reversal patterns (e.g., bullish engulfing or pinbar) around 0.25–0.28 would strengthen the bullish outlook.
---
📉 Bearish Scenario:
If the price breaks below the 0.2515 level:
It could trigger a deeper move toward 0.22 – 0.18 support area.
Further breakdown may bring price below the psychological level of 0.15.
🔻 Bearish confirmation if the price gets rejected from the 0.30–0.35 region with strong bearish candles.
---
📊 Pattern Insight:
Potential Double Bottom formation near the golden pocket zone.
A break above the 0.3521 neckline would validate this bullish reversal pattern.
---
🔖 Conclusion:
This zone (0.25–0.28) is a make-or-break area for SEI. A strong reaction from this golden pocket will determine whether SEI is ready to rally further or fall to new lows.
#SEI #SEIUSDT #CryptoAnalysis #AltcoinUpdate #TechnicalAnalysis #Fibonacci #SupportResistance #GoldenPocket #CryptoTrading #SEIpriceprediction
SEI : The best future belongs to this coin.Hello friends🙌
Given the rapid growth that this coin has had and I think it will continue, now that the price is correcting, there is a good opportunity to buy in stages with risk and capital management and move with it to the specified goals.
🔥Follow us for more signals🔥
*Trade safely with us*
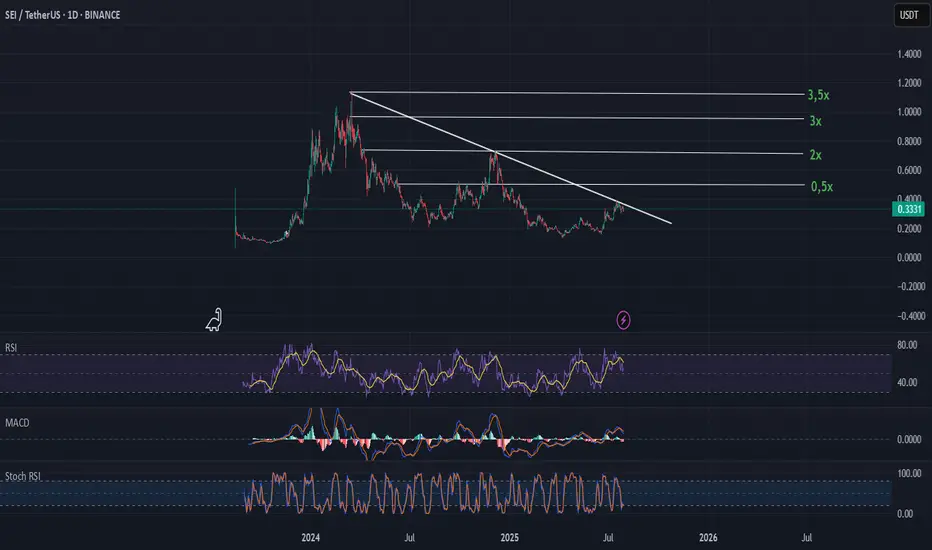
SEI $0.33 back to ath?SEI since December bearish momentum to June.
Around June the bullish momentum started.
We´re looking for NYSE:SEI to continue and break through support at $0.34.
Macd = Avg Bullish
Rsi = Avg Bullish
Stoch Rsi = Bullish
If this zone holds, the risk/reward setup favors bulls with clear upside targets.
Chart is based on rsi, macd, stoch rsi
#crypto #cryptocurrency #altcoins
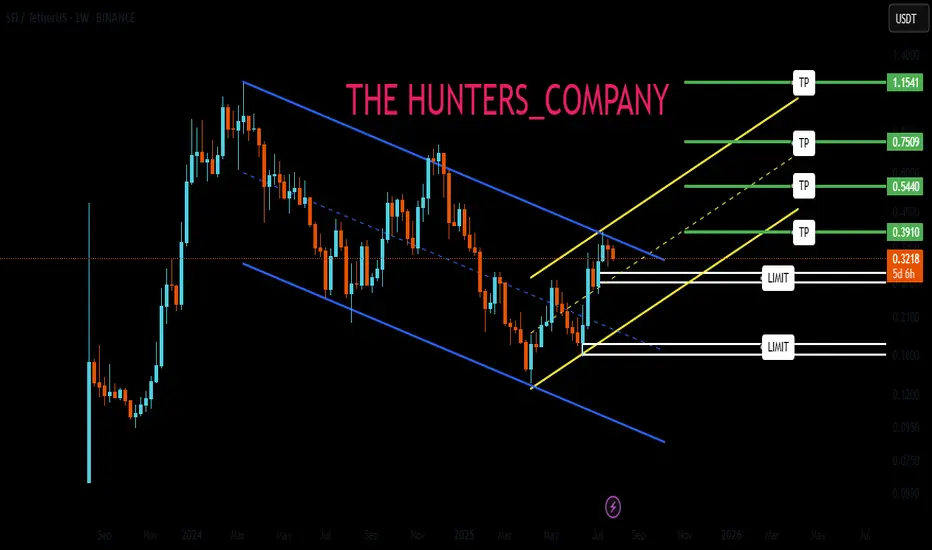
#SEIUSDT – Testing Resistance with Eyes on Breakout SEI is currently approaching a major descending trendline resistance after reclaiming the key weekly support zone around $0.20–$0.31. Price action is showing strength with a potential reversal setup building.
🔹 Key Technical Levels:
🔽 Support: $0.20–$0.31 (reclaimed zone)
📉 Resistance: Descending trendline from previous highs
🎯 Target 1: $0.5571
🎯 Target 2: $0.9109
🛑 Invalidation: Break below $0.1165 (risk zone)
📌 Technical Outlook:
Bullish structure forming above a long-held support
A breakout from the trendline could initiate a strong leg upward
Risk-to-reward remains favorable for mid-term swing setups
Watch for volume confirmation if SEI closes above the trendline. Momentum may accelerate toward the targets with bullish follow-through.
SEI — Breakout & D1 OB Target1. Support 0.33–0.36 holding
2. Entry after SR breakout
3. Target: D1 OB 0.47–0.54
4. Stop below 0.33

SEI BUY LIMITHello friends🙌
📉According to the downward trend we had, you can see that a reversal pattern was formed at the specified support and buyers entered and raised the price, which caused the formation of an ascending channel.
👀Now that we are at the ceiling of the ascending channel, because there is a possibility of price correction, we will place two more buying steps down and buy with risk and capital management and move with it to the specified targets.
🔥Follow us for more signals🔥
*Trade safely with us*
$SEI Bullish flag targets between $3.5 & $6.5 (X10 from here)Bullish flag, targets based on bullish flag and fibo

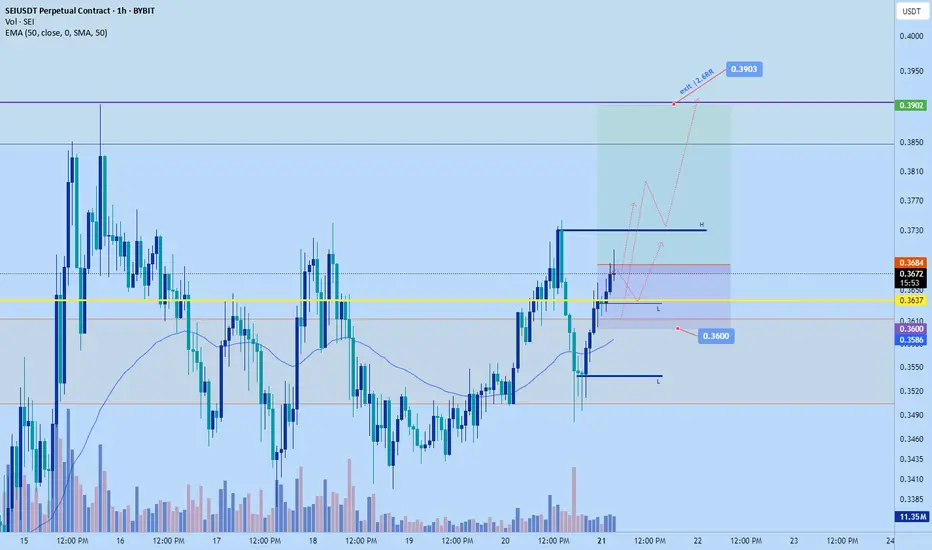
Seiusdt longWent long on sei just now. Aiming for $0.3903
Overall market is having a big bounce from weekend sell of including sei. I think the market will push and attempt to make a new HH based on my DTT analysis. Entry should have been a bit earlier but I just saw it.
SL: 0.36 or lower
Tp: 0.385-$0.39
It might correct down a bit again but base on my calculation $0.36 likely won't be revisited for now
#SEI/USDT The best future belongs to this coin.#SEI
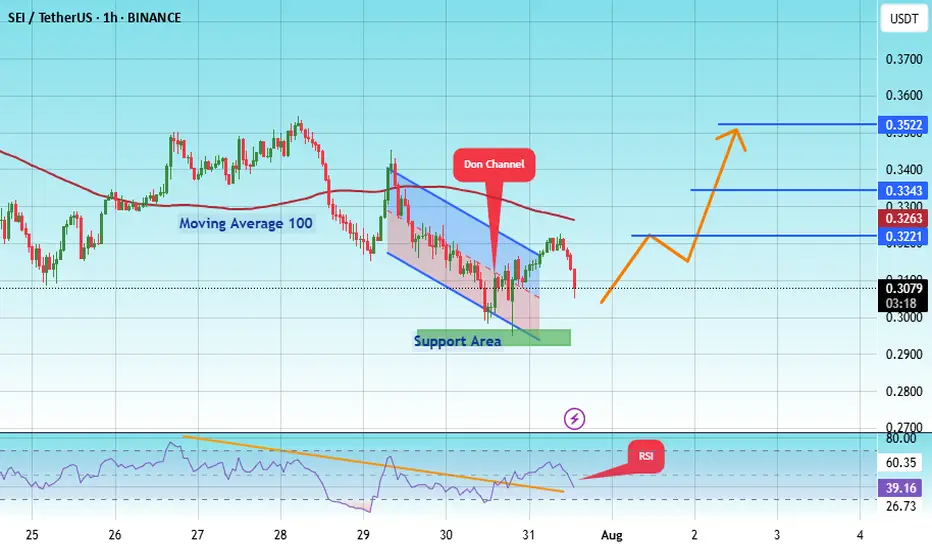
The price is moving within an ascending channel on the 1-hour frame, adhering well to it, and is on track to break it strongly upwards and retest it.
We have support from the lower boundary of the ascending channel, at 0.2967.
We have a downtrend on the RSI indicator that is about to break and retest, supporting the upside.
There is a major support area in green at 0.2950, which represents a strong basis for the upside.
Don't forget a simple thing: ease and capital.
When you reach the first target, save some money and then change your stop-loss order to an entry order.
For inquiries, please leave a comment.
We have a trend to hold above the 100 Moving Average.
Entry price: 0.3080.
First target: 0.3221.
Second target: 0.3343.
Third target: 0.3522.
Don't forget a simple thing: ease and capital.
When you reach your first target, save some money and then change your stop-loss order to an entry order.
For inquiries, please leave a comment.
Thank you.
SEI | Setup: Sweep & Reclaim Scenario:Wait for a sweep of the range low (RL) into the Daily FVG (gray box).
Look for a reclaim of RL as the trigger for a long.
Reasoning:
Sweep into FVG traps late sellers and sets up liquidity for a reversal.
Reclaiming RL after the sweep signals strength and confirms a local bottom.
No need to chase entries—best R:R is after liquidity is cleared and level is retaken.

SEI LIVE TRADEHello friends🙌
🔊As you can see, the upward trend has started, and the power is in the hands of buyers, and here we have an opportunity to enter a buy trade with risk and capital management to move towards the specified target.
🔥Follow us for more signals🔥
*Trade safely with us*
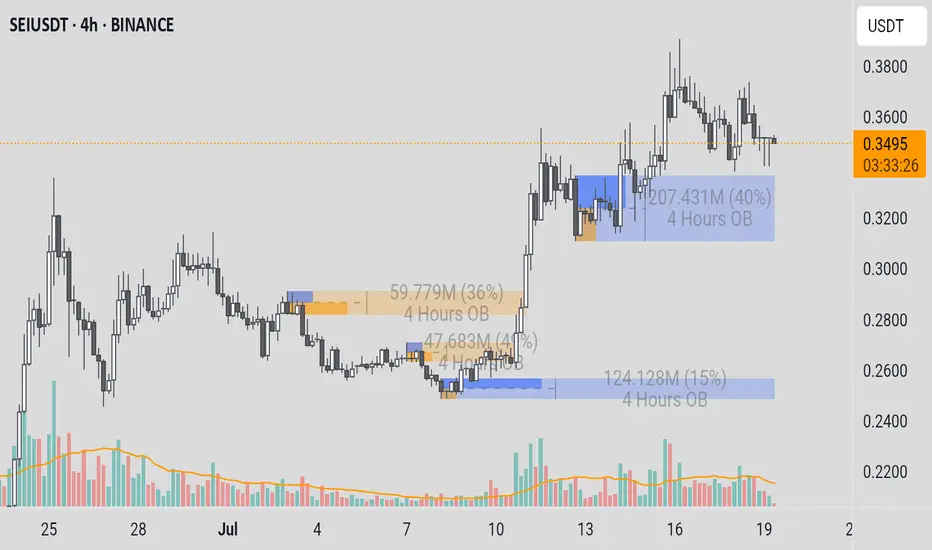
SEIUSDTSEI/USDT (SEI):
○ Trend: Strong uptrend.
○ Current Condition: Price is consolidating around $0.35, above strong Order Block support ($0.30-$0.32), but below the previous high ($0.37-$0.38). Volume appears to be decreasing during the consolidation phase.
○ Entry Recommendation: Not optimal for entry at this time. It is better to wait for a correction to Order Block support at $0.30-$0.32 and seek bullish confirmation for a safer entry, or wait for a clear breakout above $0.37-$0.38 with convincing volume.
SEI | Trade-updateWe’ve almost reached our final profit target (orange). Once we get there, I’ll take out most of my margin position and let only a small portion run.
Same situation as with $ADA...
13 R/R since my call — you don’t need a strategy with an 80% win rate. A 30–50% win rate is more than enough if your risk-to-reward ratio is solid.
I don’t think any of you have taken trades based on my calls yet, but maybe in the future idk.
I’ll keep posting from time to time. Maybe I’ll get more motivated and post more often. We’ll see.
As always: don’t get FOMO now when prices are green. The time to go long was a month ago — now it’s time to hit the red button.
And thanks to @cemainickam i see that atleast one person is reading my posts. Thank you bro!
cheers, stay safe❤️
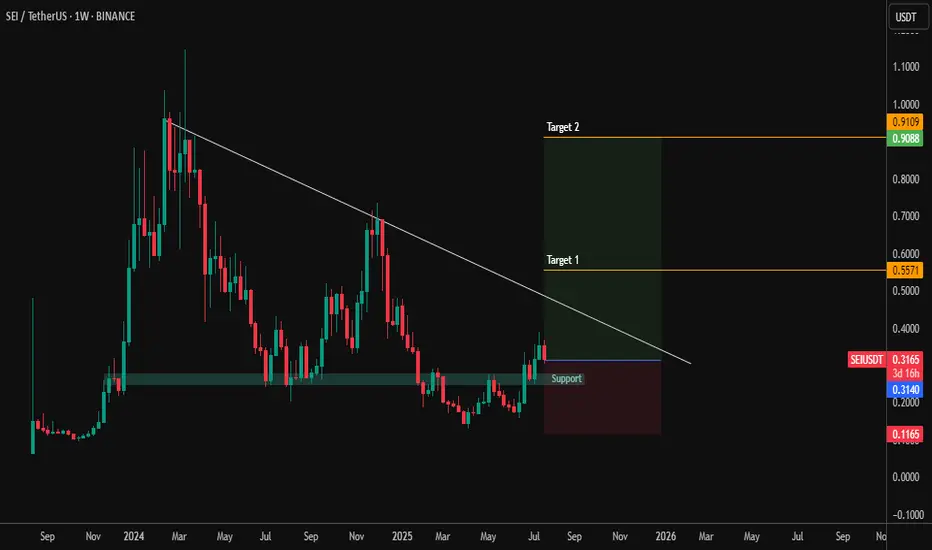
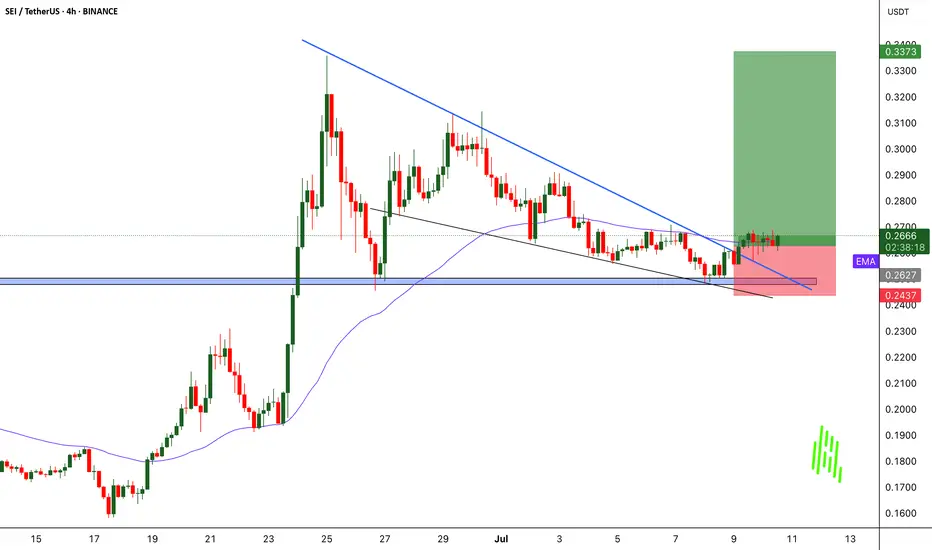
SEIUSDT Rebounds from Key Support - Pump Loading?BINANCE:SEIUSDT Rebounds from Key Support - Pump Loading?
BINANCE:SEIUSDT just touched a major support level on the 4H chart and is now showing signs of a bullish reversal after breaking above the descending trendline. This setup looks similar to previous price actions where NYSE:SEI delivered sudden explosive moves post-breakout. If history repeats, we could be looking at another strong rally ahead.
Entry looks promising, but as always, manage your risk wisely and set a proper stop loss to protect your capital.
BINANCE:SEIUSDT Currently trading at 0.265
Buy level : Above $0.263
Stop loss : Below $0.243
Target : $0.337
Max leverage 5x
Always keep stop loss
Follow Our Tradingview Account for More Technical Analysis Updates, | Like, Share and Comment Your thoughts
#SEI/USDT#SEI
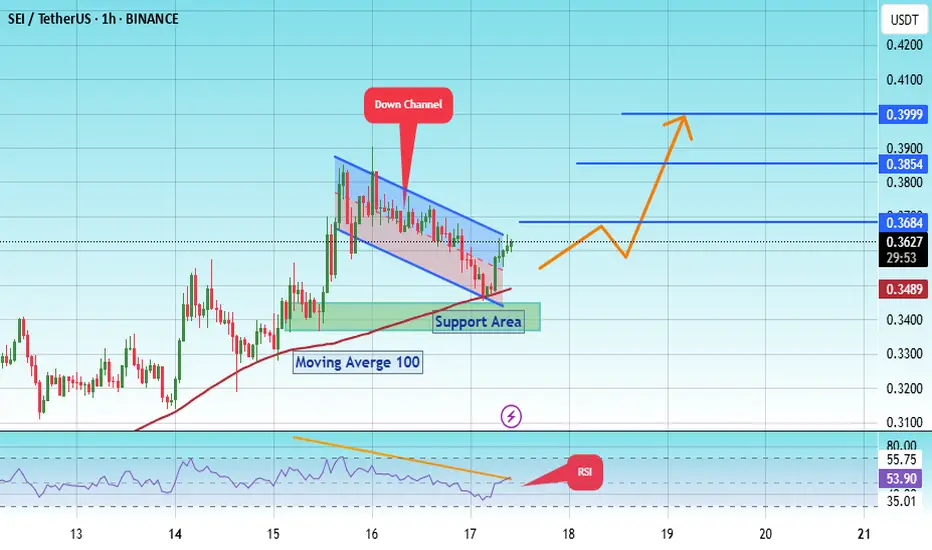
The price is moving within a descending channel on the 1-hour frame, adhering well to it, and is on its way to breaking strongly upwards and retesting it.
We have support from the lower boundary of the descending channel at 0.3450.
We have a downtrend on the RSI indicator that is about to break and retest, supporting the upside.
There is a major support area in green at 0.3380, which represents a strong basis for the upside.
Don't forget a simple thing: ease and capital.
When you reach the first target, save some money and then change your stop-loss order to an entry order.
For inquiries, please leave a comment.
We have a trend to hold above the 100 Moving Average.
Entry price: 0.3580
First target: 0.3684
Second target: 0.3850
Third target: 0.4016
Don't forget a simple thing: ease and capital.
When you reach your first target, save some money and then change your stop-loss order to an entry order.
For inquiries, please leave a comment.
Thank you.
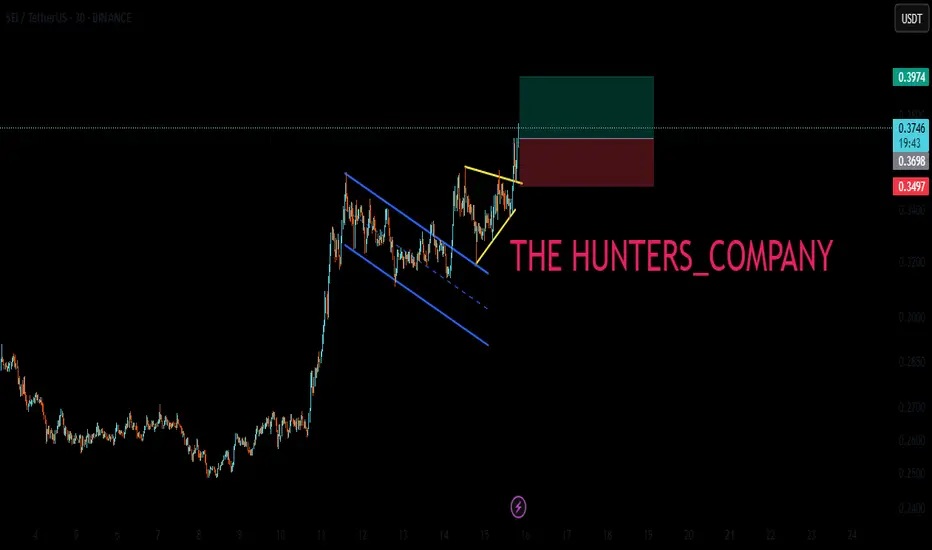
Sei Analysis – July 15, 2025
Sei appears to be forming a clear classic corrective pattern.
After rallying from $0.09 to $1.10,
it seems to have completed its correction through two downward legs.
🔁 The recent price action shows a bullish reaction near the previous low,
suggesting that Sei might now be in a strong accumulation zone.
📌 For a more conservative entry, waiting for price to approach $0.25 could provide a better risk/reward setup.
🎯 With a confirmed rebound, a move toward the $1.12 level — roughly a 300% gain — becomes a realistic target.
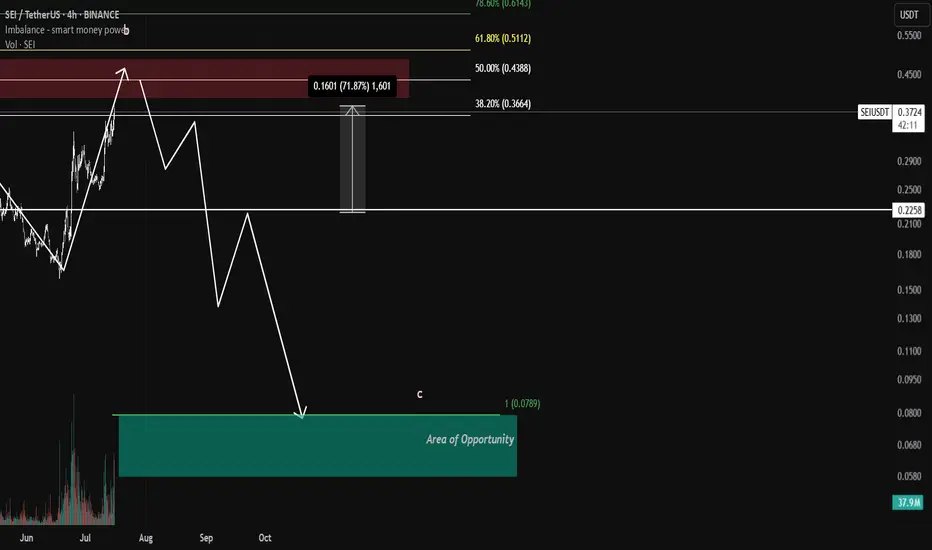
sei update Sei has pumped around 70% since i gave the trade and it's very close to reaching the wave B target Traders can book profits around 0.44$ this is 3 wave move to the upside then I expect a Wave c that will be five waves down movement pushing the coin to 0.07$ area
SEI go higherSei
Sei Network is an L1 blockchain with a built-in on-chain orderbook that allows smart contracts access to shared liquidity
Everything is clear on the chart.
It's time to fly.
I wish everyone abundant profits.
Like and follow
for more.