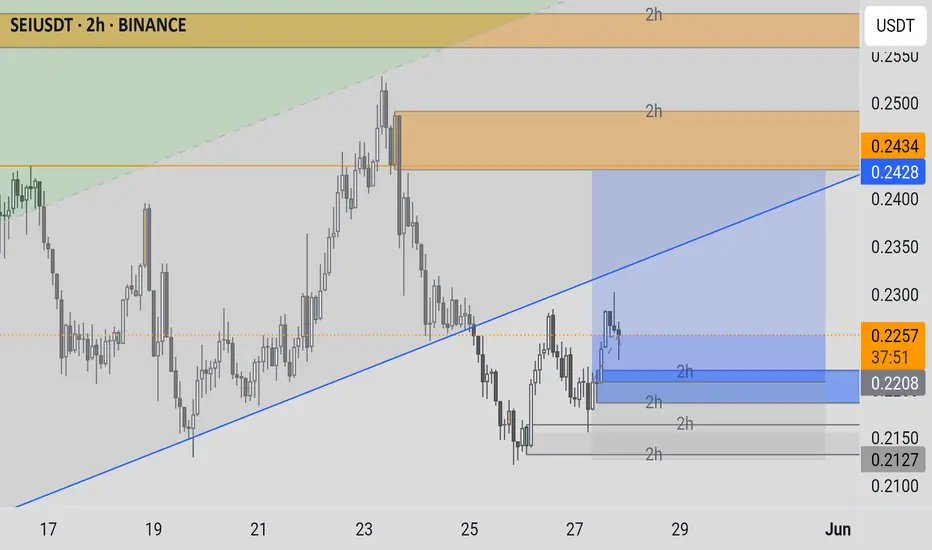
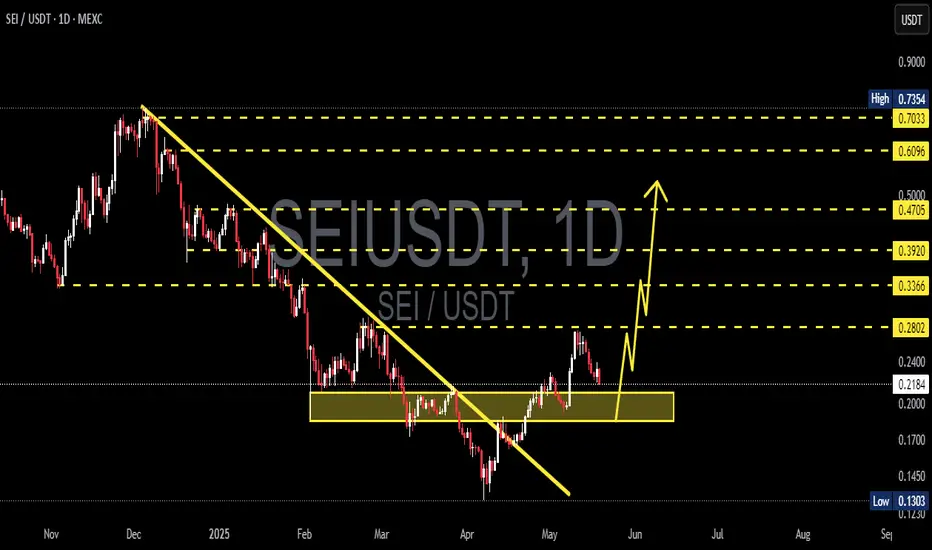
SEIUSDT - MEH!Hello everyone. I'm closely monitoring SEIUSDT, and I've observed significant activity in this asset: buyers have entered the market. This is a situation that demands close attention, as it carries the potential to shift the market's trajectory.
Our current focus is the blue box I've marked on the chart. This area currently presents itself as a resistance level. However, if buyers continue to strengthen and decisively break this blue box upwards, that's when a real opportunity could emerge. In such a scenario, following the breakout, I'll be looking for a retest on a low timeframe (LTF). If the price confirms this broken level as support, that will be a strong long position signal for me. This is one of those moments where the market is telling you, "I'm here."
When evaluating this scenario, I won't, of course, rely solely on price action. I'll be closely examining the volume footprint; understanding the true strength and intent of buyers is crucial. At the same time, I won't overlook CDV (Cumulative Delta Volume) divergences, as these can reveal hidden shifts in momentum. Sudden increases in volume, as always, act as a magnet for me; because, as you know, I only trade coins that are showing a sudden spike in volume. This is one of the secrets the market whispers to you.
However, as always, the market is two-sided, and we must remain flexible. If buyers fail to break this blue box and we see decisive downward breakouts on the daily timeframe, this could also present a potential scenario for a short attempt. Remember, the market can act independently of our expectations, and as a trader with one of the highest win rates, I always move according to the direction the market shows us.
We must also be vigilant against potential liquidity hunts at these levels. Price briefly pushing above the blue box and then rapidly falling back, or dipping below and then recovering, could be manipulations designed to shake out weaker hands. Failed breakouts or the regaining of lost levels will also provide us with valuable information.
Don't be surprised to see significant movements in SEIUSDT in the coming days. You might regret missing this setup, as most traders overlook these nuances at this level. Stay tuned, and let's decipher what the market is whispering together. You can trust my perspective.
📌I keep my charts clean and simple because I believe clarity leads to better decisions.
📌My approach is built on years of experience and a solid track record. I don’t claim to know it all but I’m confident in my ability to spot high-probability setups.
📌If you would like to learn how to use the heatmap, cumulative volume delta and volume footprint techniques that I use below to determine very accurate demand regions, you can send me a private message. I help anyone who wants it completely free of charge.
🔑I have a long list of my proven technique below:
🎯 ZENUSDT.P: Patience & Profitability | %230 Reaction from the Sniper Entry
🐶 DOGEUSDT.P: Next Move
🎨 RENDERUSDT.P: Opportunity of the Month
💎 ETHUSDT.P: Where to Retrace
🟢 BNBUSDT.P: Potential Surge
📊 BTC Dominance: Reaction Zone
🌊 WAVESUSDT.P: Demand Zone Potential
🟣 UNIUSDT.P: Long-Term Trade
🔵 XRPUSDT.P: Entry Zones
🔗 LINKUSDT.P: Follow The River
📈 BTCUSDT.P: Two Key Demand Zones
🟩 POLUSDT: Bullish Momentum
🌟 PENDLEUSDT.P: Where Opportunity Meets Precision
🔥 BTCUSDT.P: Liquidation of Highly Leveraged Longs
🌊 SOLUSDT.P: SOL's Dip - Your Opportunity
🐸 1000PEPEUSDT.P: Prime Bounce Zone Unlocked
🚀 ETHUSDT.P: Set to Explode - Don't Miss This Game Changer
🤖 IQUSDT: Smart Plan
⚡️ PONDUSDT: A Trade Not Taken Is Better Than a Losing One
💼 STMXUSDT: 2 Buying Areas
🐢 TURBOUSDT: Buy Zones and Buyer Presence
🌍 ICPUSDT.P: Massive Upside Potential | Check the Trade Update For Seeing Results
🟠 IDEXUSDT: Spot Buy Area | %26 Profit if You Trade with MSB
📌 USUALUSDT: Buyers Are Active + %70 Profit in Total
🌟 FORTHUSDT: Sniper Entry +%26 Reaction
🐳 QKCUSDT: Sniper Entry +%57 Reaction
📊 BTC.D: Retest of Key Area Highly Likely
📊 XNOUSDT %80 Reaction with a Simple Blue Box!
📊 BELUSDT Amazing %120 Reaction!
📊 Simple Red Box, Extraordinary Results
📊 TIAUSDT | Still No Buyers—Maintaining a Bearish Outlook
📊 OGNUSDT | One of Today’s Highest Volume Gainers – +32.44%
I stopped adding to the list because it's kinda tiring to add 5-10 charts in every move but you can check my profile and see that it goes on..
SEIUSDT trade ideas
#SEI/USDT#SEI
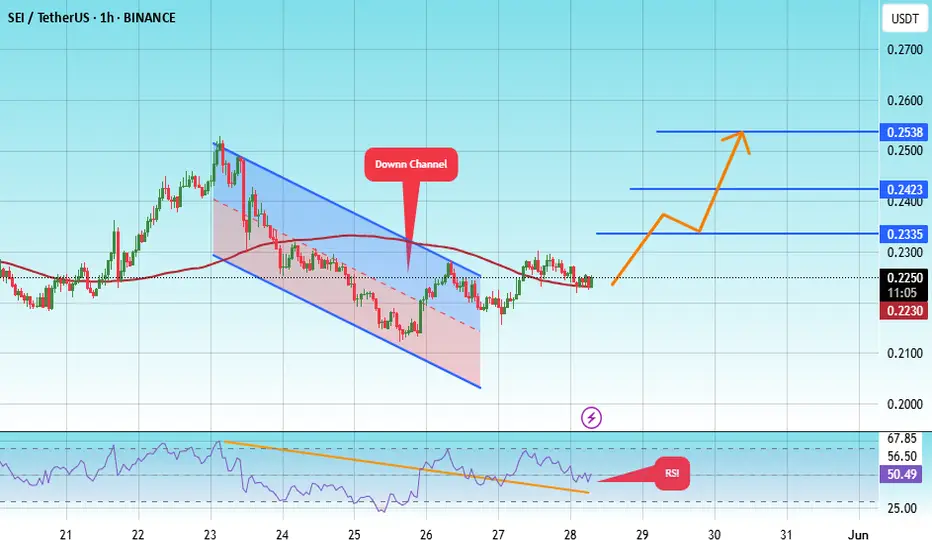
The price is moving within a descending channel on the 1-hour frame, adhering well to it, and is heading for a strong breakout and retest.
We are seeing a bounce from the lower boundary of the descending channel, which is support at 0.2095.
We have a downtrend on the RSI indicator that is about to break and retest, supporting the upward trend.
We are looking for stability above the 100 Moving Average.
Entry price: 0.2249
First target: 0.2423
Second target: 0.2423
Third target: 0.2538
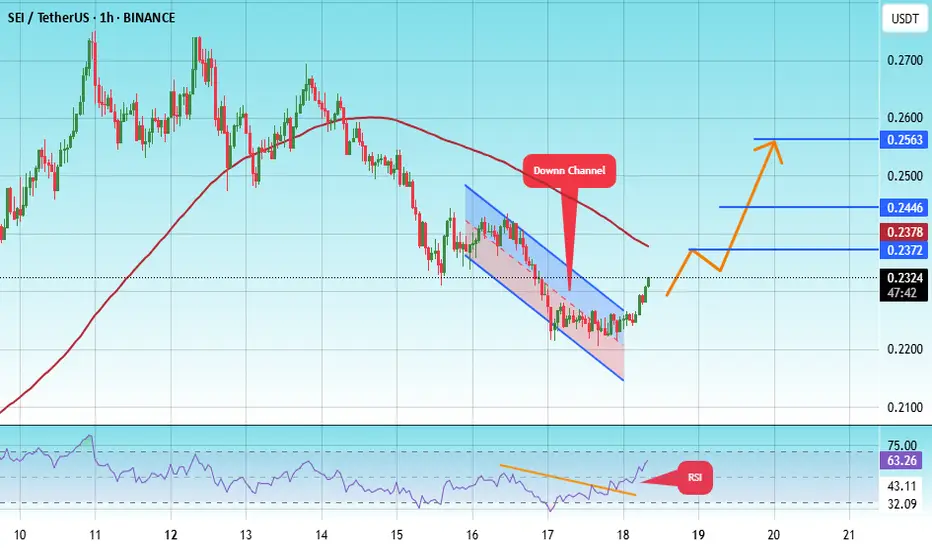
#SEI/USDT#SEI
The price is moving within a descending channel on the 1-hour frame, adhering well to it, and is on its way to breaking it strongly upwards and retesting it.
We are seeing a bounce from the lower boundary of the descending channel, which is support at 0.2170.
We have a downtrend on the RSI indicator that is about to break and retest, supporting the upward trend.
We are looking for stability above the 100 moving average.
Entry price: 0.2310
First target: 0.2372
Second target: 0.2446
Third target: 0.2563
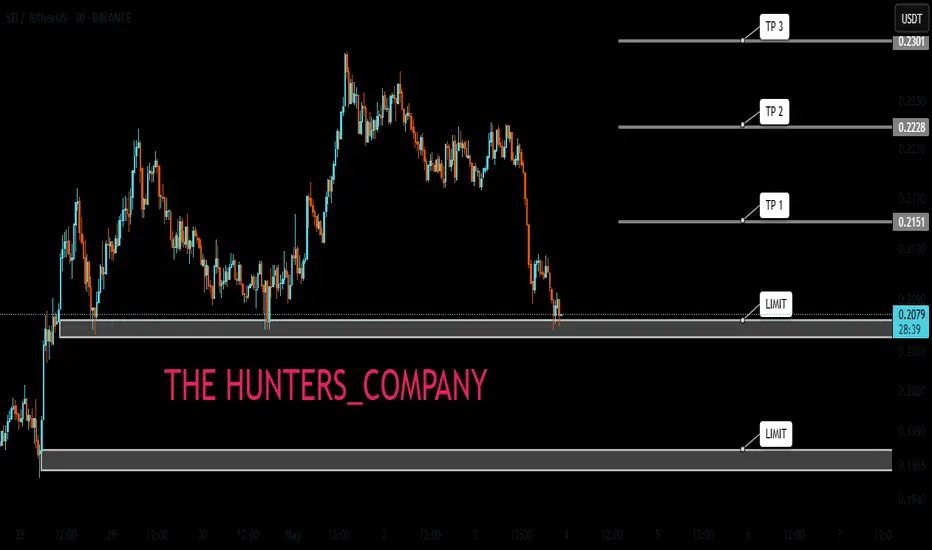
SEIUSDTset up long trade perp 📈
🚨🚨🚨Disclaimer on Money Management for Trading in the Futures :
MarketFutures trading carries high risks and may result in the loss of your entire capital. Only use funds you can afford to lose, set risk limits, and understand the market and leverage. Diversification does not guarantee profits. Consult a financial advisor before trading. All decisions and losses are your sole responsibility.
Sei short to $0.2161Recently entered a short position on sei. Its still good enough to get decent RR.
Expecting the market to fall back down this weekly before any further pump. The pump yesterday likely was the top of the move for the week for now and market seems more likely now to fall back lower to retest $0.2072 area to hopefully find strong enough demand to get a more sustainable pump
Sei longJust now opened up a long position on Sei.
Targeting $0.2316 area
Stop: $0.2192 or lower
Roughly 2RR trade.
Trend is currently bearish on 4hr tf. Anticipating that this move will continue pushing to the upside flipping the 4hr tf bullish around $0.2316

SEIUSDT LONG 1DBullish Trend
Entry on Trendline
Expecting bullish trend will continue
AB==CD extra confirmation
SEI LIVE TRADEHello friends
Given the decline we had, we expect to experience another decline and we can open a trade in the direction of the trend with capital and risk management.
*Trade safely with us*

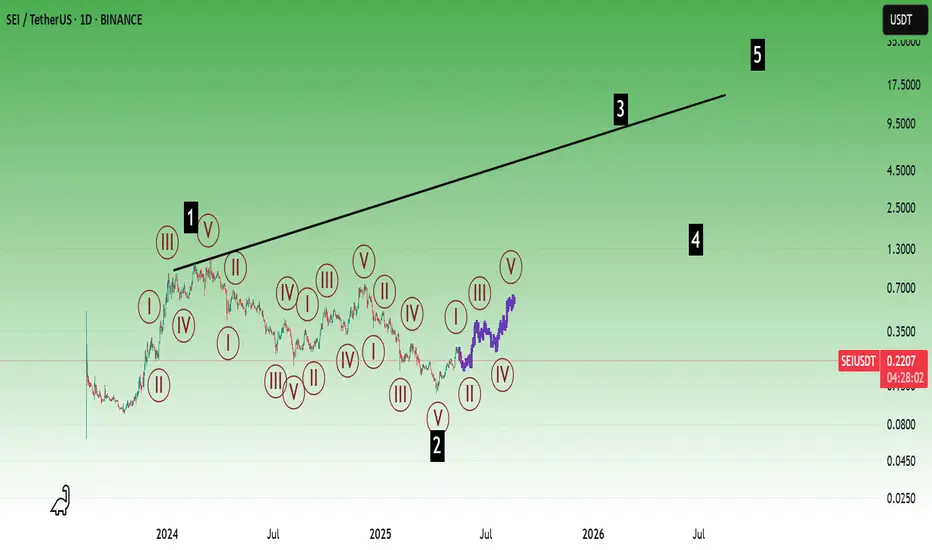
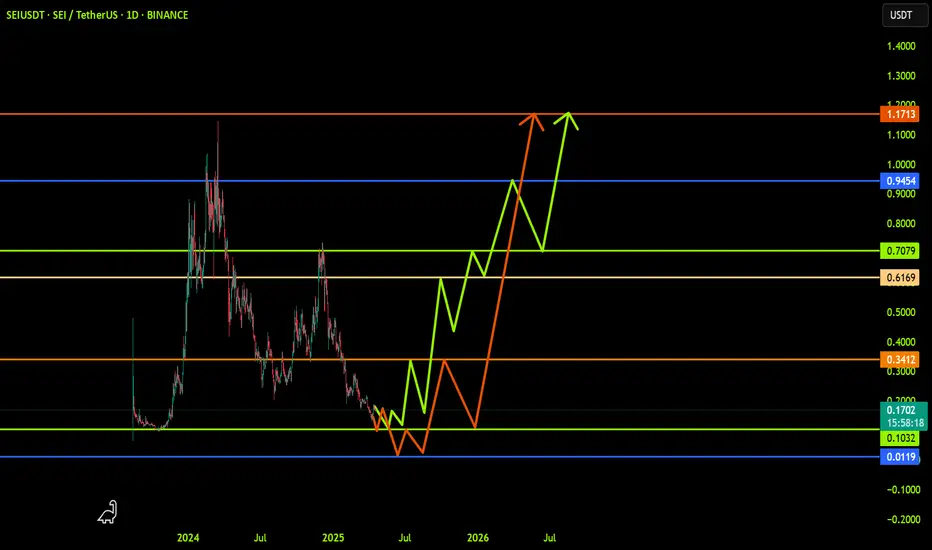
Sei long term.I expect it to reach 0.18 levels in the coming period, but before that, prices may approach 0.26 again. I expect the 3rd elliot wave to start between approximately 0.18 0.16 region.
* The purpose of my graphic drawings is purely educational.
* What i write here is not an investment advice. Please do your own research before investing in any asset.
* Never take my personal opinions as investment advice, you may lose your money.
SEIUSDT 1D AnalysisSEI ~ 1D Analysis
#SEI Buy gradually after retesting this support block with a short term target of at least 15%+ from here.
SEI LONG RESULTPrice Broke out of the Falling Wedge Pattern with Double Bottom reversal pattern and consistently holding Supports and creating HH & HL.
I Opened the first long setup which price missed by a few cents, then I initiated another long position from a newer held Support Above and it went smoothly as planned.😉
THE KLASSIC TRADER🎯
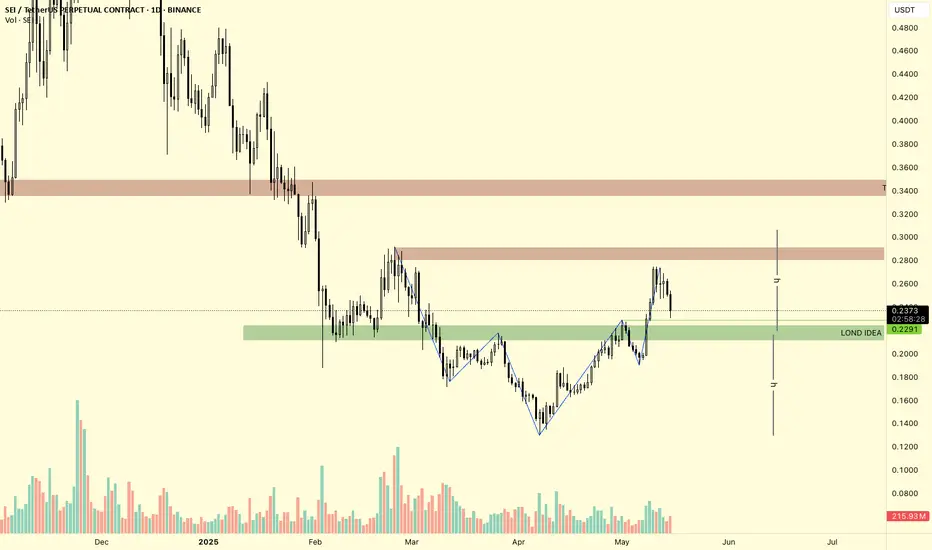
SEI/USDT Daily Chart Analysis – Potential Reversal ConfirmedThe SEI/USDT chart on the daily timeframe presents a notable Inverse Head and Shoulders (IH&S) pattern, which appears to have completed successfully. The neckline breakout occurred with a strong bullish impulse, suggesting a potential trend reversal from the prior downtrend.
Following the breakout, price encountered a significant resistance zone between $0.275 - $0.295, which acted as a supply area and triggered a short-term pullback. This level aligns with a previous structural breakdown point, adding to its validity as a resistance.
A key demand zone (highlighted in green), located between $0.195 - $0.229, has been marked as the “Long Idea” zone. This area previously served as resistance and now has the potential to flip into strong support upon retest, offering a favorable long entry if price revisits the zone. The current price action suggests that this retest may occur, offering an opportunity to enter with a better risk/reward ratio.
The measured move target from the IH&S pattern points towards the $0.35 region, which also coincides with a major horizontal resistance zone and serves as the primary take profit (TP) target.
#SEI/USDT#SEI
The price is moving within a descending channel on the 1-hour frame, adhering well to it, and is heading towards a strong breakout and retest.
We are seeing a bounce from the lower boundary of the descending channel, which is support at 0.2550.
We have a downtrend on the RSI indicator that is about to be broken and retested, which supports the upward trend.
We are looking for stability above the 100 Moving Average.
Entry price: 0.2579
First target: 0.2626
Second target: 0.2681
Third target: 0.2750

SEIUSDT: Trend in daily time frameWe have two trends, be careful
The color levels are very accurate levels of support and resistance in different time frames, and we have to wait for their reaction in these areas.
So, Please pay special attention to the very accurate trend, colored levels, and you must know that SETUP is very sensitive.
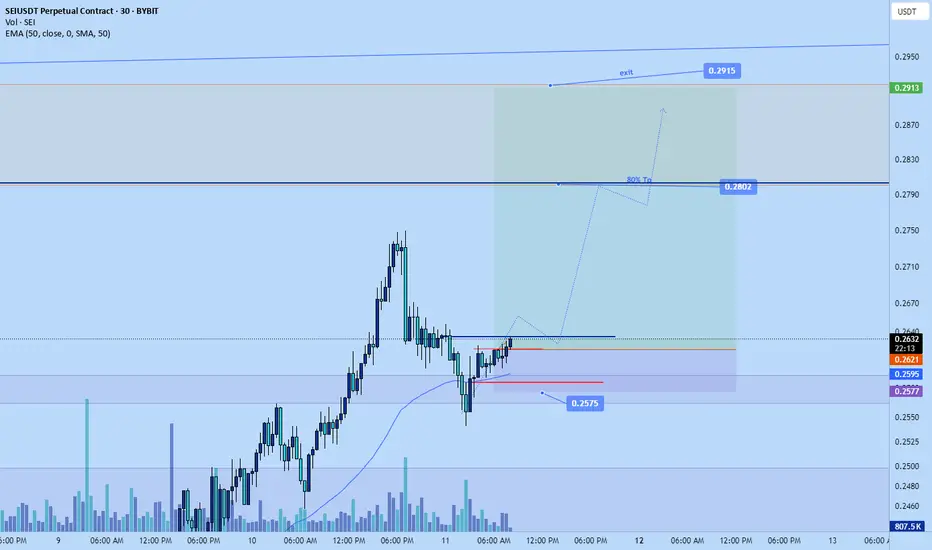
Sei long to $0.28+ today!NYSE:SEI long
🎯Target : $0.2802
🛑Stop: $0.2575 or lower
💰Roughly 4-6RR from my entry
#seiusdt
#SEIUSDT remains in bullish continuation mode📉 LONG BYBIT:SEIUSDT.P from $0.2747
🛡 Stop loss: $0.2640
🕒 Timeframe: 4H
✅ Market Overview:
➡️ Falling Wedge pattern has played out — confirmed breakout to the upside.
➡️ A strong Inverse Head and Shoulders pattern is visible — neckline broken with momentum.
➡️ Volume increases on upward impulse — bullish confirmation.
➡️ Current price is consolidating slightly — likely preparing for the next leg up.
➡️ POC at $0.1697 is far below — market structure flipped bullish.
➡️ Clear upward projection toward the $0.2810–$0.2910 range.
🎯 TP Targets:
💎 TP 1: $0.2810
💎 TP 2: $0.2870
💎 TP 3: $0.2910
📢 Holding above $0.2740 confirms bullish structure.
📢 Watch for minor resistance near TP1, then potential continuation to TP2 and TP3.
📢 Secure partial profits at TP1, and let the rest ride toward higher targets.
📢 It’s advisable to partially take profits near the specified resistance levels.
📢 A retest of the breakout zone (around $0.22) is possible — this can be used for adding to the position.
🚀 BYBIT:SEIUSDT.P remains in bullish continuation mode — targets still active!

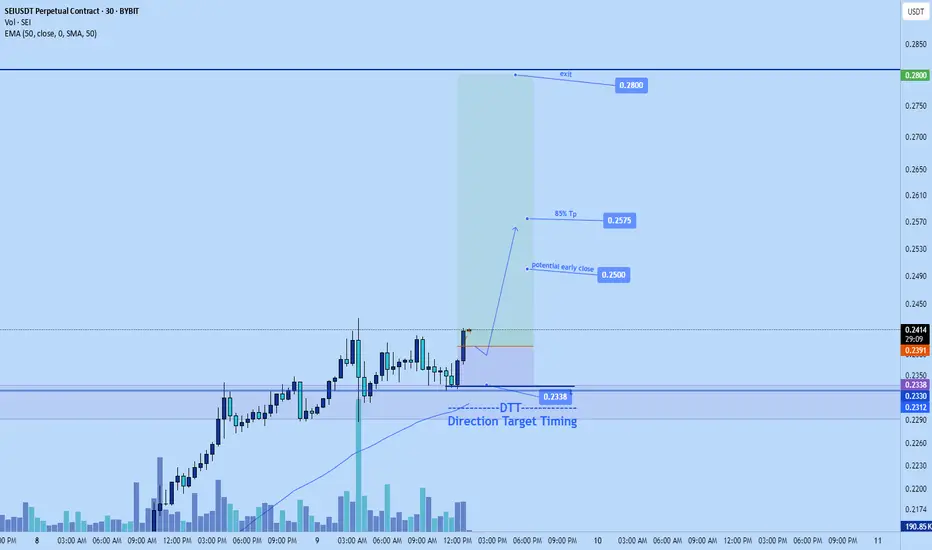
Sei bit pump to $0.28Just now entered a long position on Sei. Targeting 0.28
However, I'll be looking to close out most of the position at $0.2575 then afterwards depending on the PA I might scale back in. Also if no minor retest before $0.25 I might take partial there.
Stop: $0.2338 or lower
SEI iHnS PatternSEI potentially confirmed inverse HnS pattern with create another lower high and now sitting on resistance
break resistance we will see price around 0.29

SEIUSDT Breakout Holds Strong – Eyes on Key Higher Low FormationSEIUSDT has recently completed a significant technical breakout from a falling wedge pattern that had been compressing price for an extended period. This wedge was defined by a consistent sequence of lower highs and lower lows, suppressing bullish momentum and holding the market in a downtrend. The breakout above wedge resistance not only invalidated this structure but also confirmed a fresh higher high — a key signal that the trend dynamics may be shifting.
What makes this breakout technically significant is the structural transition it represents. For the first time in a while, buyers were able to overcome resistance and push price beyond the previous swing high. This break in the bearish sequence hints at a potential reversal, but a critical confirmation is still required.
The current focus is now on the formation of a higher low, ideally at the 0.618 Fibonacci retracement level, which aligns closely with the value area low (VAL) from the recent range. A successful retest and bounce from this zone would further solidify the bullish transition and establish the foundation for a potential move toward the upper boundary of the range.
If this structure plays out as anticipated, the next major target would be the range high resistance, offering a potential 80% upside from current prices. This level also coincides with previous supply zones and will be crucial to monitor for any signs of rejection or continuation.
Volume remains a critical element in this setup. The breakout occurred on improving volume, but follow-through volume will be necessary to validate the move. Bullish continuation without volume support often leads to failed breakouts or chop. A rise in volume during the retest and bounce would signal increased buyer interest and further support the case for upside continuation.
Summary:
SEIUSDT has flipped its bearish structure with a clean wedge breakout and higher high. The next step is confirming a higher low at the 0.618/VAL region. If successful, the probability for a move toward the range high increases significantly.
Technical Levels to Watch:
Support: 0.618 Fib & Value Area Low
Resistance: Range High
Volume: Needs to pick up for bullish continuation
Follow this post to stay updated on how this setup evolves.
This is not financial advice — always do your own research and manage your risk.

Sei short to $0.1991Just now opened a short position on sei. Targeting $0.1991.
Sell off seems likely . Around $0.1991 I anticipate enough demand might come back into the market to cause a reversal or consolidation

SEI LIMIT FOR BUYHello friends
Due to the price drop, we can buy on the drop within the specified limits and move with it to the specified targets, of course with capital and risk management.
*Trade safely with us*
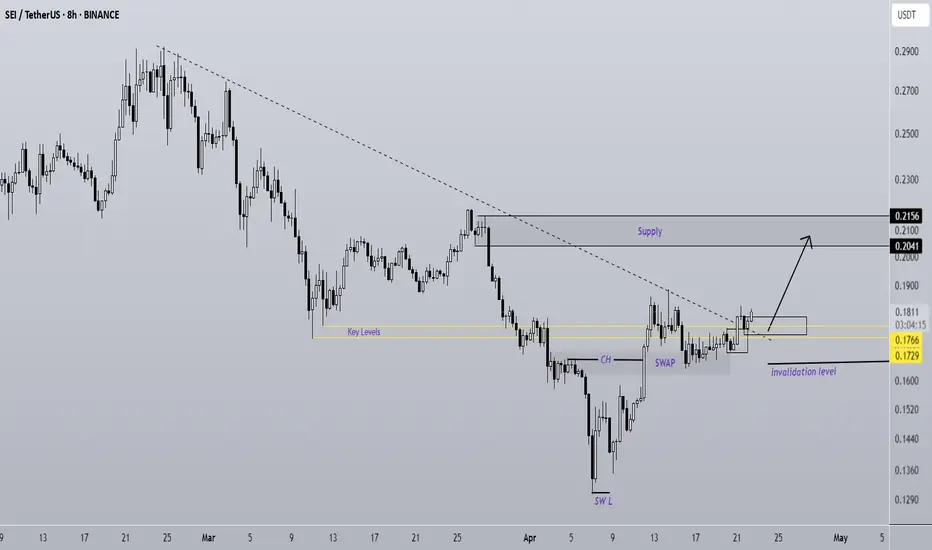
SEI Is A Rocket (8H)SEI has started a strong move from the bottom.
After breaking through a resistance zone with little to no reaction, it has now formed a SWAP zone.
Buy orders have been effectively transferred from the SWAP area into the candles, and the price shows strong momentum to push toward higher levels.
As long as the demand zone holds, SEI has the potential to reach the marked target area | or even go beyond it.
However, a daily candle closing below the invalidation level would invalidate this analysis.
Do not enter the position without capital management and stop setting
Comment if you have any questions
thank you