SEIUSDT UPDATEPattern : Falling Wedge Breakout
Current Price: $0.1839
Target Price: $0.3590
Target % Gain: 95.76%
Technical Analysis: SEI has broken out of a falling wedge pattern on the 1D chart, indicating potential reversal. The breakout is supported by increasing bullish momentum. A sustained close above resistance confirms the move.
Time Frame: 1D
SEIUST trade ideas

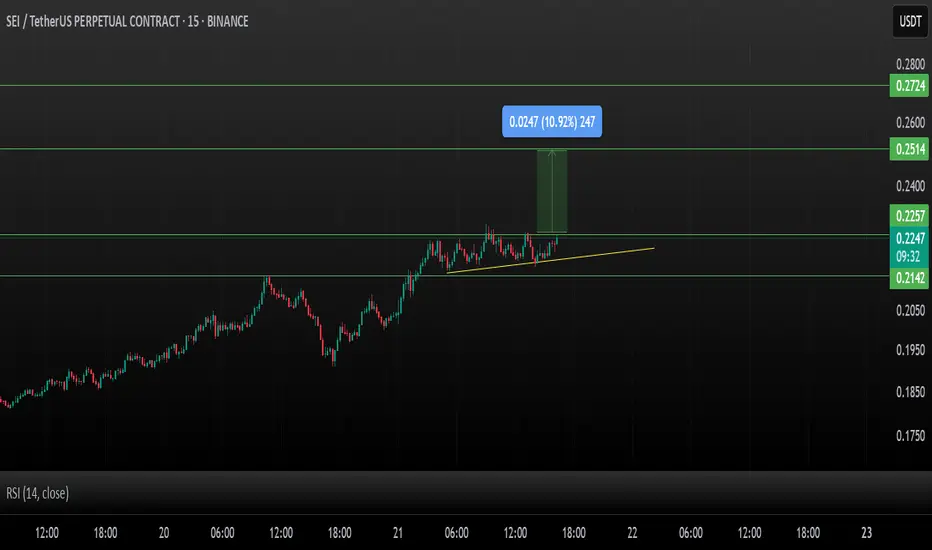
SEI/USDT – Bullish Breakout Setup!SEI consolidates in a classic ascending triangle, showing a strong structure with higher lows and flat resistance.
A breakout above ~$0.225 could trigger a move toward higher targets.
Key Levels:
Support: $0.2142 (triangle base)
Resistance: $0.2257 (breakout level)
Stoploss: Below $0.214 (invalidation of structure)
Targets on Breakout:
TP1: $0.2514
TP2: $0.2724
RSI is climbing from mid-range with a bullish crossover, indicating strengthening momentum.
Structure looks favorable as long as support holds. Wait for volume confirmation on breakout for higher probability.
Not financial advice. Do your own research before investing (DYOR).
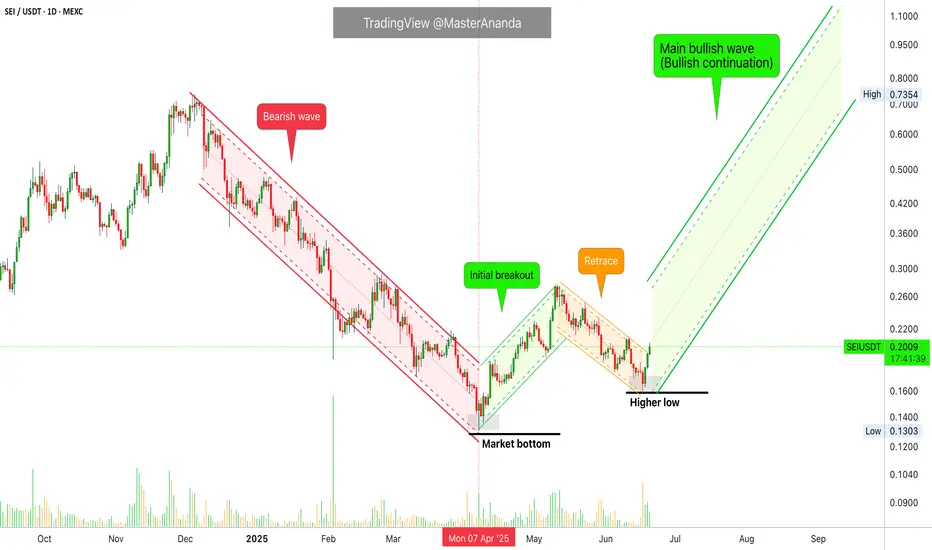
Sei Goes Bullish, Same Pattern & SequenceIt is the same price pattern and sequence. A bullish wave ends December 2024 and leads to a correction. The correction ends with a bottom 7-April. This bottom marks the start of a new phase, the bullish cycle. Recently, SEIUSDT produced a higher low and this higher low marks the start of the next advance, a bullish continuation.
Makes sense?
Bullish action already confirmed —The bigger picture
Today we have three green candles and the most bullish since the end of the initial bullish breakout. If you take this chart together with my other recent publications: COIN, ETH, DOGS, NOT and BCH, you can start to decipher the bigger picture. It is already confirmed.
A great opportunity
I am here to alert you of the event before it happens. Taking action now can be life changing or simply put, taking action now can translate into huge profits; the best possible entry after the 7-April low.
Don't worry, even if this opportunity gets away from you, the market will continue to produce countless more; endless opportunities the Cryptocurrency market has to offer for sure.
Thanks a lot for your continued support.
Namaste.
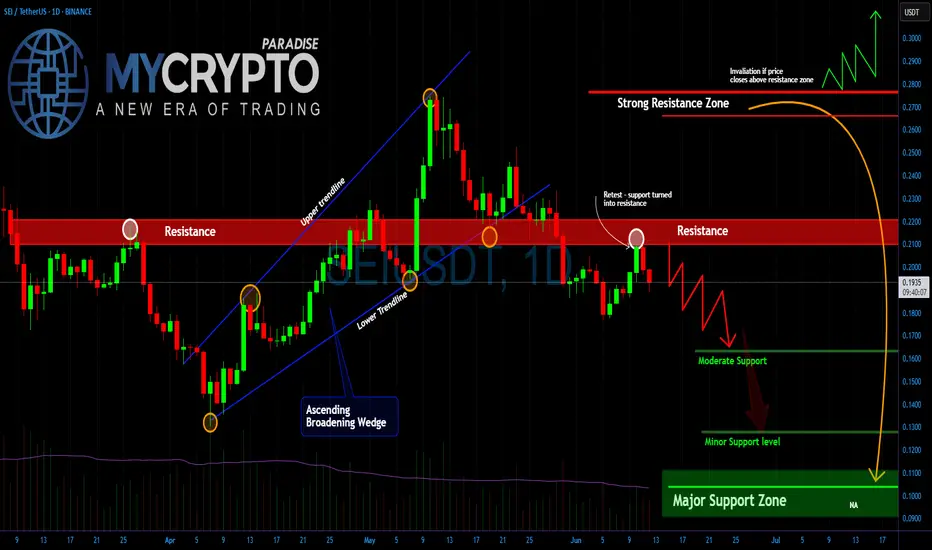
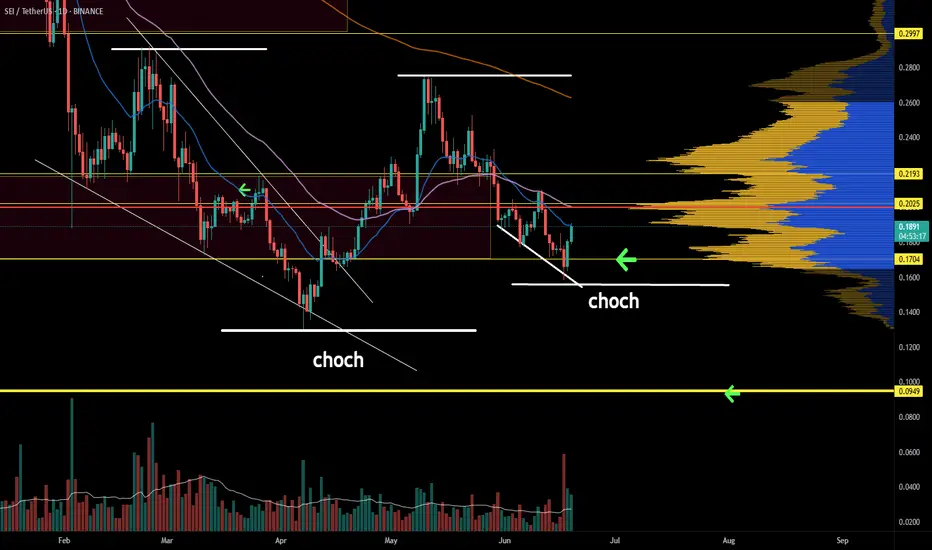
SEI Rebound or Final Trap?Yello Paradisers, have you considered that this little bounce might be the last trap before a brutal selloff? SEIUSDT is giving us strong signals that most retail traders are missing and if you’re not reading the structure clearly, you’re walking straight into a setup designed to clean you out.
💎The recent price action shows a clear rejection from the $0.22 level, which has now confirmed itself as a strong resistance zone. What’s more concerning is that this resistance rejection comes right after the price broke down from an Ascending Broadening Wedge. This is not a random pattern it’s a classic formation that tends to attract breakout buyers and then punishes them with aggressive downside moves once the structure fails.
💎Currently, the market is drifting just below that resistance, attempting weak bounces. However, there is a clear lack of bullish momentum. If this weakness persists, the next stop is around the $0.16 region, where moderate support is likely to be tested.
💎If sellers get aggressive, that level might not hold, and we could head lower into the $0.13 area still not where true value lies. The major support zone sits far below, around the psychological $0.10 level, and that’s where the real high-probability bounce setup is likely to occur.
MyCryptoParadise
iFeel the success🌴
SEI SELL SETUP ,Sold From $0.2210SEI SELL SETUP
Currently $0.2210
Sold From $0.2210
(Trading plan If SEI go up to $0.23
will add more shorts)
Expecting target $0.2124 OR DOWN
In the event of an early exit,
this analysis will be updated.
Its not a Financial advice

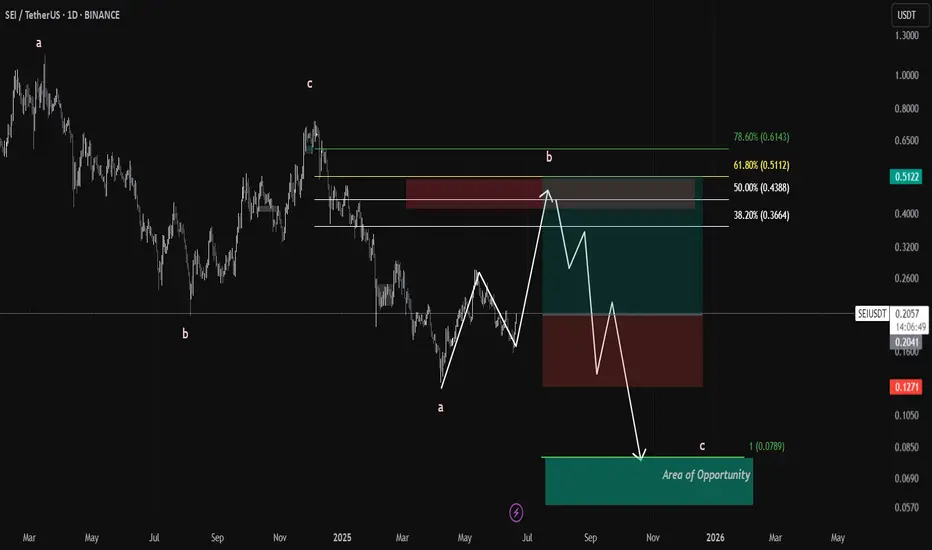
Sei trade plan SEI/USDT – Bearish Zigzag Correction In Play | Waiting for the Final Leg C
📉 Current Structure:
The chart displays a developing A-B-C zigzag correction.
Wave a is complete, and price is currently unfolding wave b, pushing into a key supply zone between 0.4388 – 0.5112 USDT.
This zone also aligns with major Fibonacci retracements:
🟡 50% at 0.4388 TP1
🟢 61.8% at 0.5112 TP 2
🔵 78.6% at 0.6143 (max deviation before invalidation) TP3 if given
traders can trade the wave b I have marked the entry and Sl it's a 4RR high probability setup
Targets for Wave C:
🎯 Primary Target (1.0 extension): 0.0789 USDT
SEI holds potential for a 300% gain!Hello Traders,
Today, we’ll analyze SEI on the weekly timeframe.
SEI is currently rebounding from its support trendline, and we may see a bullish rally of up to 300% if it breaks above the blue box, which ranges between $0.23 and $0.26. The price has dropped significantly from $1 to around $0.40, which could present a good opportunity—if accumulated in time.
On the bearish side, SEI must not fall below the green box ($0.13–$0.14). If it does, the price could drop as low as $0.06.
Note: Always do your own research and analysis before investing.
Regards,
Dexter
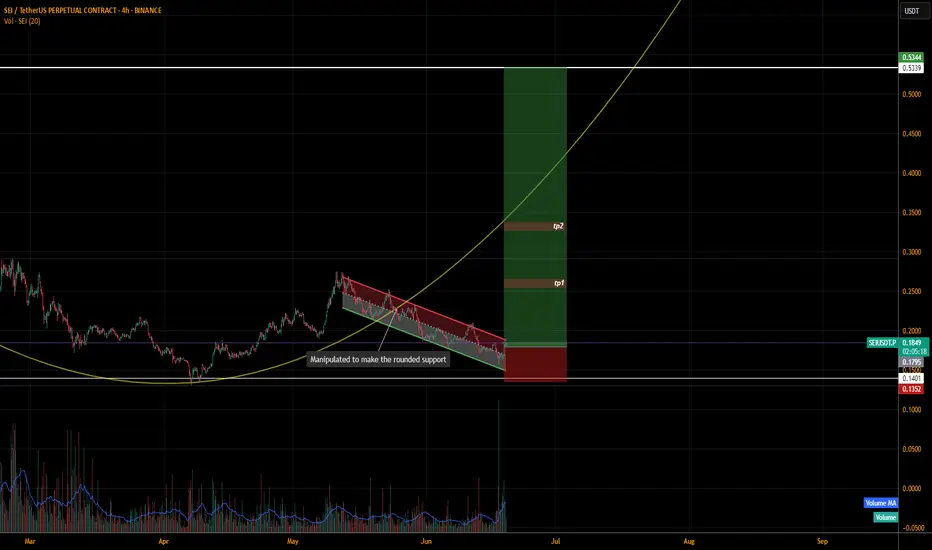
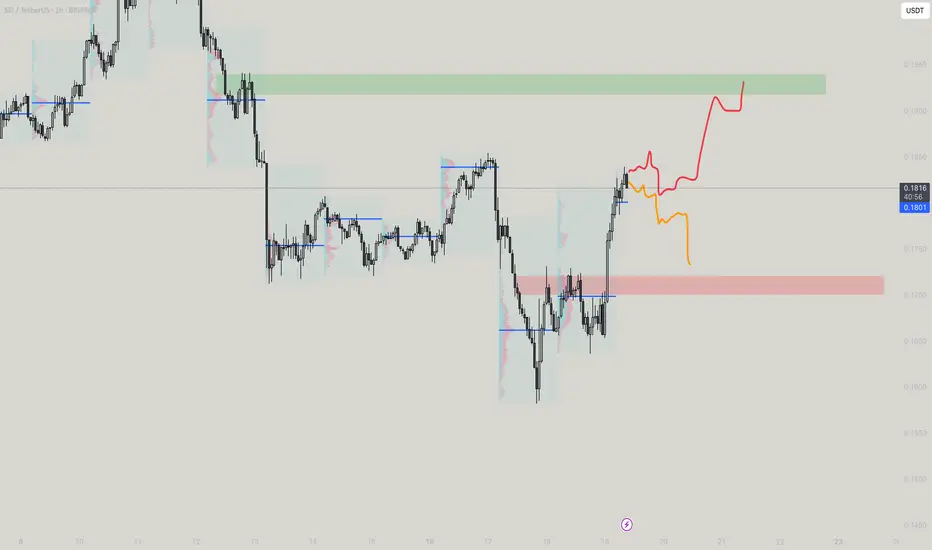
SEIUSDT.P LONGI think we got manipulated to make the rounding support.
The price is recovering nicely to enter in the rounded support.
We can long it now.
The market is very volatile due to geopolitical issues.
Only risk 1 or 2% of the capital.
The setups with the tps are mentioned
DYOR
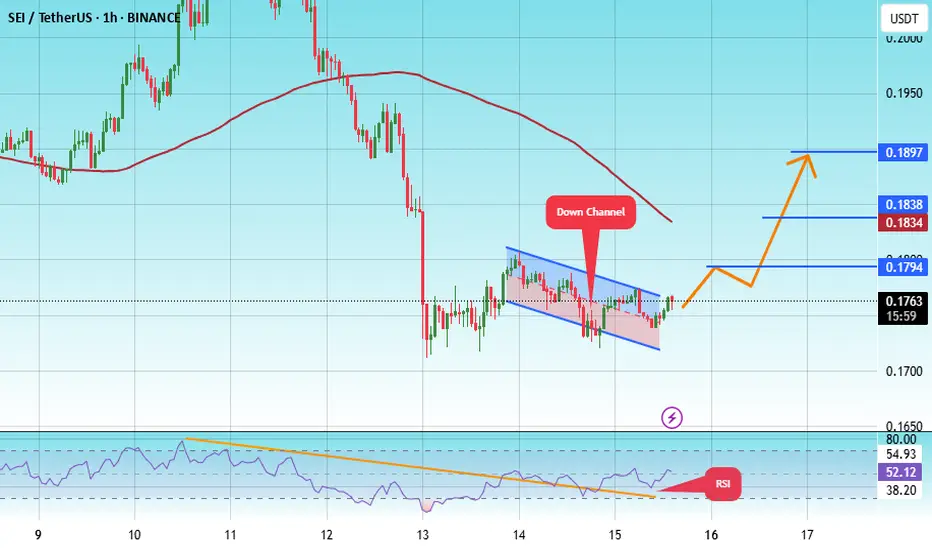
#SEI/USDT#SEI
The price is moving within a descending channel on the 1-hour frame, adhering well to it, and is heading for a strong breakout and retest.
We are experiencing a rebound from the lower boundary of the descending channel. This support is at 0.1725.
We are experiencing a downtrend on the RSI indicator, which is about to break and retest, supporting the upward trend.
We are heading for stability above the 100 Moving Average.
Entry price: 0.1766
First target: 0.1794
Second target: 0.1834
Third target: 0.1890
Live trade hello friends✋️
Considering the price drop, you can now see that we are in important support and now we can take advantage of this situation and enter into a transaction with risk and capital management.
🔥Follow us for more signals🔥
*Trade safely with us*
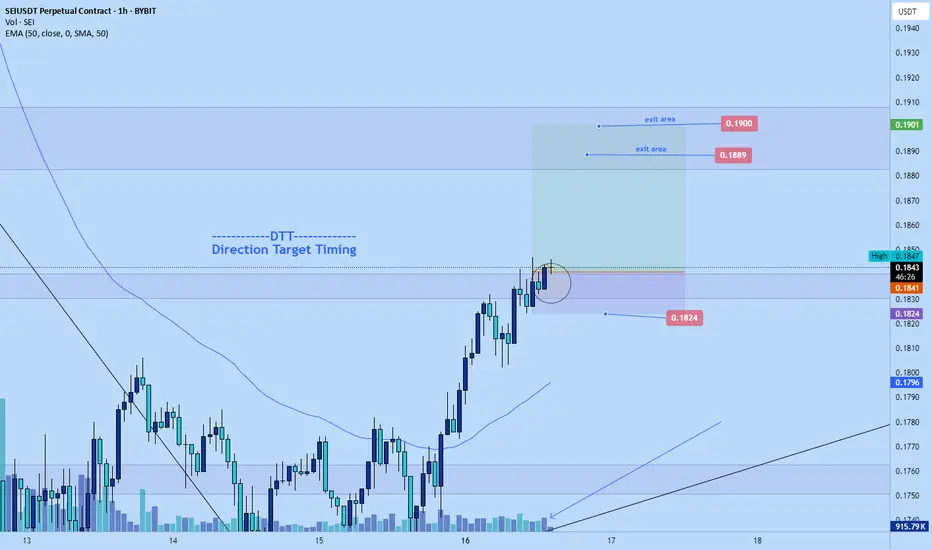
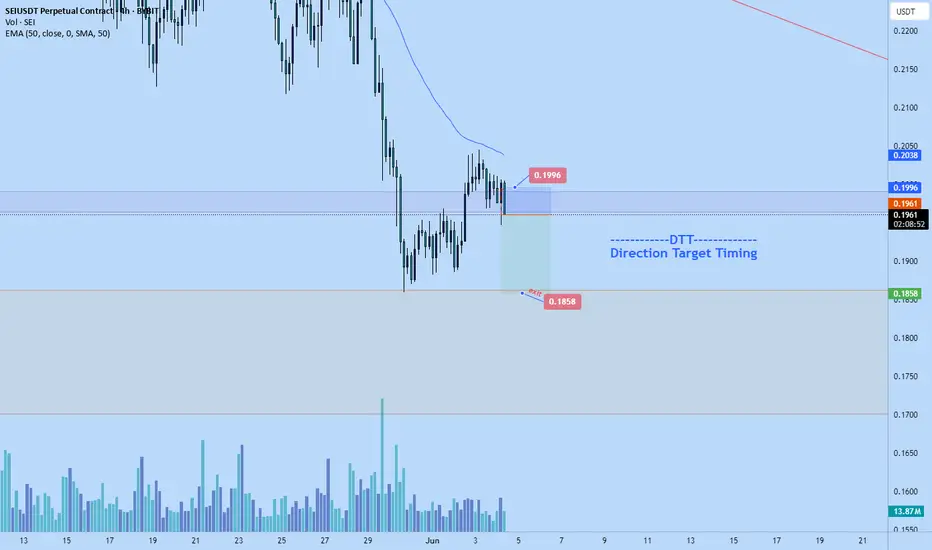
Sei long to $0.19 areaJust hopped into a long position on Sei. Am targeting $0.19 area to get roughly 3RR from the move given plays out.
Stop: $0.1824
Time sensitive.
Its relatively high but if btc continues to pump theres a good chance it will hit tp.
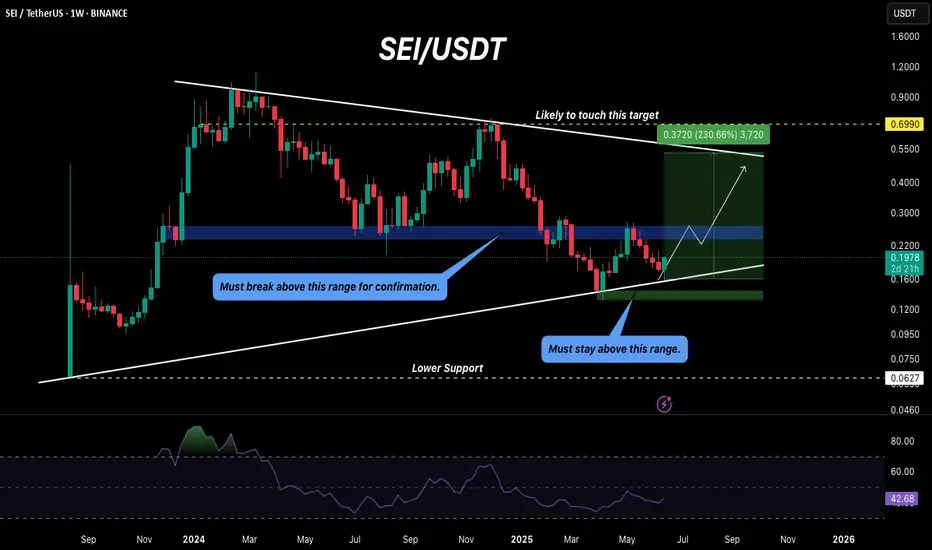
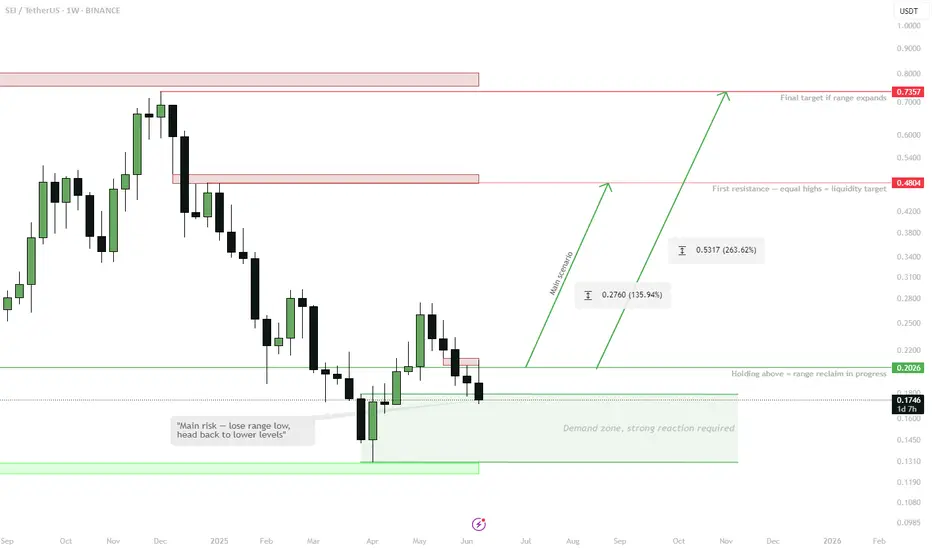
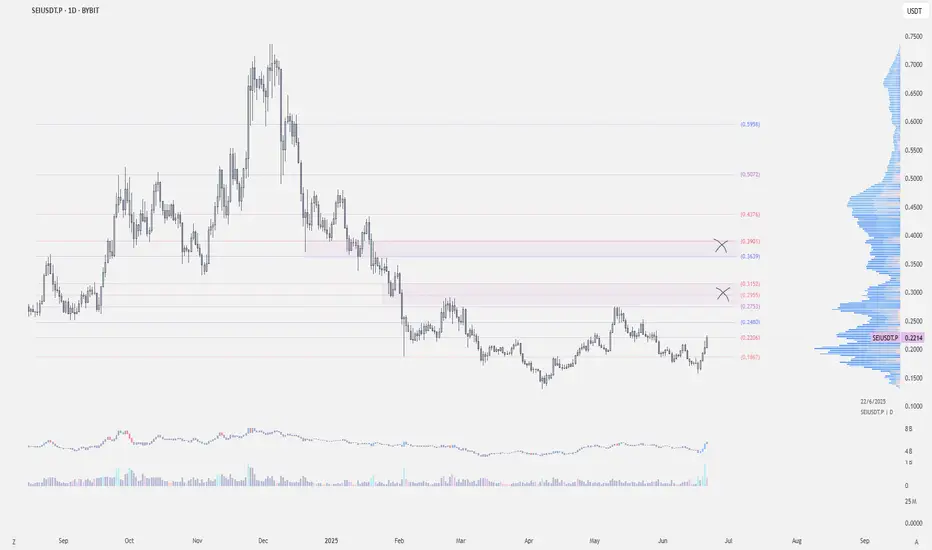
SEI | 1W range reclaim in progress.Holding above $0.20 (range low & demand zone) — expecting a move towards the mid-range ($0.48), where a stack of equal highs is waiting.
Lose $0.20 — invalidation, back to lower support.
Key idea: Range play, targeting liquidity at the mid-range. Macro resistance at $0.75 if breakout extends.
Accumulation still visible, bullish bias above range low.
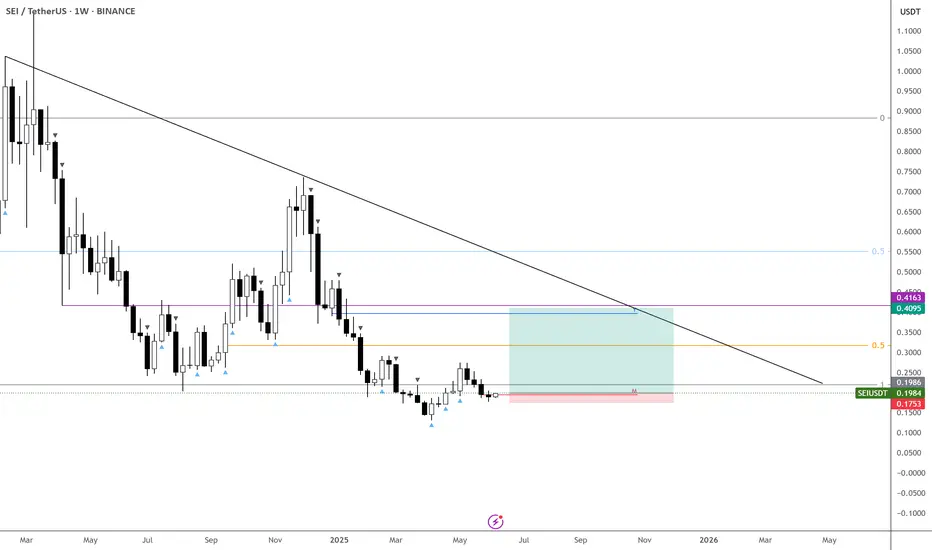
SEI – Clear Invalidation, Going Long at 20cGoing long here on $SEI.
Invalidation is straightforward—shouldn’t see new lows from this point.
First target is 40c. If that breaks, we could see solid momentum follow through.
BINANCE:SEIUSDT 2x
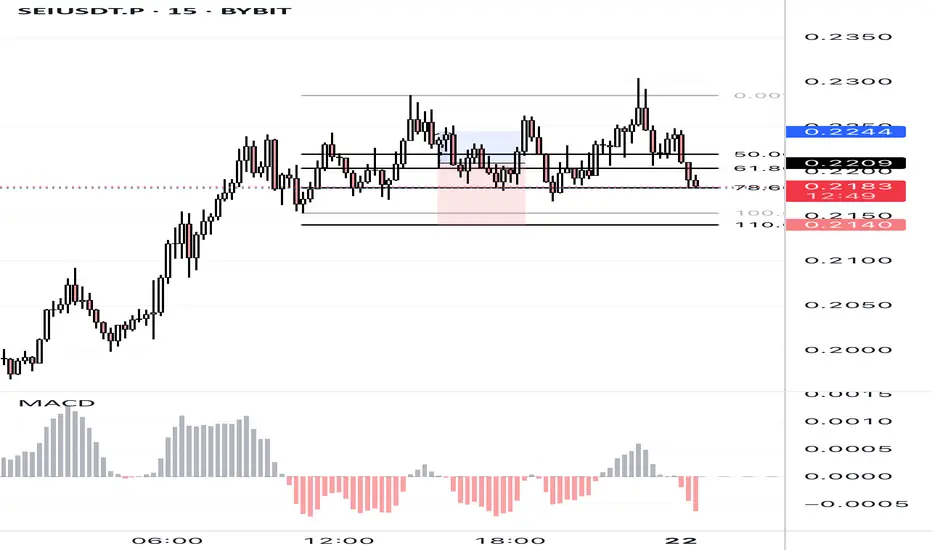
SEIUSDT.P – Long Setup in Fib Golden Zone with Volatility CompreSEIUSDT.P is consolidating after a strong bullish move. Price is now retracing into the 61.8–78.6% Fibonacci zone, which historically acts as a key reversal area. Multiple rejections and compression in this range suggest a potential bounce.
MACD shows signs of bearish momentum fading. If confirmed, this could be a solid risk-managed long with upside toward previous highs.
$SEI - Long Trade IdeaBINANCE:SEIUSDT is showing relative strength despite the dump
If CRYPTOCAP:BTC holds above 103k–102.7k, I’m looking for a move toward 0.27–0.32 (initial target)
Entry: .22-.20
Stoploss: Below .175
Targets:
.27 - .32
.36 - .38
.42 - .44
SEI putting in work for a reversal SEI is working on its pivot. In the meantime, we accumulate at positions of strength. A proper higher low and a higher at this level would be a good sign.
Full TA: link in the BIO
One Problem - No Solution - SEISEII just moved up and it create problem for new longs or short, they be like what to do buy or sell? Technically the moves are precendted by two ocassions, orange is the one where the moves top is to be get loaded and the moves down would get wrecked, the move it says need a orange move to get up and red says a straight top move
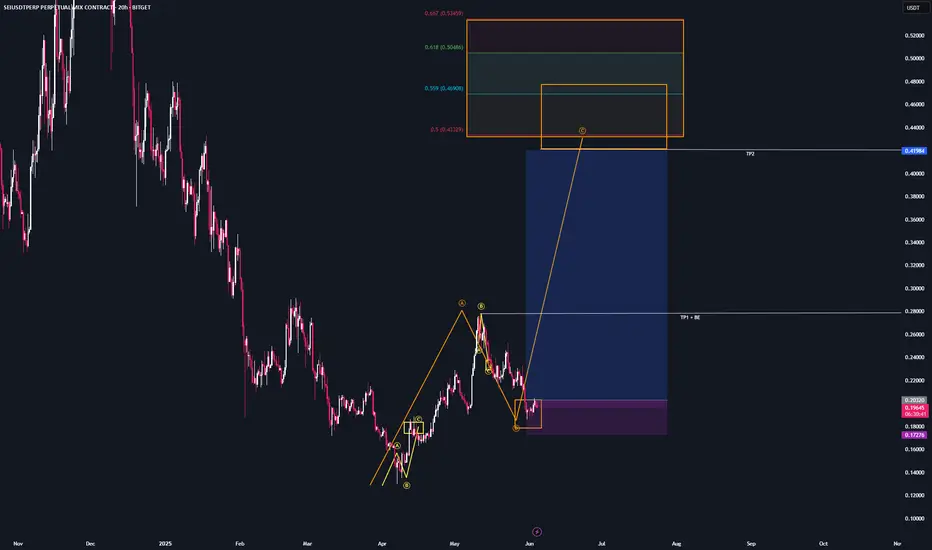
SEI - SetupI don’t have an active position on NYSE:SEI right now — I’m already heavily allocated to my three other setups.
But this is a potential trade I’d consider if I weren’t in the market yet:
Tp1 + BE : at $0.28 — recent highs
Tp2: at $0.41 — target region
If you have any questions about my system or trade logic, drop them below — I read every comment 👇
And feel free to share your own analysis too — I’d love to see it!
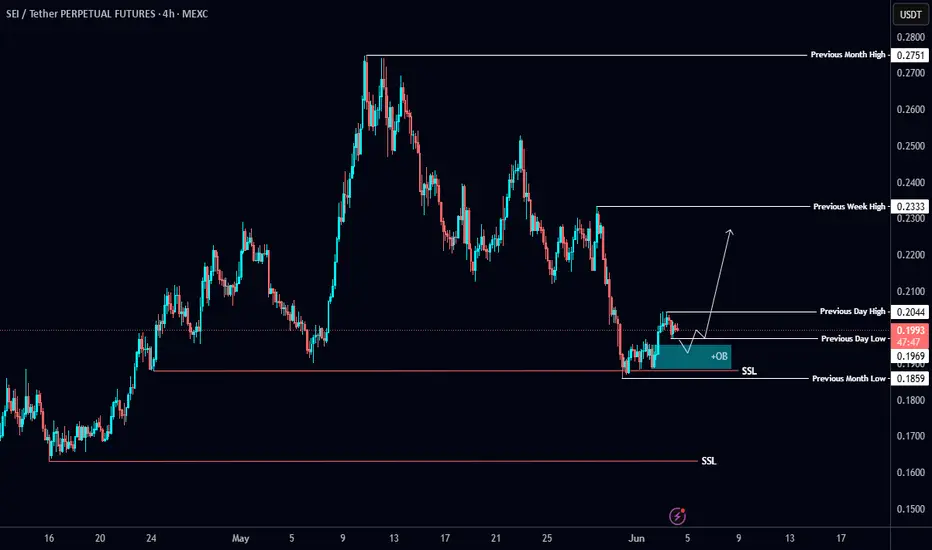
$SEI Analysis📉 NYSE:SEI Analysis 📉
#SEI swept initial sell-side liquidity and bounced 🔄
Next watch: Tuesday’s low — want to see it taken and tapped into the 4H +OB for a long setup 🎯
If that +OB doesn’t hold, expect another liquidity sweep before the real bounce 🧹
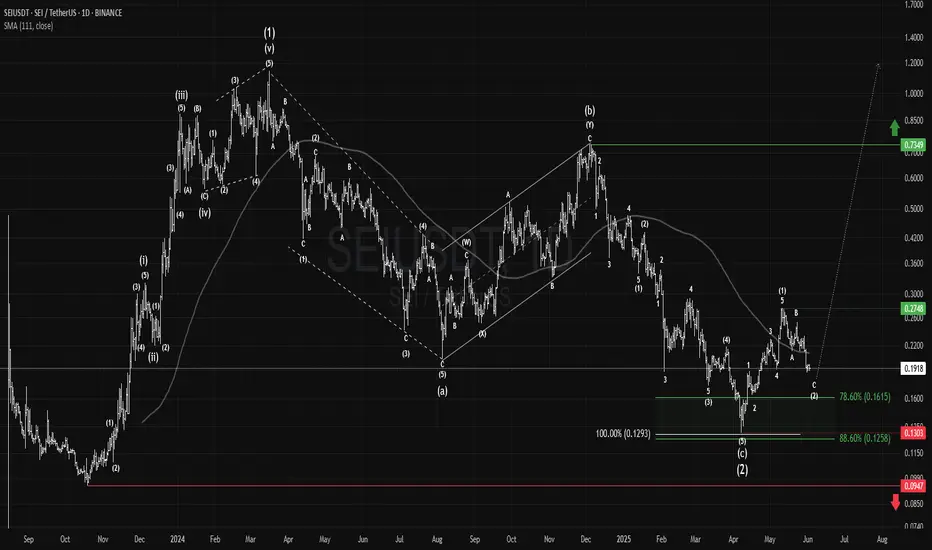
SEI: Fully Locked#SEI showed a clean motive wave after its April low, followed by a corrective wave, forming a classic setup for a powerful third wave.
Holding above $0.130 keeps the idea valid, with $0.095 as final invalidation. Passing $0.275 confirms the pattern; $0.735 targets the ATH.
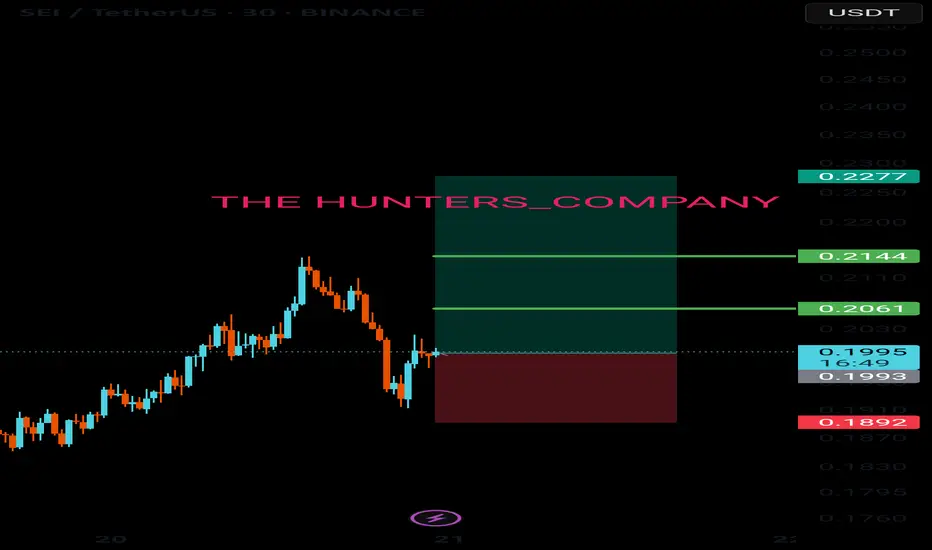
#SEI/USDT#SEI
The price is moving within a descending channel on the 1-hour frame, adhering well to it, and is heading for a strong breakout and retest.
We are experiencing a rebound from the lower boundary of the descending channel, which is support at 0.1840.
We are experiencing a downtrend on the RSI indicator, which is about to break and retest, supporting the upward trend.
We are in a trend of consolidation above the 100 Moving Average.
Entry price: 0.1927
First target: 0.1999
Second target: 0.2067
Third target: 0.2162

SEI – Descending Channel Test on Daily🟡 NYSE:SEI is consolidating within a descending channel on the daily timeframe. Price is approaching the key support zone between $0.1750 and $0.1650 — an area that needs to hold for any chance of a reversal.
👀 Keep this level on your radar as the next move could decide short-term momentum!
