SEKUSD trade ideas
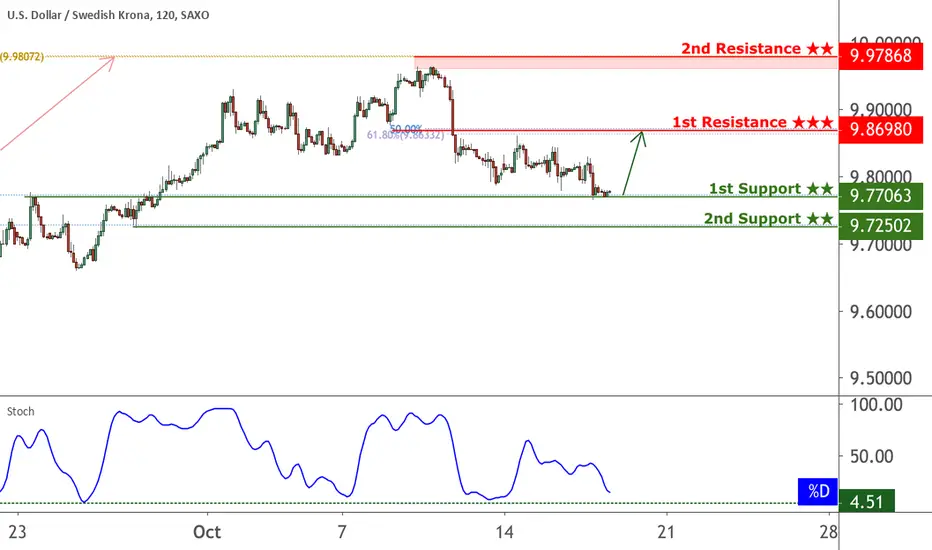
USDSEK bounced from support, potential for a further rise!
USDSEK bounced off 9.77063 where it could potentially rise further to 9.86980.
Trading CFDs on margin carries high risk.
Losses can exceed the initial investment so please ensure you fully
understand the risks.
Bearish Analysis on USD/SEK by ThinkingAntsOk4H CHART EXPLANATION:
On this timeframe we observe that price is on a small consolidation at this moment. If it breaks down and the Ascending Trendline is broken, then we will wait for a corrective structure (continuation pattern) like a triangle, pennant, flag, etc. to take this trade. The first short term target is the confluence zone between the Daily Ascending Trendline and the Support Zone at 9.5800 - 9.6000. If this zone is broken, then price has potential to reach the Support Zone at 9.2500. The long term analysis is below on the Daily chart.
DAILY CHART EXPLANATION:

USDSEK approaching support, potential for a bounce!
USDSEK is expected to drop to 1st support at 9.77834 where it could potentially react off and up to 1st resistance at 9.86980.
Trading CFDs on margin carries high risk.
Losses can exceed the initial investment so please ensure you fully
understand the risks.

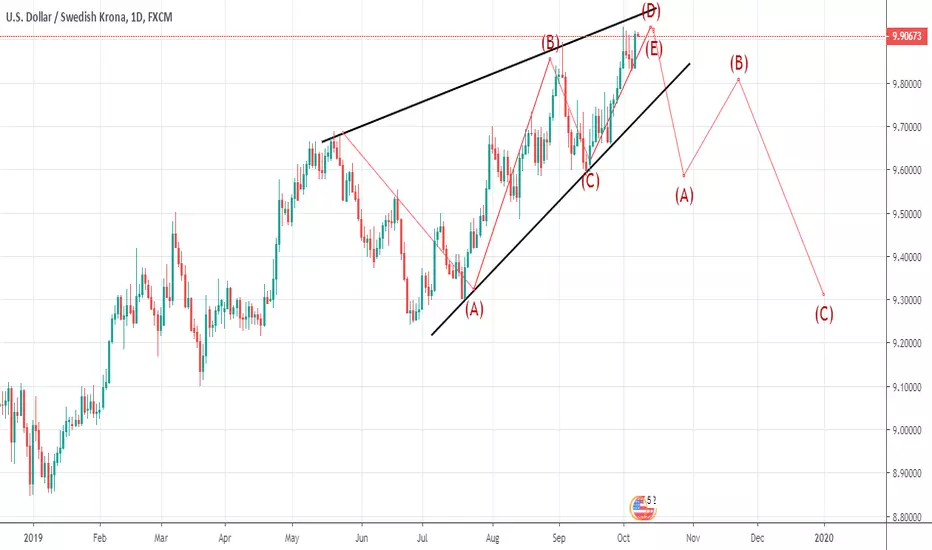
Potential bullish reversal Usd SekPotential bullish reversal in Usd Sek daily, tricky because it has potential for bulls to spike up and also for bears to go down, market is clear to me right now but, - bearish interests.

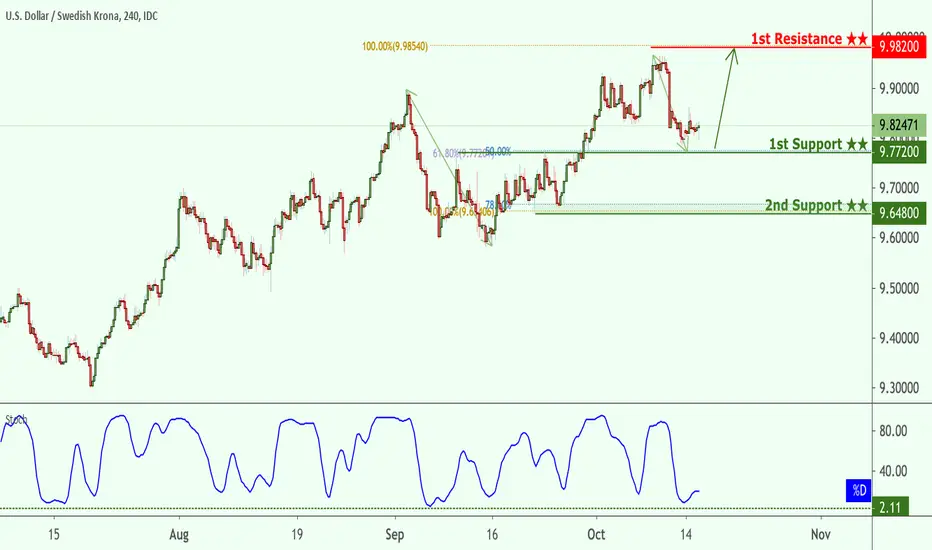
USDSEK bounced from support, potential for a further rise!
USDSEK bounced off 9.77200 where it could potentially rise further to 9.98200.
Trading CFDs on margin carries high risk.
Losses can exceed the initial investment so please ensure you fully
understand the risks.
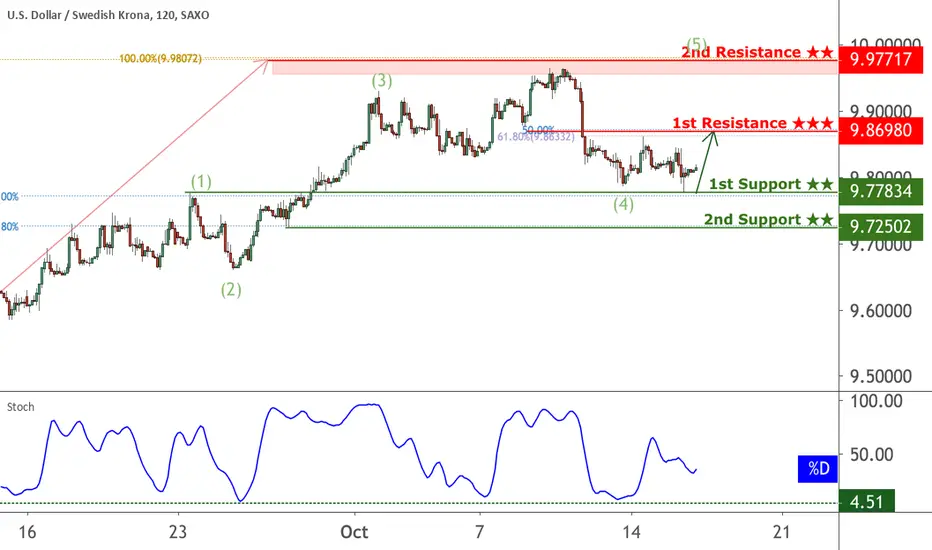
USDSEK bounced from support, potential for a further rise!
USDSEK bounced off 9.77834 where it could potentially rise further to 9.87290.
Trading CFDs on margin carries high risk.
Losses can exceed the initial investment so please ensure you fully
understand the risks.

USDSEK bounced from support, potential for a further rise!
USDSEK bounced off 9.77834 where it could potentially rise further to 9.87290.
Trading CFDs on margin carries high risk.
Losses can exceed the initial investment so please ensure you fully
understand the risks.
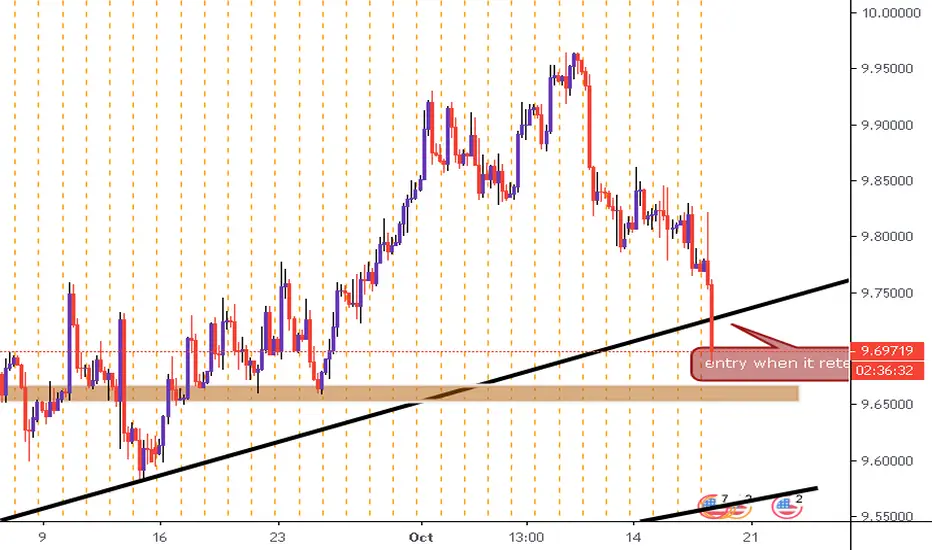
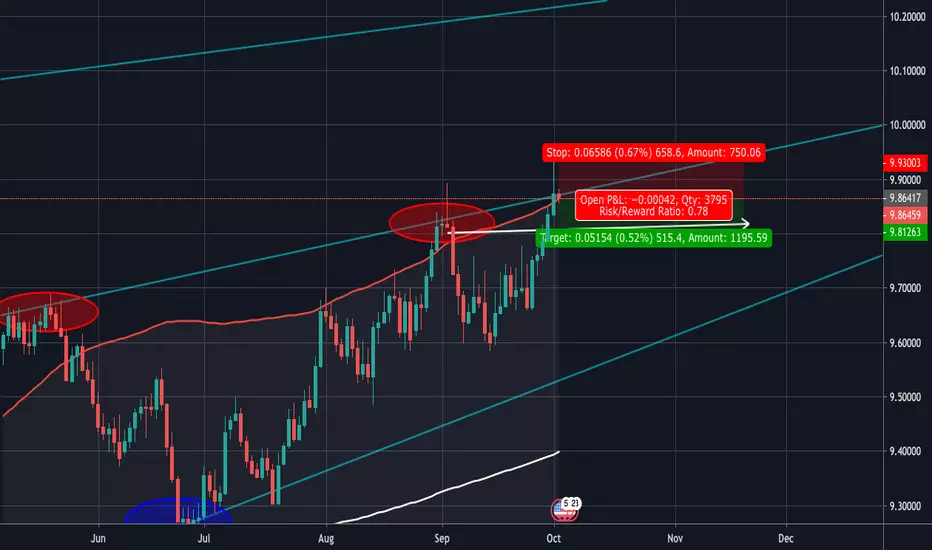
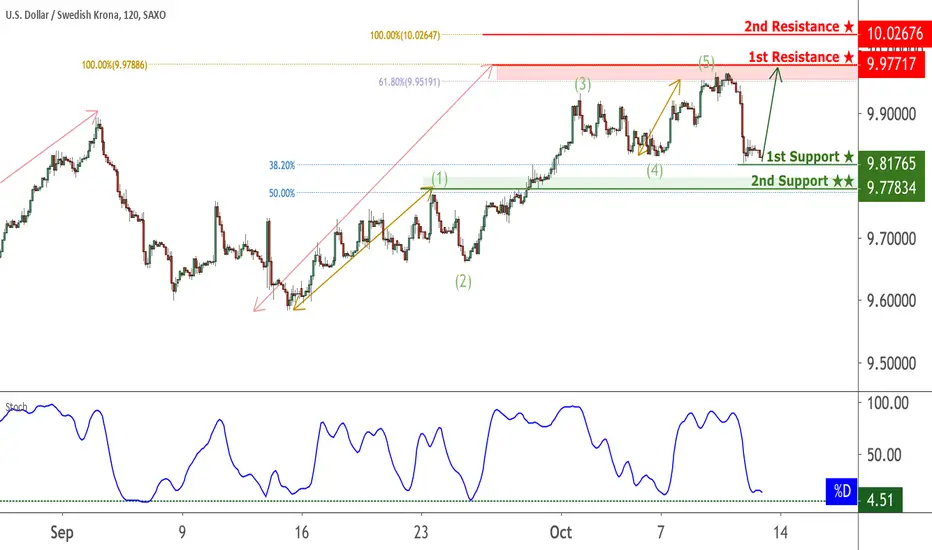
USDSEK SHORT - POSSIBLE 400-500 pip move!!Due to my analysis you can see price has reached the top of the Bollinger band, that means price has came to a certain resistance in the market. Besides the Bollinger band price has been moving with the trend it has created, which has been bullish. Since it reached the top of the trends resistance and top of the Bollinger we will go for a sell to about where last resistance was which is now support.
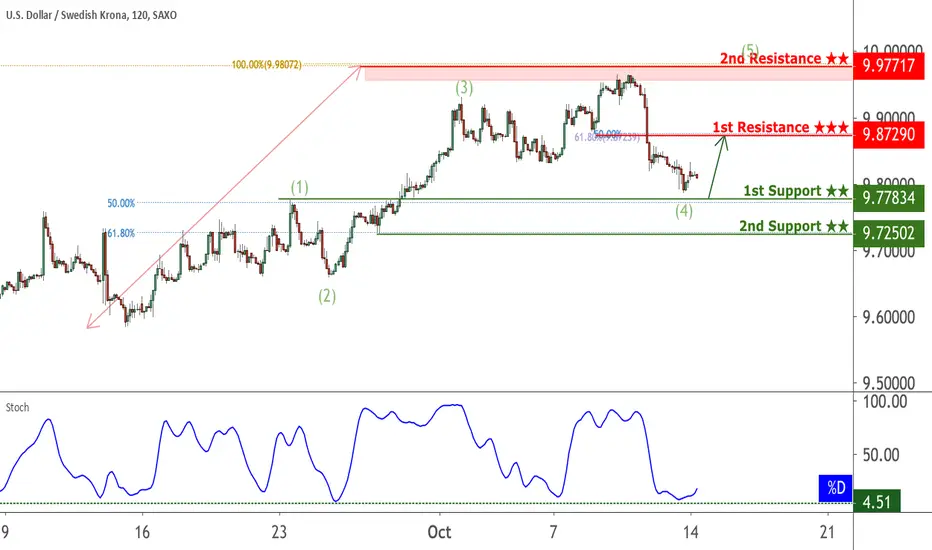
USDSEK bounced from support, potential for a further rise!
USDSEK bounced off 9.81765 where it could potentially rise further to 9.97717.
Trading CFDs on margin carries high risk.
Losses can exceed the initial investment so please ensure you fully
understand the risks.
USDSEK - 240 - Quick shoutout before Swedish CPIsTrade idea
Watch the possible breakout levels, which are highlighted. If the pair breaks to the upside, our target is the psychological 10.0000 barrier. If the pair drops through the lower highlighted area, this could signal a change in the short-term trend.
Please see the chart for details. Don't forget your stop-loss.
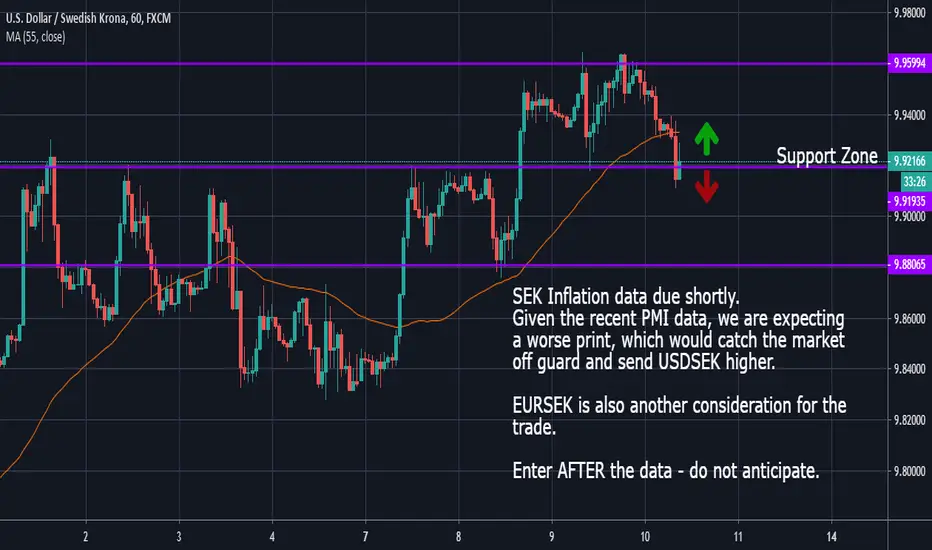
USDSEK - Potential Long if CPI Disappoints!SEK Inflation data due shortly.
Given the recent PMI data, we are expecting
a worse print, which would catch the market
off guard and send USDSEK higher.
EURSEK is also another consideration for the trade.
Enter AFTER the data - do not anticipate.
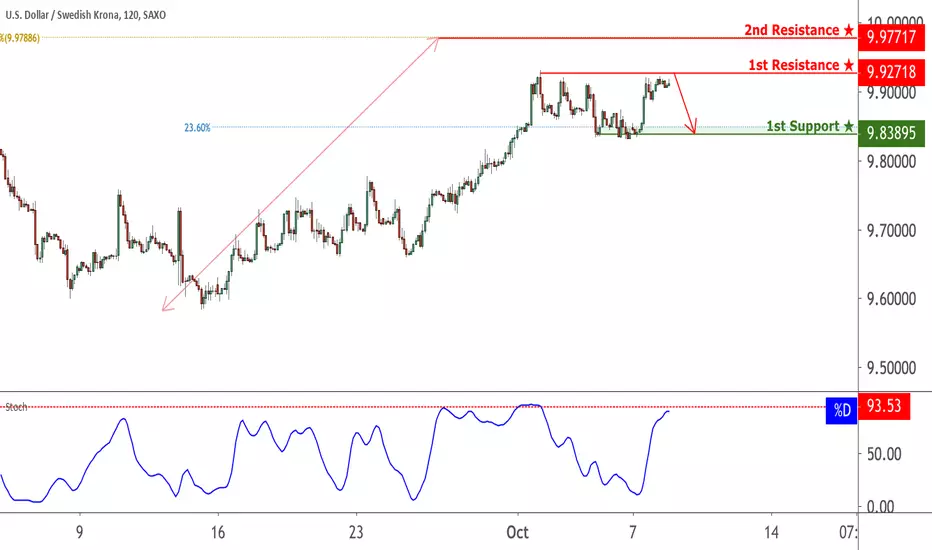
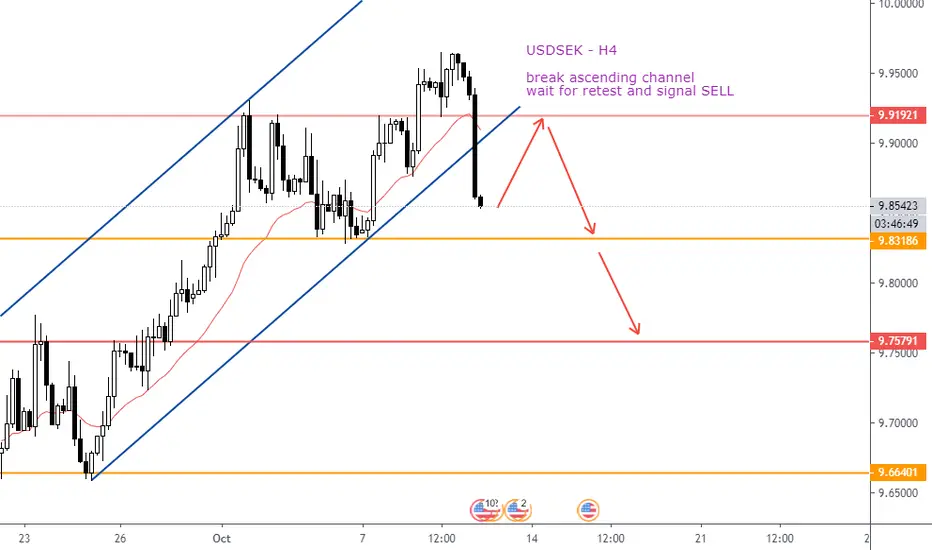
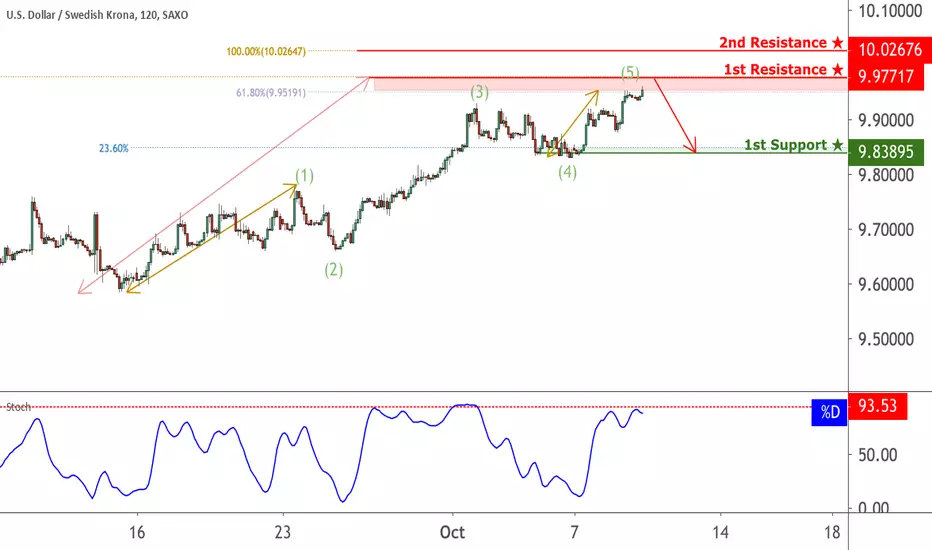
USDSEK reversed from resistance, potential drop!
USDSEK reversed off its resistance at 9.97717 where it could potentially drop further to 9.83895.
Trading CFDs on margin carries high risk.
Losses can exceed the initial investment so please ensure you fully
understand the risks.
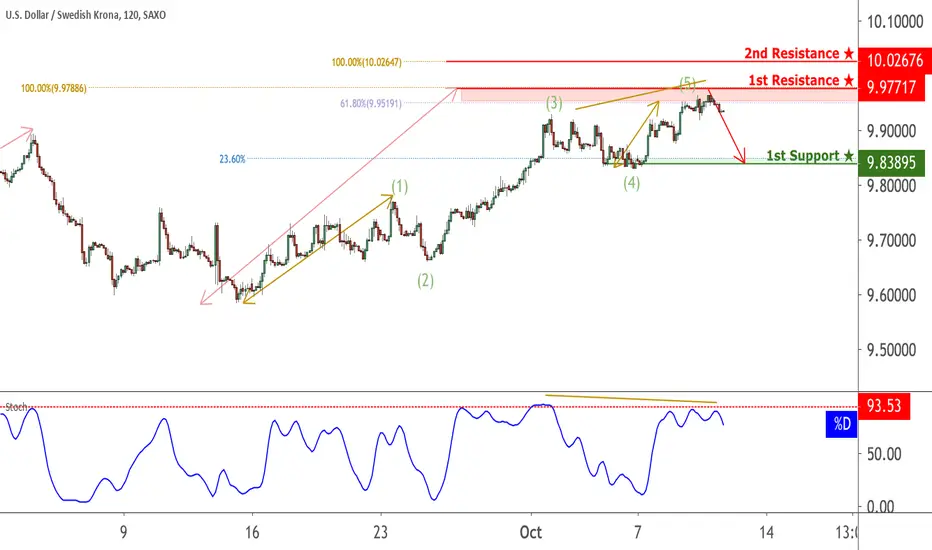
USDSEK approaching resistance, look out for potential reversal!
USDSEK is approaching its resistance at 9.97717 where it is could reverse down to its support at 9.83895.
Trading CFDs on margin carries high risk.
Losses can exceed the initial investment so please ensure you fully
understand the risks.

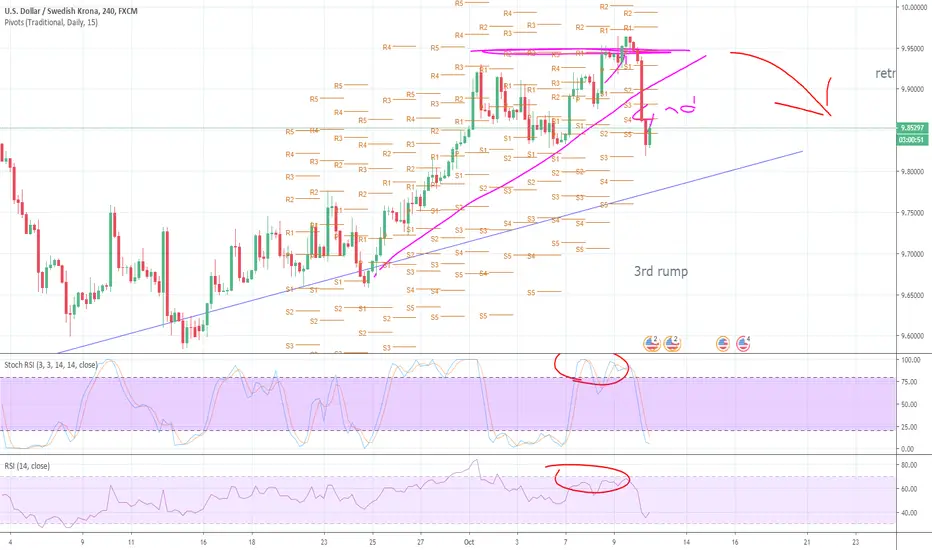
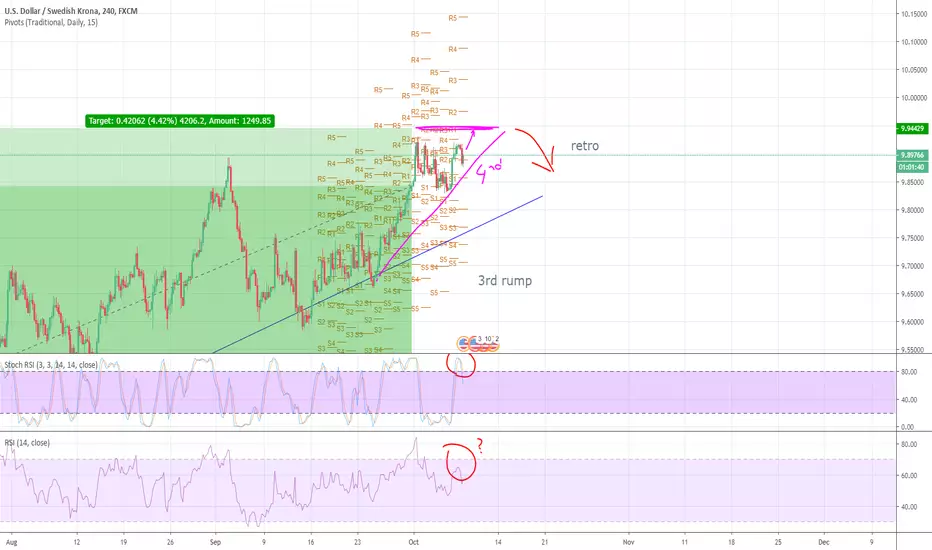
USDSEK arriving to exhausted level-Be ready to contra trend USDSEK in its uptrend is showing the first signs of debility...
We should wait until confirmation.
Beware, today the uptrend is still valid.
Be ready to execute any contra trend strategy to trade shorts for some pips...
USDSEK turned bullish - LongThere's a bullish channel within a bullish channel that I see happening here, (shortened higher and lower diagonal green lines), and candles have strong suggestive bearish wicks -but, this is a Bull market.
Low volatility close to being motionless, best followed in Heikin Ashi, -and if price falls below the secured 9.82990 lower high, then the setup will be invalid.

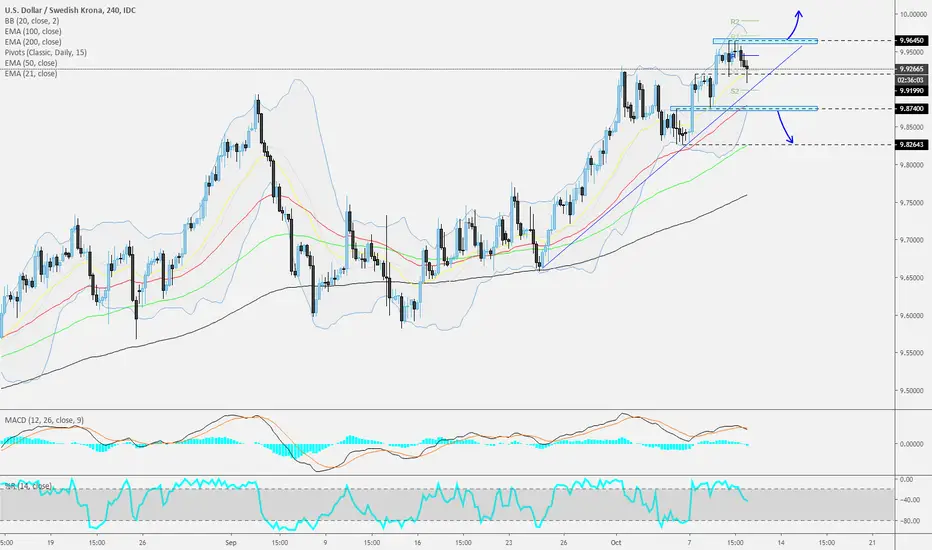
USDSEK reversed from resistance, potential drop!
USDSEK reversed off its resistance at 9.92718 where it could potentially drop further to 9.83895.
Trading CFDs on margin carries high risk.
Losses can exceed the initial investment so please ensure you fully
understand the risks.