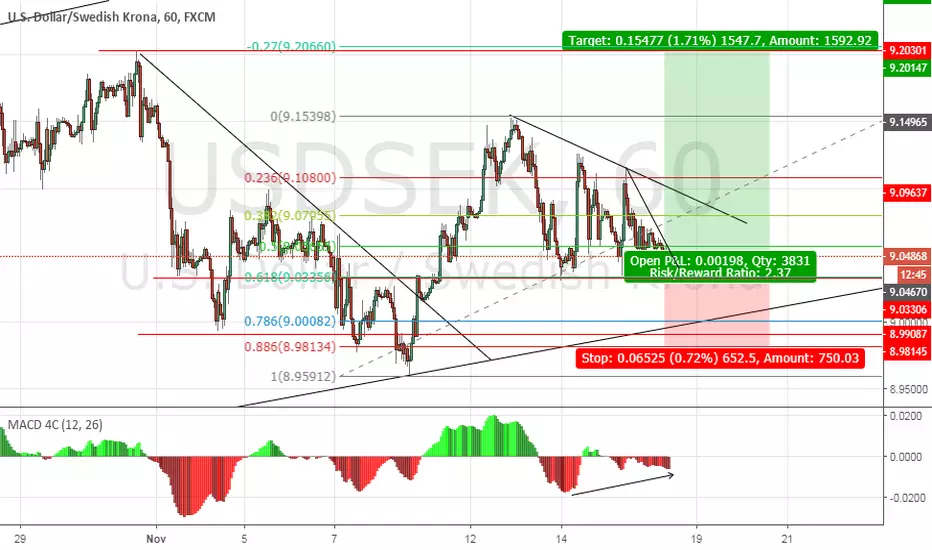
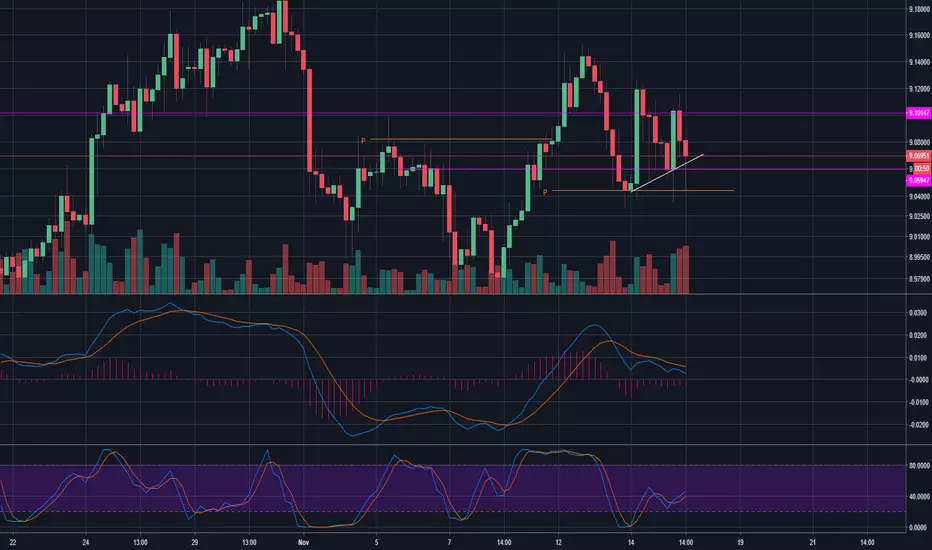
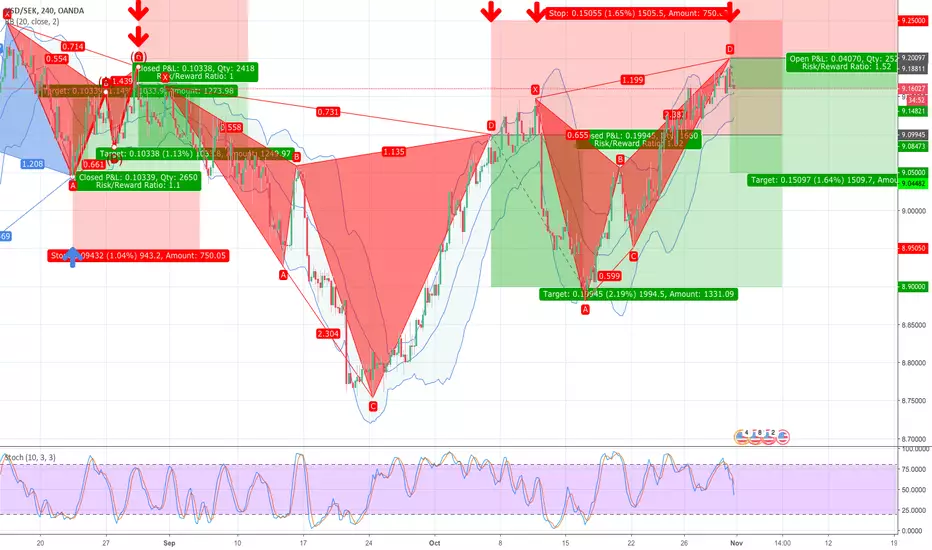
+2.36RMULTIPLEWedge Pattern + PinBar
Wedge Support Line, Horizontal Support Resistance Line, and EMA 10 EMA 20 are in close proximity to each other.
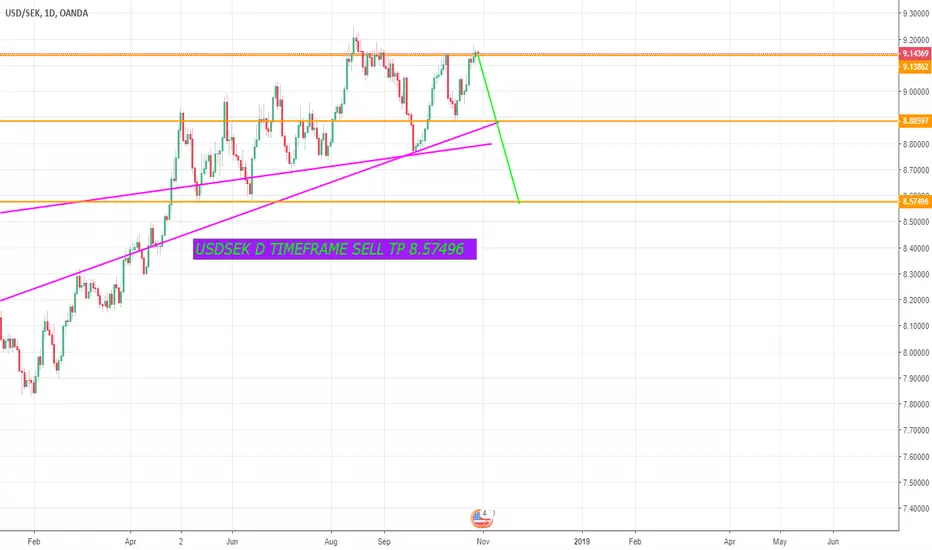
SEKUSD trade ideas

Buy USD/SEKThis is just a journal for me. I strongly warn you to not take this in your real account. Good luck!

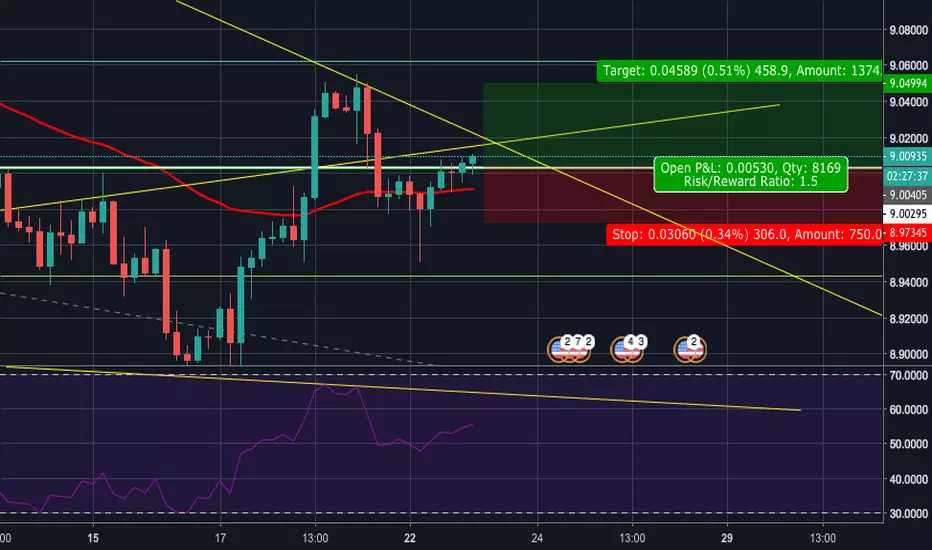
USDSEK 6 RRR for further upsideSecond chance entry to the earlier pattern,
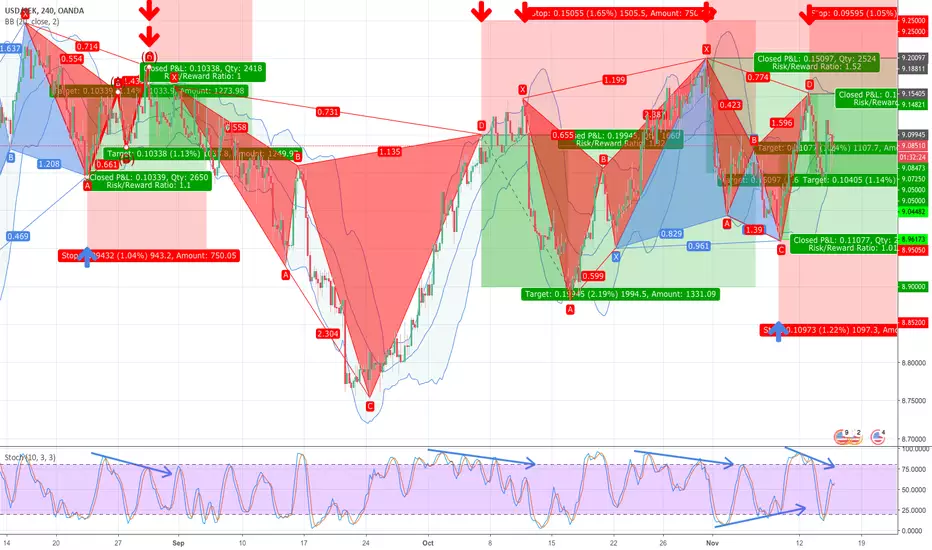
Trading Methodology:
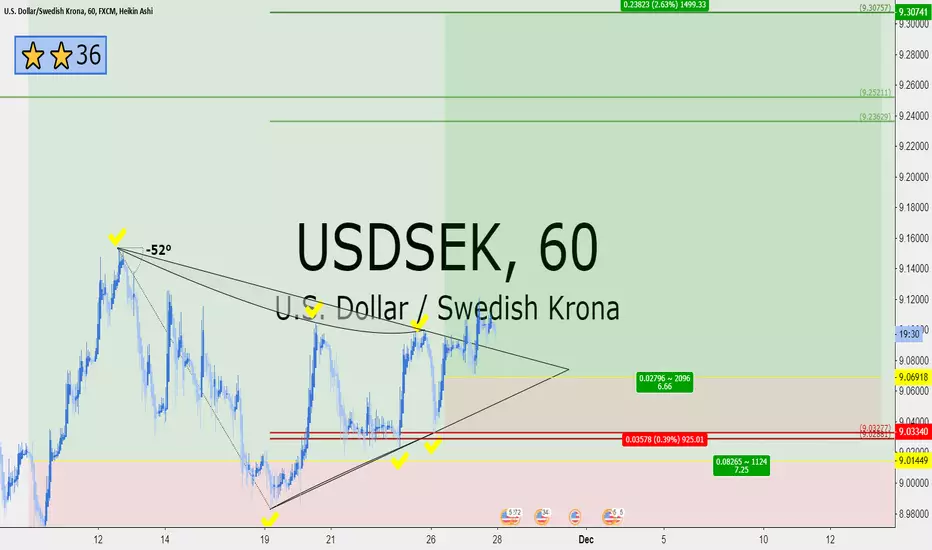
1. An asymmetric bullish/bearish pennant is drawn using ascending and descending curved trend lines with a minimum of three price action touche points per line. The direction is determined by the previous trend.
2. The angle tool is applied from the earliest two trend touch points, beginning at the earliest touch point.
3. A trend-based Fibonacci retracement triangle is drawn starting from the earliest trend touch point and ending at the earliest touch point of the opposite trend line .
4. Based on the degree, of the earlier defined angle, the appropriate (and secret) levels are selected for the fibonacci retracement ; two levels for stop-loss and two levels for take-profit. The closest stop-loss level to the current price level is the top priority stop-loss. Though the secondary stop-loss level is often chosen for some markets such as FX and some equities in order to account for seldom unexpected resistance breaks. The greater target level is the top priority, and where majority of the shares are sold, though some may choose to close part of the position at the first target level or set it to be the stop-loss once price exceeds it. Entries should be laddered in around the levels closest of the yellow line.
This trading strategy can be applied to any market and time frame, and positions most often garner the greatest risk-to-reward ratio with the highest success rate. What more can you ask for? I will only be posting my unique trading strategy until EOY. I work solely with price action to identify pennants and apply unique trend-based fibonacci retracement levels for SL and TP levels. Reach out to me if you have any questions.

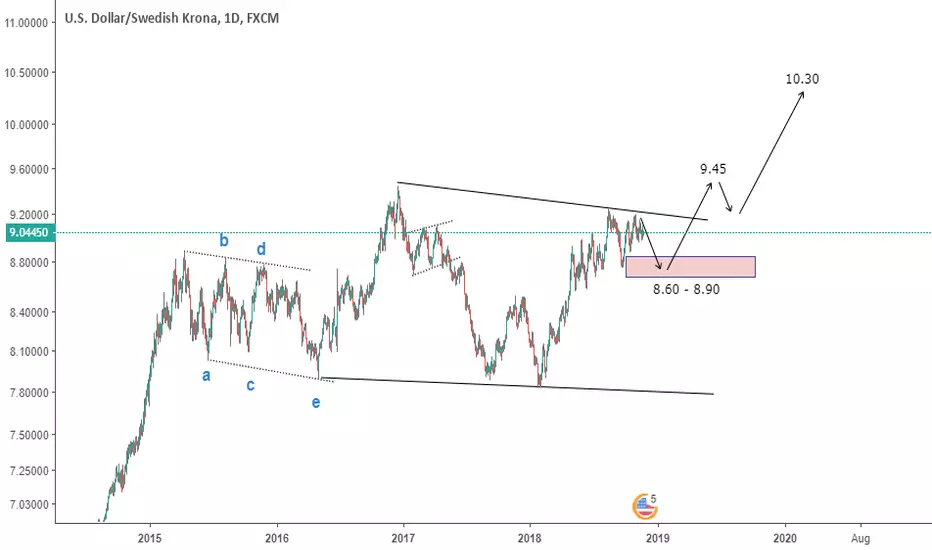
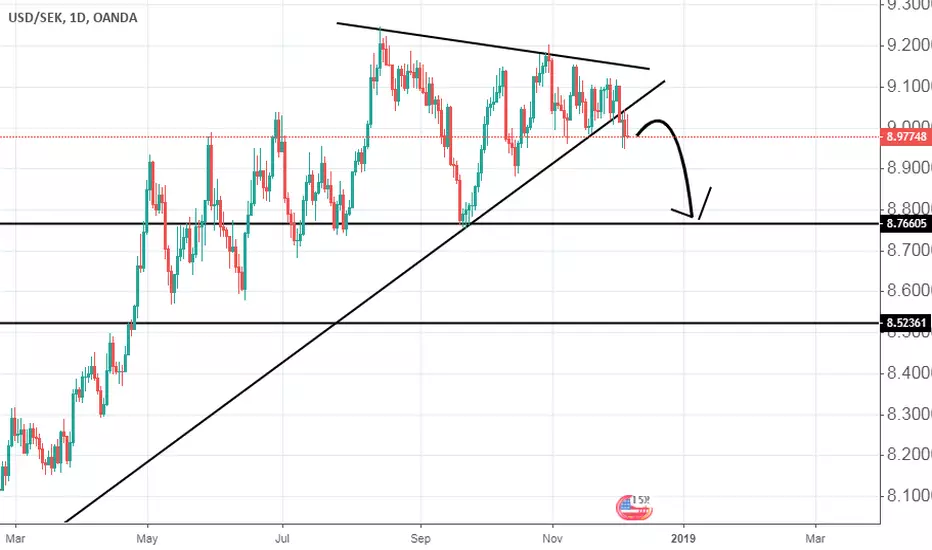
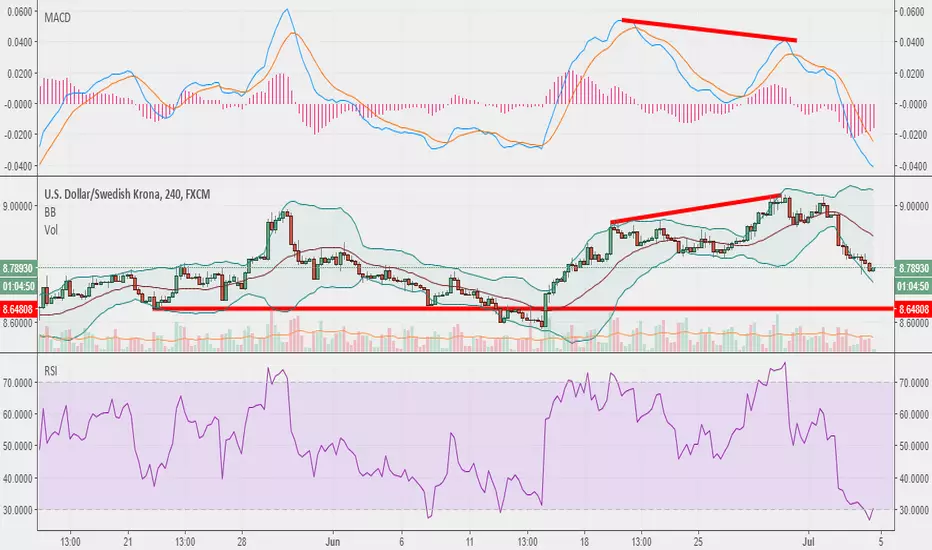
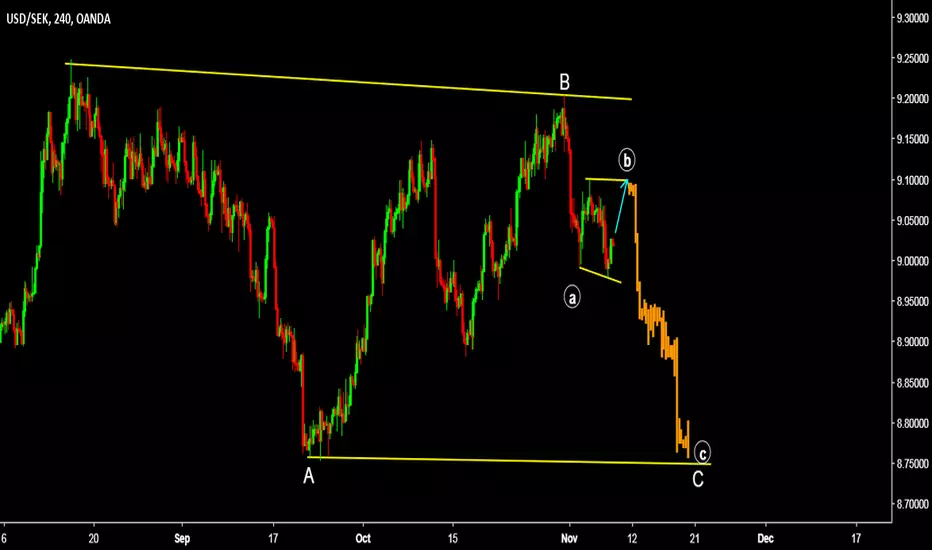
USDSEK - SHORT Hello Guys,
Usdsek is a short in the short term - 8.60 is the target ( watch out daily chart ).
Detected a bearish divergence on MACD
See you soon,
Simone
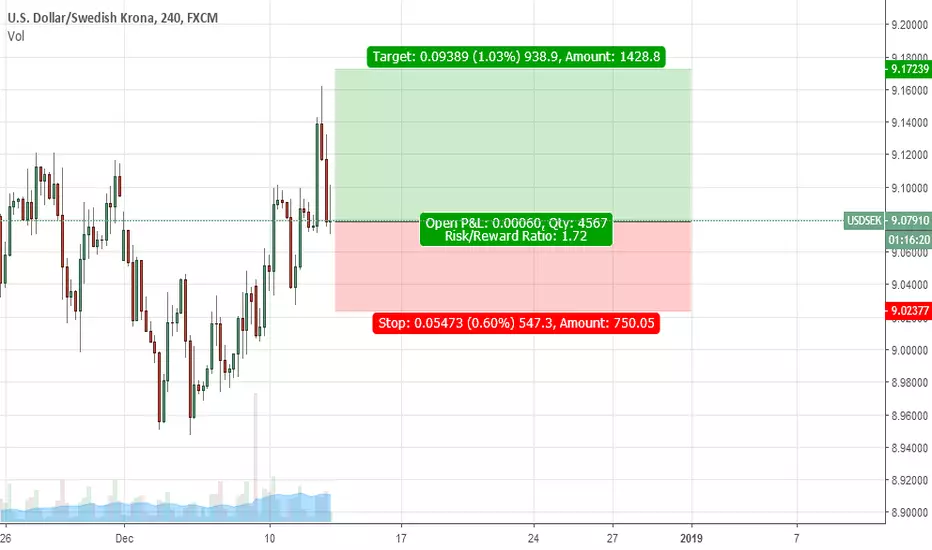
Short USDSEKShorting from 9.1015, this should be the final big break. Took profit before bed last night on the majority of the short form 9.12, this is the reentry level.
38.2% & POSSIBLE 61.8% Retracement SHORT GWAVE.38.2% & POSSIBLE 61.8% Retracement SHORT GWAVE.
FIB Retracement Percentage is calculated in a Higher Cartesian and or Euclidean Dimension.
PLEASE ALWAYS WAIT FOR STOCHASTIC CONFIRMATION!!! THANKS
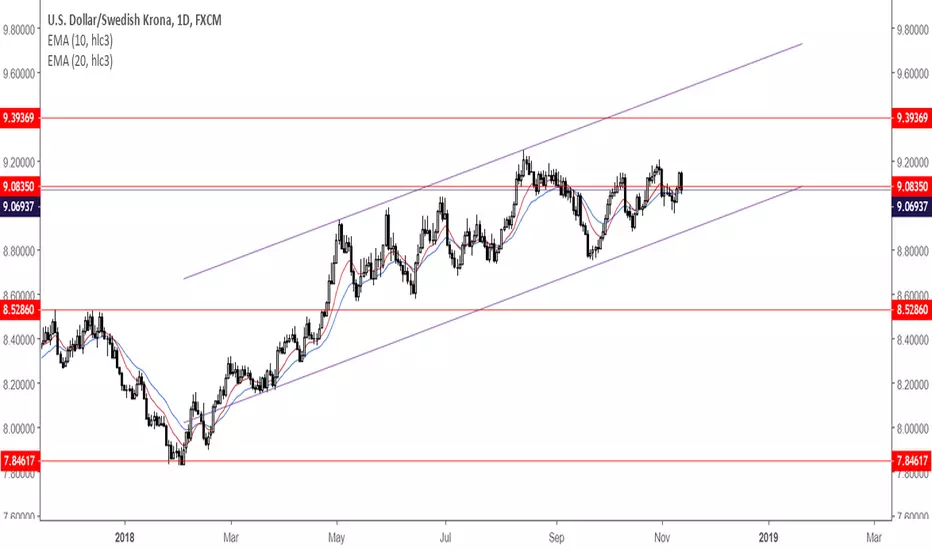
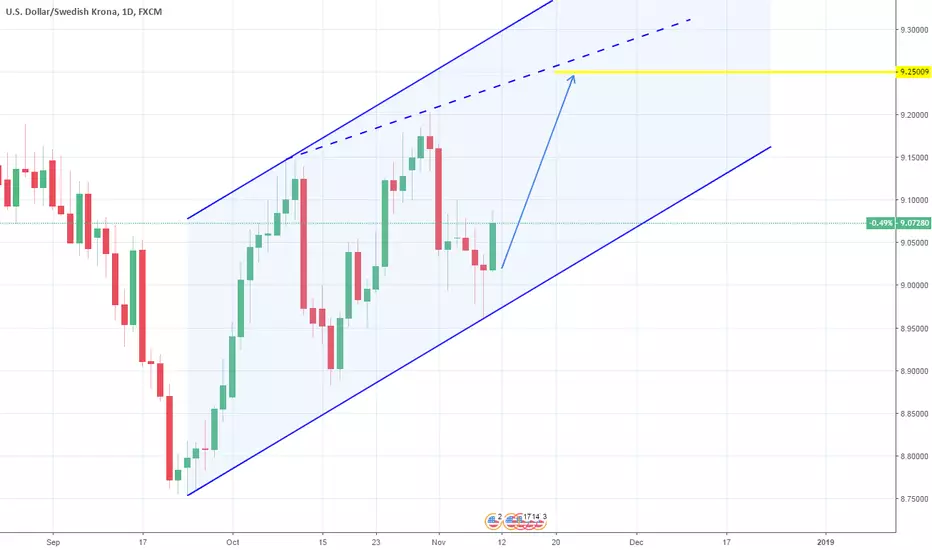
USDSEK: 1D Channel Up. Long.The pair has completed a Higher Low placement within the 1D Channel Up (RSI = 53.586, Highs/Lows = 0.0000). The Higher High process will follow next, so the trade is long with TP = 9.2500.
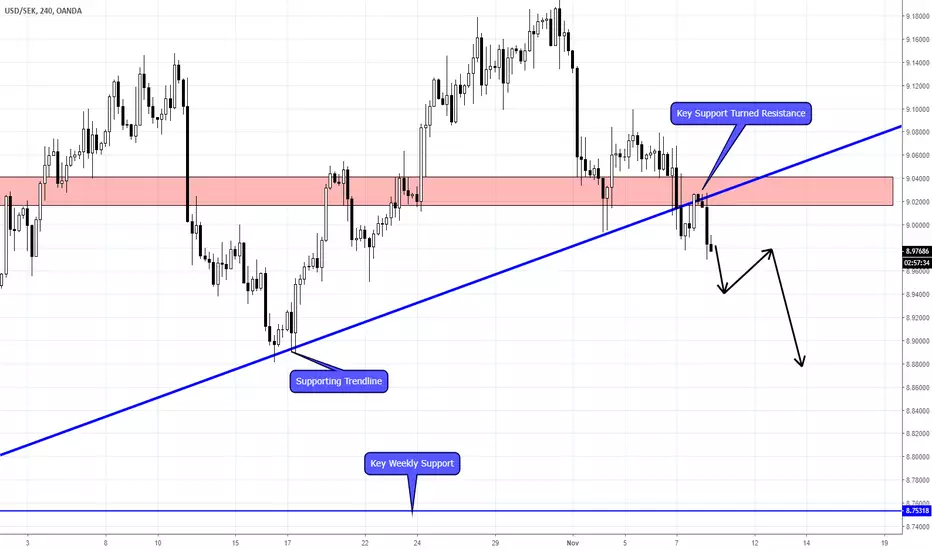
USDSEK (EURUSD BABY BROTHER)USDSEK often gets overlooked by retail traders as they see this market as having a mind of its own however, this market
can be traded instead of the EURUSD due to its strong correlations. If you use the compare tool in tradingview add this chart
to the EURUSD chart and you will see when EURUSD goes long, this chart goes short and vice versa.
Often the EURUSD can become cluttered and the USDSEK could show clearer trading opportunities.
Technically we have been waiting for price to break the key supporting trendline, price completed this on the Daily chart
and now we are looking for the continued short trades after it re-tested the key resistance at 9.0200.
USD SEK SELL (DOLLAR – SWEDISH KRONA)Hi there. Price is forming a continuation pattern to the downside. Wait for the price to hit the top of the pattern and watch strong price action for sell.
long - shortthose who are day traders you can expect a little long but i advise that you wait for shorting oppertunities only
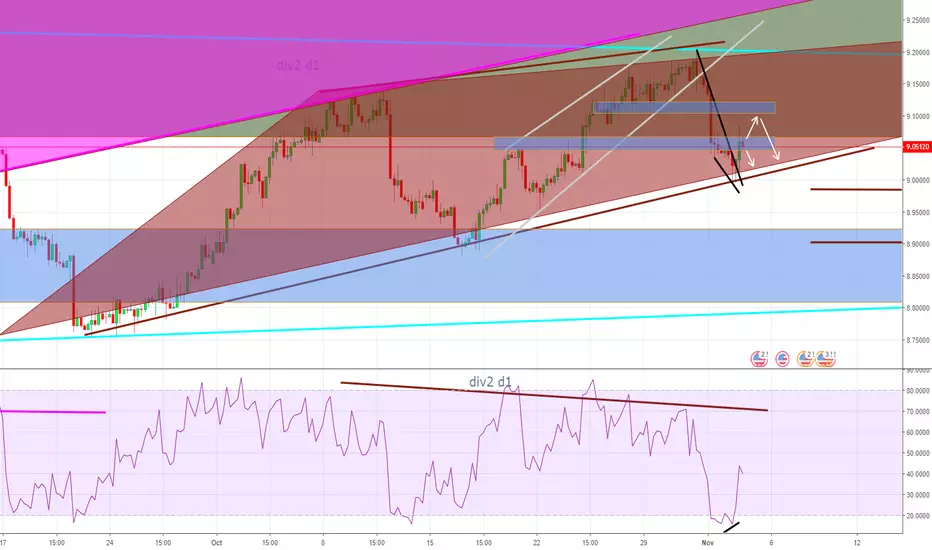
a little long position, and a cup full of short positionsas you can se we have weekly and daily patterns and divergence so for those with big accounts you can hold a short position. but for smaller accounts i will post a lower timeframe projection for you

38.2% & POSSIBLE 61.8% Retracement SHORT GWAVE.38.2% & POSSIBLE 61.8% Retracement SHORT GWAVE.
FIB Retracement Percentage is calculated in a Higher Cartesian and or Euclidean Dimension.
PLEASE ALWAYS WAIT FOR STOCHASTIC CONFIRMATION!!! THANKS
USDSEK "Exotics"This pair has completed a 5 wave on the 4hr with a 1.618 extension. It hit a previous supply zone on the Daily. I expect Dollar weakness moving forward.

USD/SEK 1H Chart: Bullish momentum likelyUpside risks prevailed in the market, thus sending the US Dollar 4.25% higher against the Swedish Krona. Half of these gains have erased since beginning of October, as the pair returned near 8.9000.
As apparent on the chart, the currency pair is trading in a short-term ascending channel. Given that the rate is supported by the 55-, 100– and 200-hour SMAs, it is likely that goes upside. Important resistance level to look out for is a combination of the Fibonacci 0.00% and the weekly R3 at 9.2487.
It is the unlikely case that some bearish pressure still prevails in the market, the US Dollar should not exceed the Fibonacci 23.60% retracement at 8.9134.