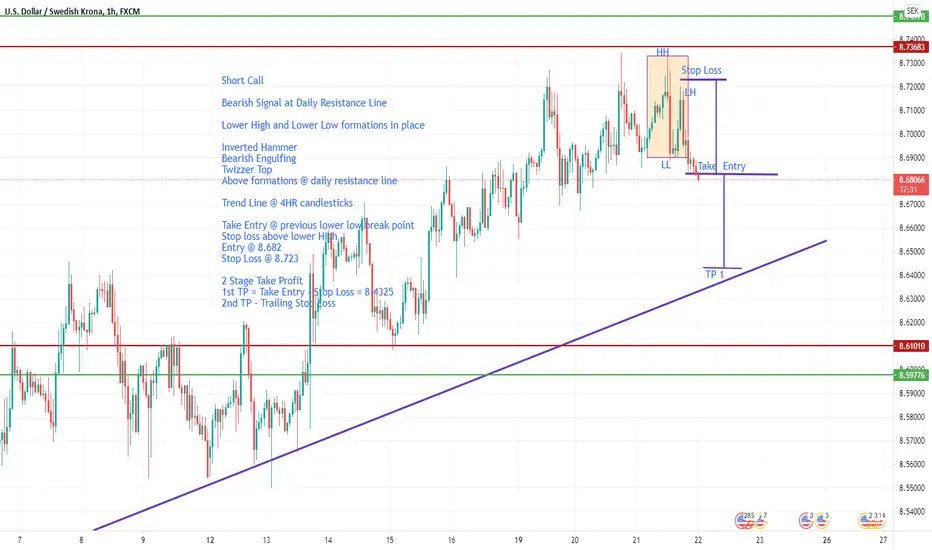
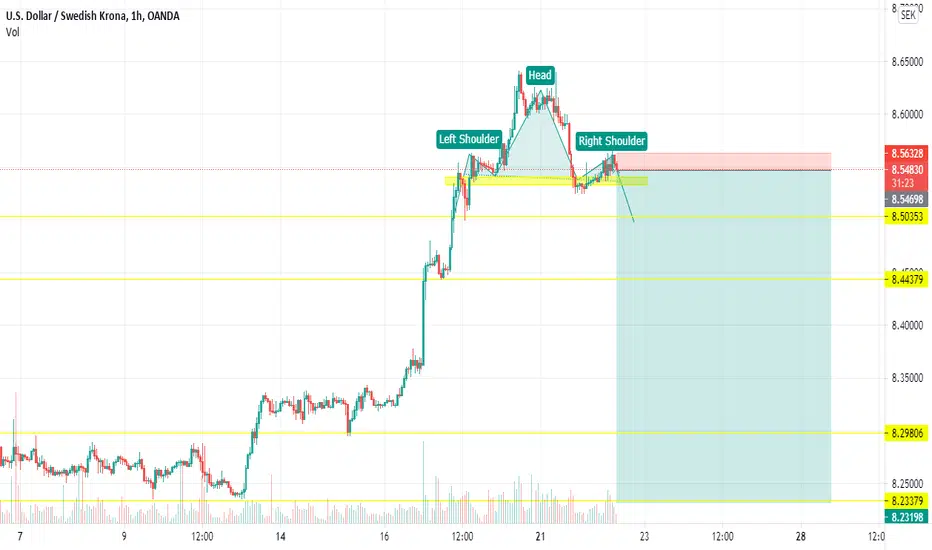
USDSEK(Short)Short Call
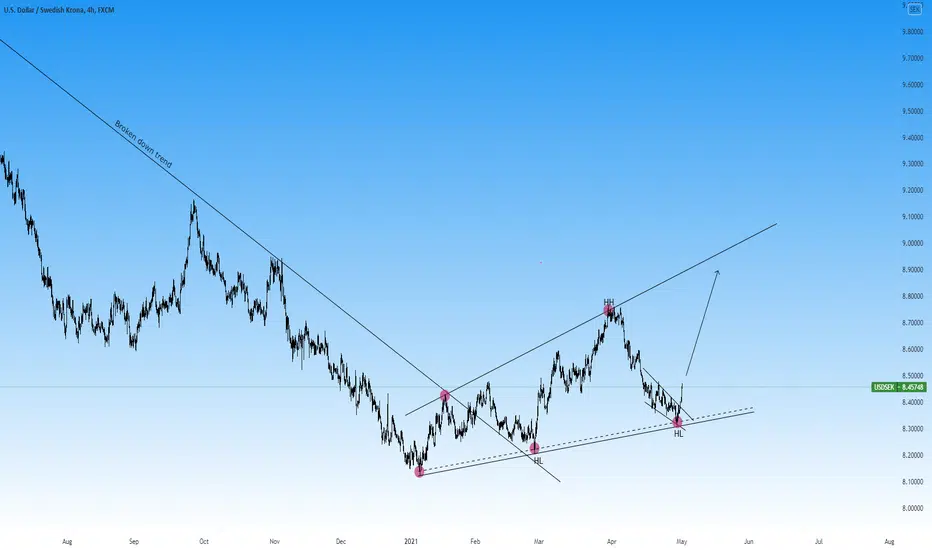
Bearish Signal at Daily Resistance Line
Lower High and Lower Low formations in place
Inverted Hammer
Bearish Engulfing
Twizzer Top
Above formations @ daily resistance line
Trend Line @ 4HR candlesticks
Take Entry @ previous lower low break point
Stop loss above lower High
Entry @ 8.682
Stop Loss @ 8.723
2 Stage Take Profit
1st TP = Take Entry - Stop Loss = 8.4325
2nd TP - Trailing Stop Loss
SEKUSD trade ideas
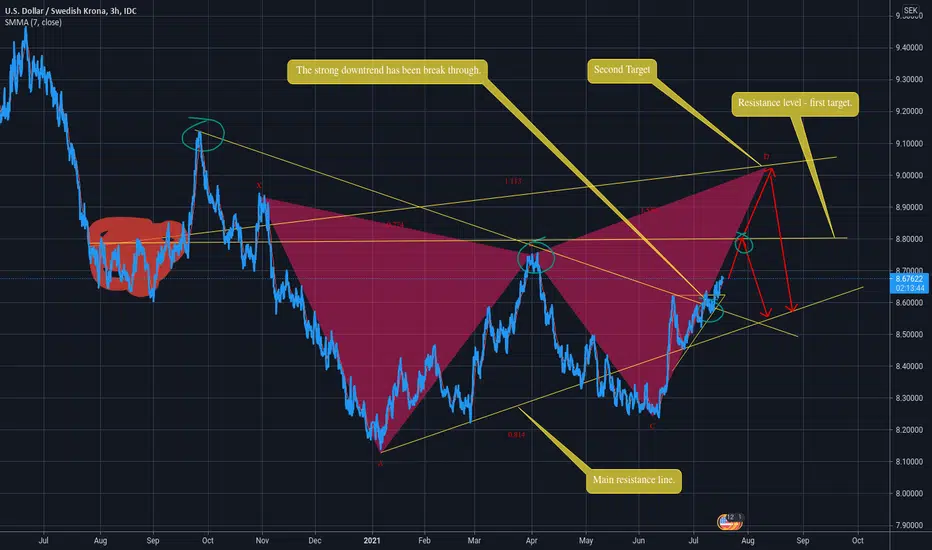
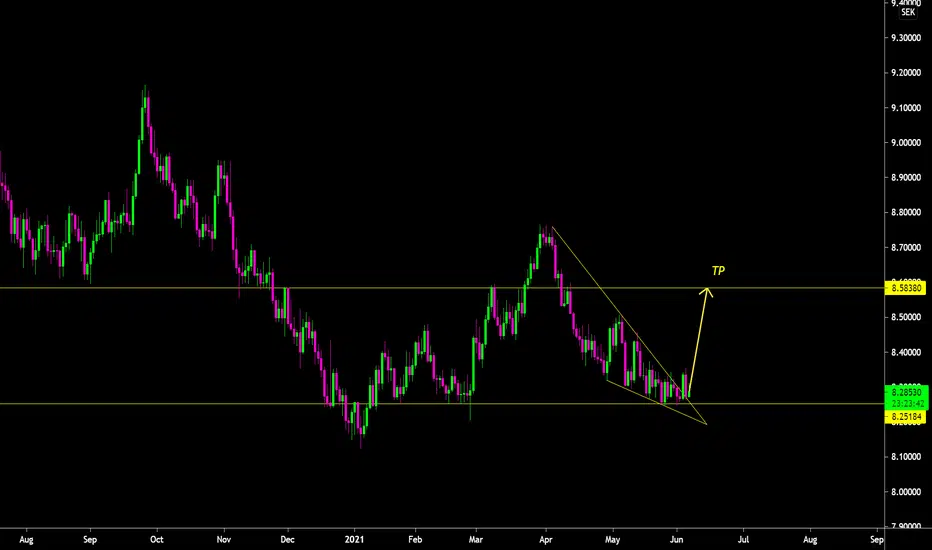
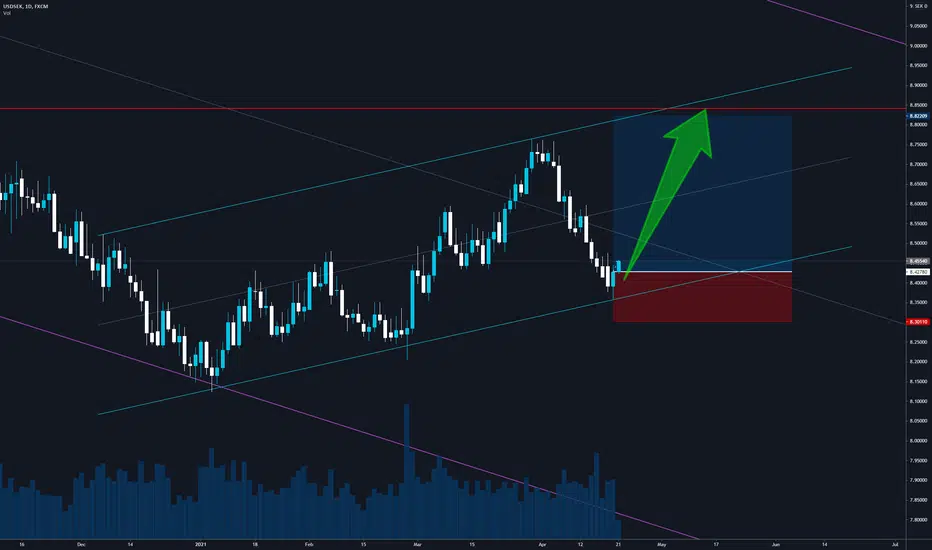
USD|SEKMost of the information is given in the graph.
Fast overview:
The upside triangle should result in an increase from 8.66 to 8.84 for two to three weeks.
Next, there are two possible developments: the first is that the price will go further, to values around 9. At this point the paths are also divided. The price can enter the channel formed by two resistance - support lines and continue in the horizontal (this scenario is not considered here). The second option is the completion of the formation of the pattern BAT at this level and planned pullback down to the values of 8.50.
Not a finance advise;)
This is my personal point of view.;)
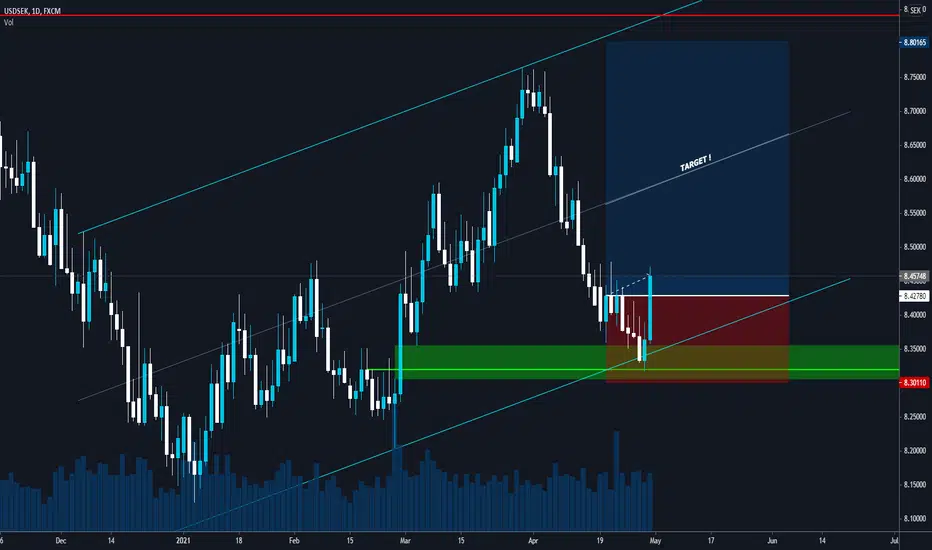
USD/SEK LONGUSD/SEK broke out of 7 month rectangle by 30 day ADX Criteria on Friday the 16th (over 69 PIP). Significant breakout. A bull back to the rectangle breakout area could occur. Last bar in the pattern is marked with a low. This is a decent classic chart pattern but the idea brought to be per @AndreasSteno. Much thanks. Newsletter specific recommendation (free) here: corporate.nordea.com
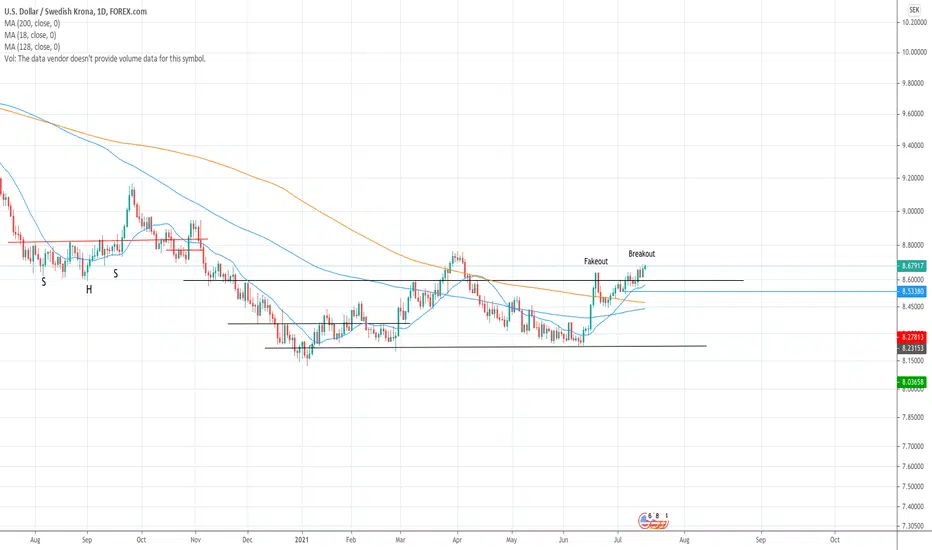
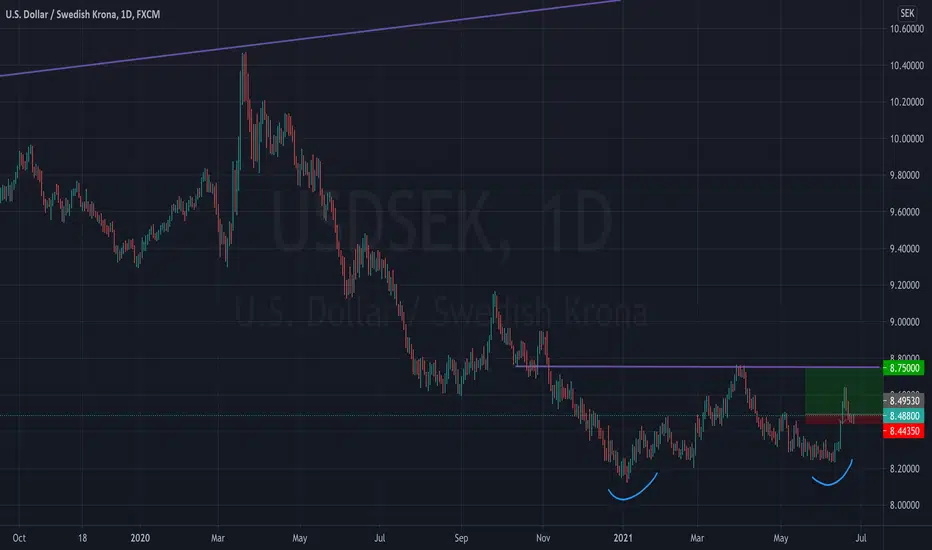
Long USD/SEK- Double bottom in the context of a megaphone and/or reverse triangle. Prices could go lower long term but appears to have caught a bid for now.
USDSEK Wave X ?BullishQuite likely.
We are in a general bearish pattern on this one, now in respite. The latest set of waves do not for a 5 wave impulse in my opinion. It just doesn't have the look, let alone fulfill the extension rules of EWT. It is more in line with "double two" that Mr Elliott described so many years ago. I am willing to put a number of fibgoals, more based on the huge zigzags preceding these short, small spurts of growth.
As always, this is not financial advice, so please do your own research.

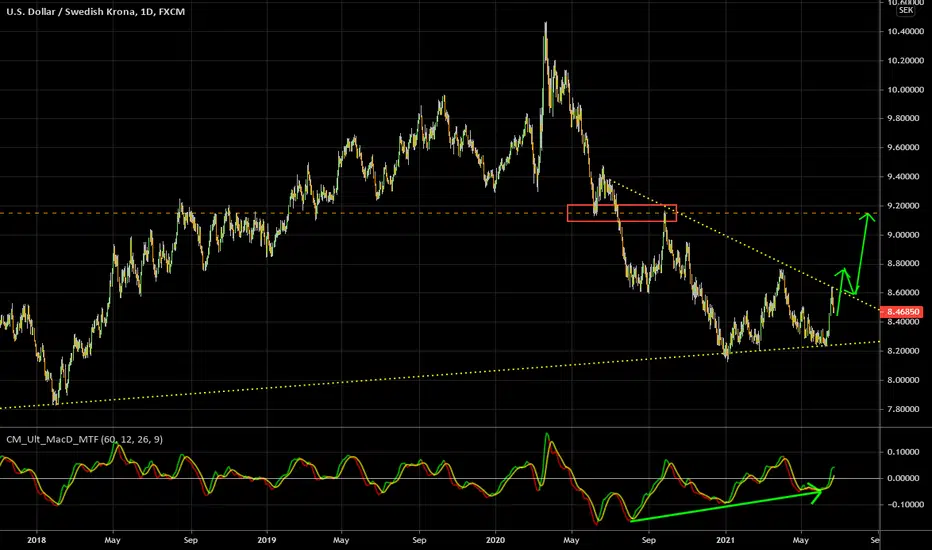
USDSEK long term buyLook at the chart: there's a skewed H&S pattern, long term trend line (support), and bullish pressure visible on MACD.
Switch to lower time frame and buy gradually starting from current pullback. Target is @9.15 (strong support/resistance level which held multiple times during past years).
Good luck.
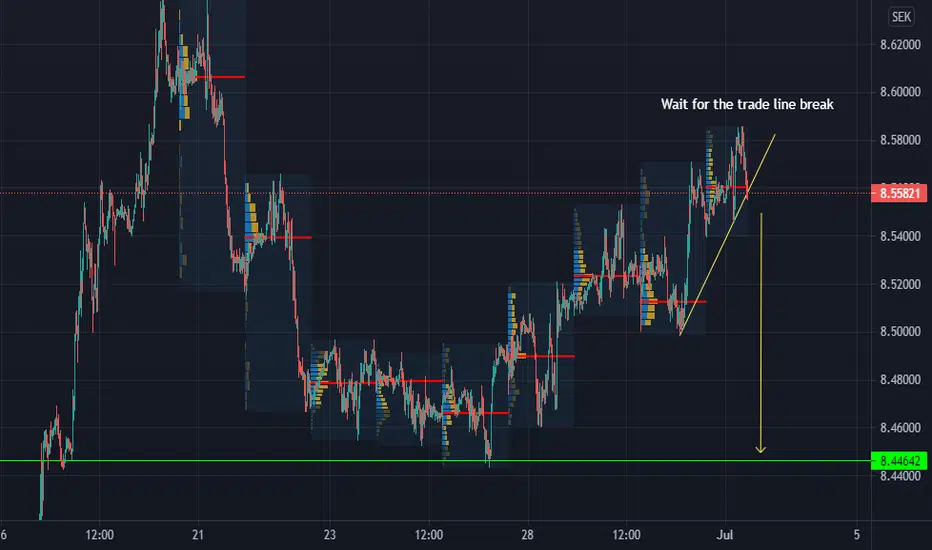
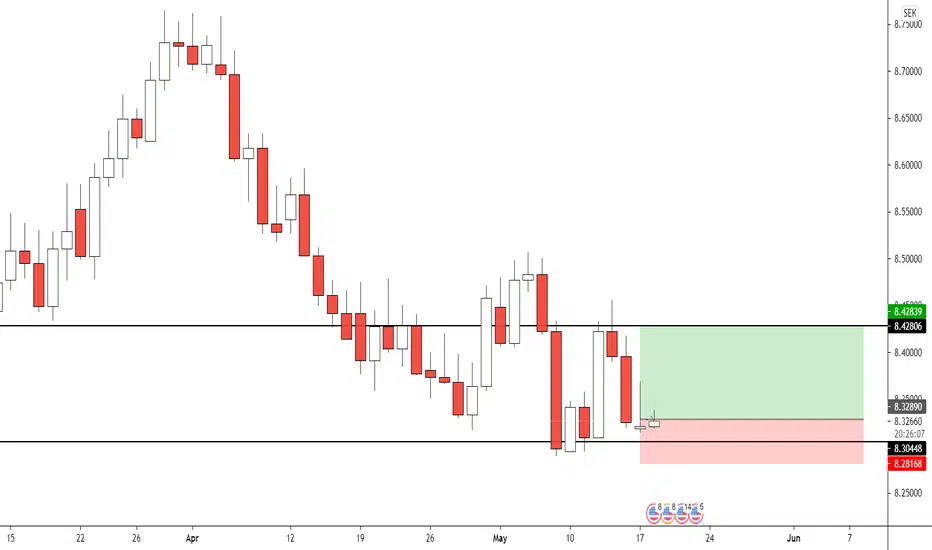
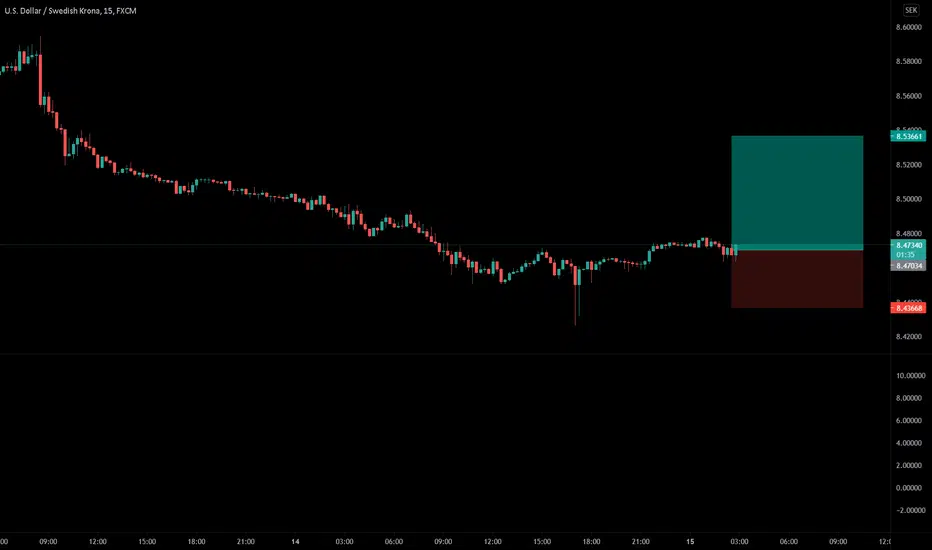
USDSEK LONG TRADE AS PRICE REJECTS SUPPORTSome bullish action happening at support and after seeing that pin bar/doji form at support I am going long and targeting previous Daily resistance.
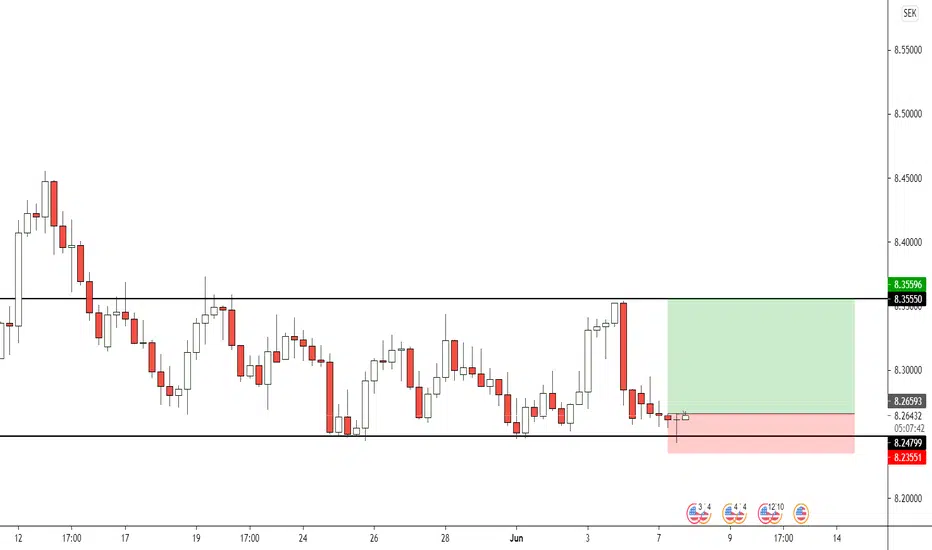
1HR USDSEK Long USDSEK Long
You can set a longer stop loss.
I would love to hear your feedback do you think the trade will complete in profit or will the stop loss get hit!?
This is not financial advise, trade at own risk.
USDSEK LONG TRADEI am going long after seeing an inverted hammer print on the Daily chart at support. This candlestick is my favorite reversal candlestick because of the great R:R and reliability is provides. I will be targeting previous Daily resistance.
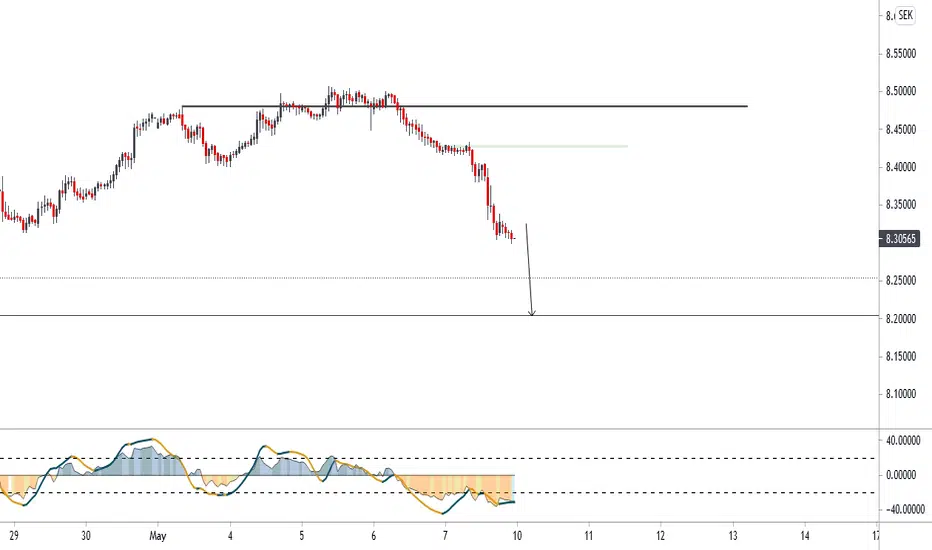
USDSEK ForecastIt's been some time since we checked on this one. It looks bearish.
.
Khiwe
At this profile page, the shared analysis, ideas and also, the strategy of a chart belong to Khiwe with some being influenced. The technical set-ups are speculative, they are not guaranteed for accuracy or in completeness in the form of any content; -it is not to advice on financial markets. Please apply your own analysis and confirm it with price action.
USDSEKThe USDSEK increased 0.0987 or 1.18% to 8.4668 on Friday April 30 from 8.3681 in the previous trading session.
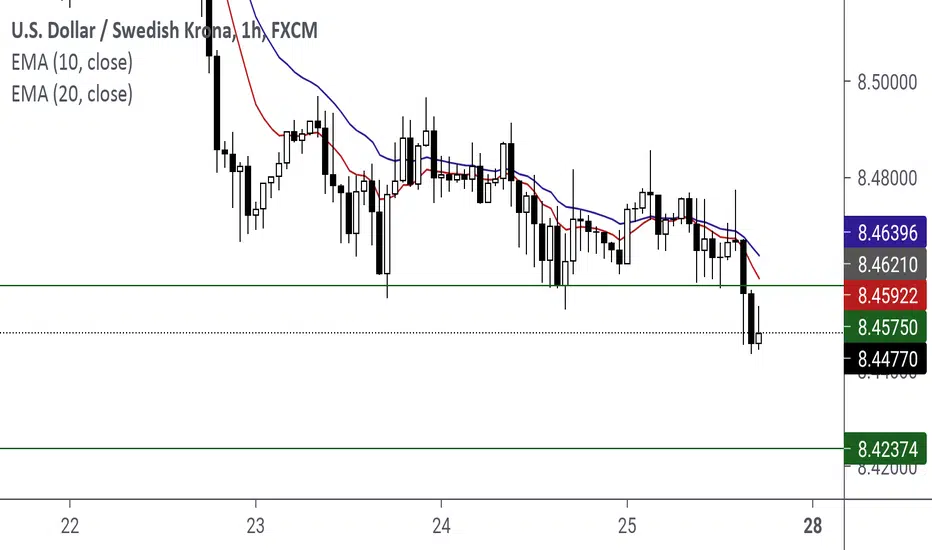
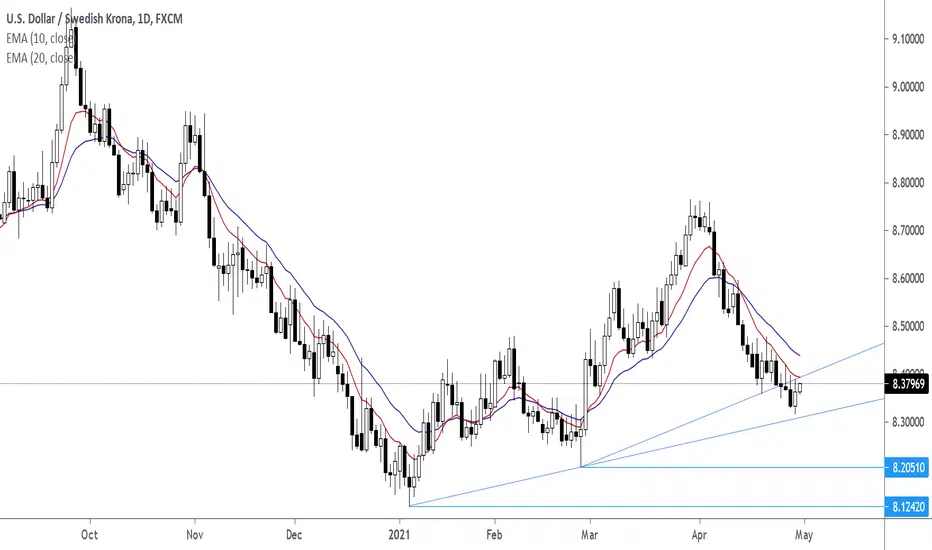
USDSEK Lower Highs On The Daily Chart, Weekly Chart, H4 ChartLower Highs are pushing into trend line support. Wait for confirming price action signal like a pin bar for an entry. Lower Highs are present on the Daily, Weekly Chart, and H4 Chart.
EMA 10 EMA 20 are pointing downwards on the time frames mentioned.

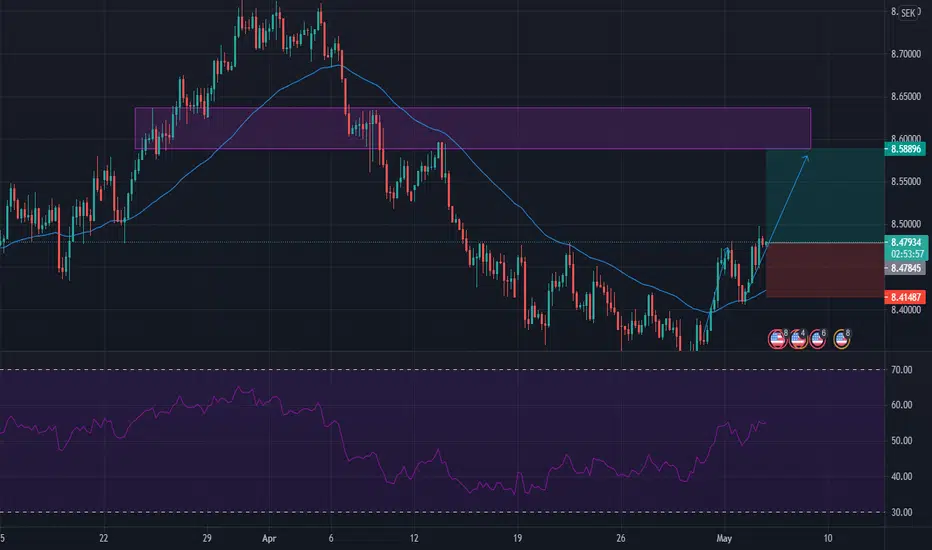
USDSEKHello traders
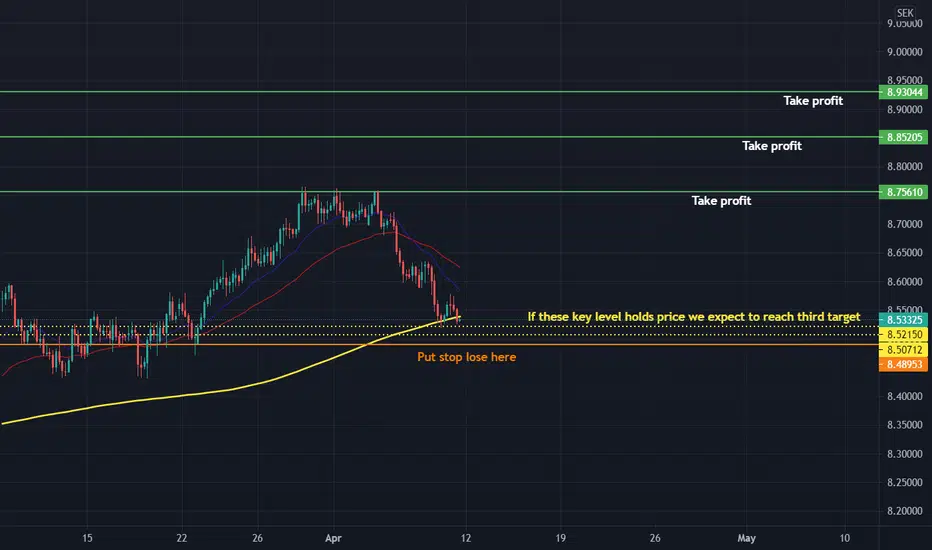
If these key level holds price it hits third take profit
These analyzes based on Fibonacci
Fibonacci Moving average's and also RSI Divergence in 1h time frame it all says buy
Good luck ...............