0.70 THB
1.14 B THB
13.88 B THB
About JAYMART GROUP HOLDINGS PC
Sector
Industry
CEO
Adisak Sukumvitaya
Website
Headquarters
Bangkok
Founded
1988
ISIN
TH1007010R12
FIGI
BBG000N2H7Z7
Jaymart Group Holdings Public Co., Ltd. is a holding company, which engages in retailing and wholesaling business for mobile phone and related products. It operates through the following segments: Trading, Debt Collection, Rental, and Others. The company was founded by Adisak Sukumvitaya and Yuvadee Pong-acha on December 27, 1988 and is headquartered in Bangkok, Thailand.
Related stocks

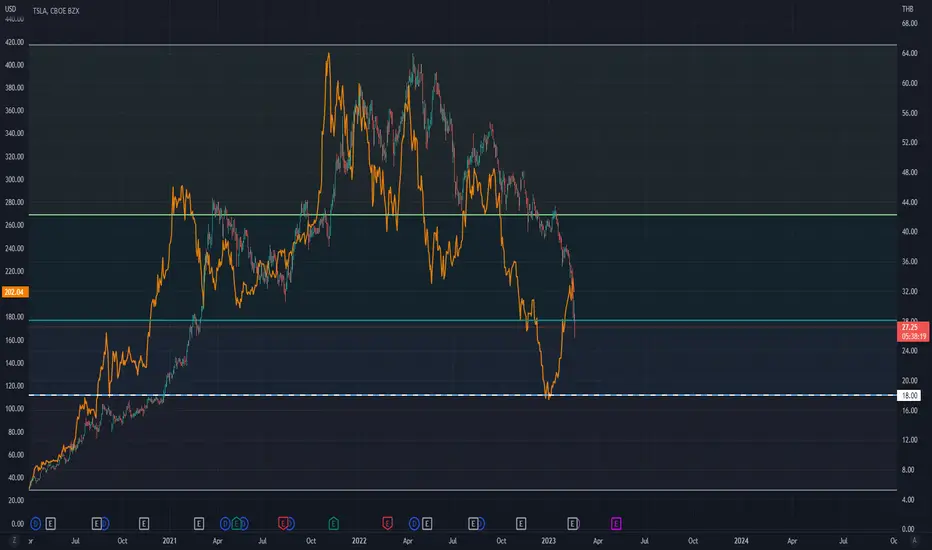
JMART has a similar price structure to TSLABased on the recent movement of JMART price, it has experienced a decline of over 61.8% retracement. As a result, it is highly likely that the price will reach the target price of 18, which represents the next level of retracement.
Nevertheless, I personally believe that JMART has the potential to
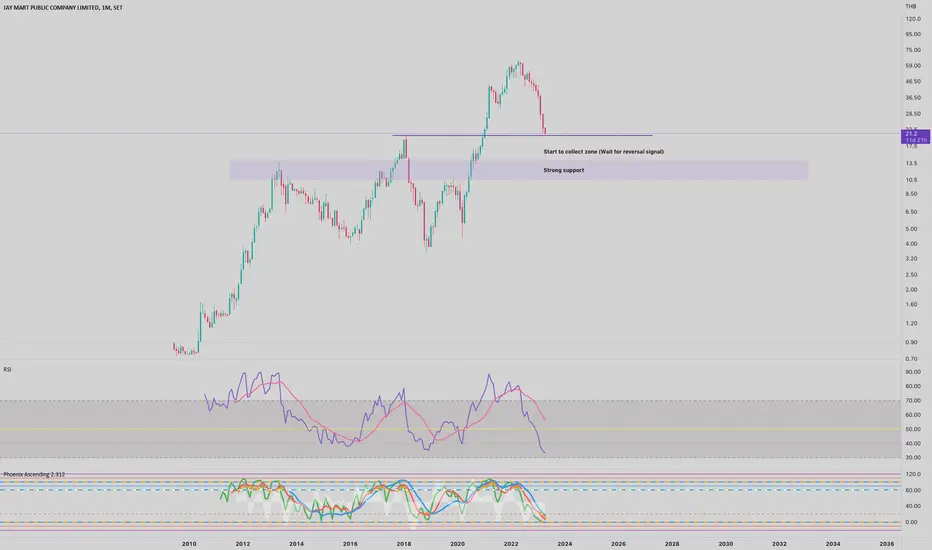
JMartfrom RSI monthly may be its safer to buy when u feel unsafe ?
Everything on chart, Trade safe n fun
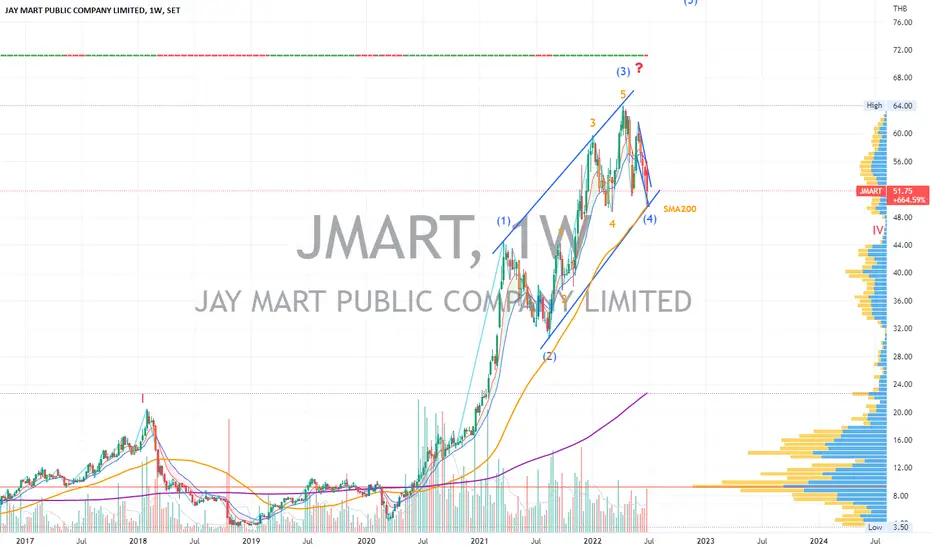
JMART | Wave Projection | Target Downtrend Reversal BreakoutPrice action and chart pattern trading setup
> Contracting Wave Channel pattern with downtrend target around the corner.
> Entry @ minor downtrend channel in daily timeframe breakout above SMA200
> TP1 @ wave (3) position
> TP2 @ wave (5) III position for medium term
> Stoploss @ SMA200 downside -9
Jmart Day 48.75 (at the end of the road, prepare to go down)Jmart Day 48.75 (at the end of the road, prepare to go down)
+1. Price Arrival at the end of the road 2.618%
+2. The 50.50-50.75 line is a significant resistance.
caused by the overlapping of the Fibo line
---------
Sell strategy
First target 45.75-46.50 if unable to stand down
Target two 42.75-43

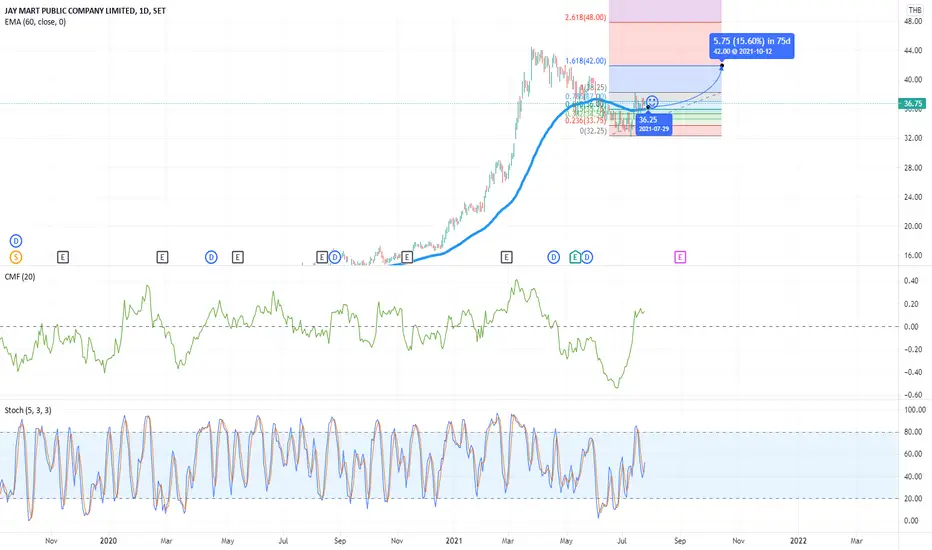
Nice Uptrend pattern for JMARTLong Jmart at 36.5 or someshit, If price stay above EMA with this momentum from STO UP and CMF+CCI it will hit 1st target@42 and 2d @ 48
No sl Yolo
JMART breaks 52 weeks high againThe stock volume and trend is decent. The only question is whether it can break all-time high resistance and continue this long uptrend or not.


See all ideas
Summarizing what the indicators are suggesting.
Oscillators
Neutral
SellBuy
Strong sellStrong buy
Strong sellSellNeutralBuyStrong buy
Oscillators
Neutral
SellBuy
Strong sellStrong buy
Strong sellSellNeutralBuyStrong buy
Summary
Neutral
SellBuy
Strong sellStrong buy
Strong sellSellNeutralBuyStrong buy
Summary
Neutral
SellBuy
Strong sellStrong buy
Strong sellSellNeutralBuyStrong buy
Summary
Neutral
SellBuy
Strong sellStrong buy
Strong sellSellNeutralBuyStrong buy
Moving Averages
Neutral
SellBuy
Strong sellStrong buy
Strong sellSellNeutralBuyStrong buy
Moving Averages
Neutral
SellBuy
Strong sellStrong buy
Strong sellSellNeutralBuyStrong buy
Displays a symbol's price movements over previous years to identify recurring trends.