SET
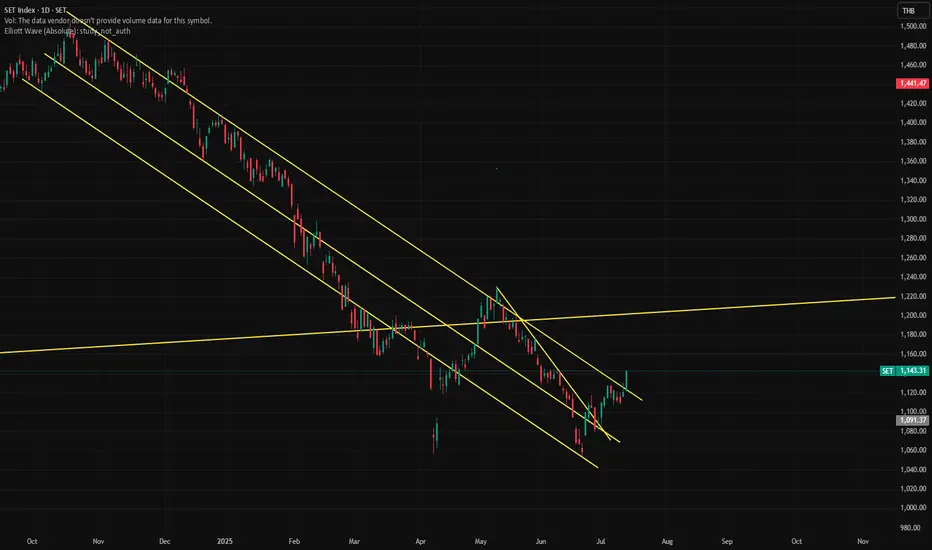
Apil 2025 since the price is oversold from Feb2025 price still drop contrary with momentum
BigBlack candle followed by exhaustion gap at exactly the end of wave 5 of C
Pattern Double Bottom, Island Reversal
Be careful with the false break out at 1,250. Look closly at the momentum
Around 1,100
Related indices

The SET Index has recently retested a major long-term support The SET Index has recently retested a major long-term support level, with the latest monthly candle showing a strong rebound. The large green candle clearly reverses the direction of several previous months' declines, suggesting a potential shift in market sentiment.
This decisive price action indi

Analysis on SET INDEX: After the target hit, what comes nextDear All
Currently, SET INDEX has reached 1245- 1250 and on the first day, it can hold at this level.
However, once the tax news released, not only it fail to make new high, it fell drastically.
As a result, it can be concluded that the upward momentum is now ceased.
Also, with the big red, the
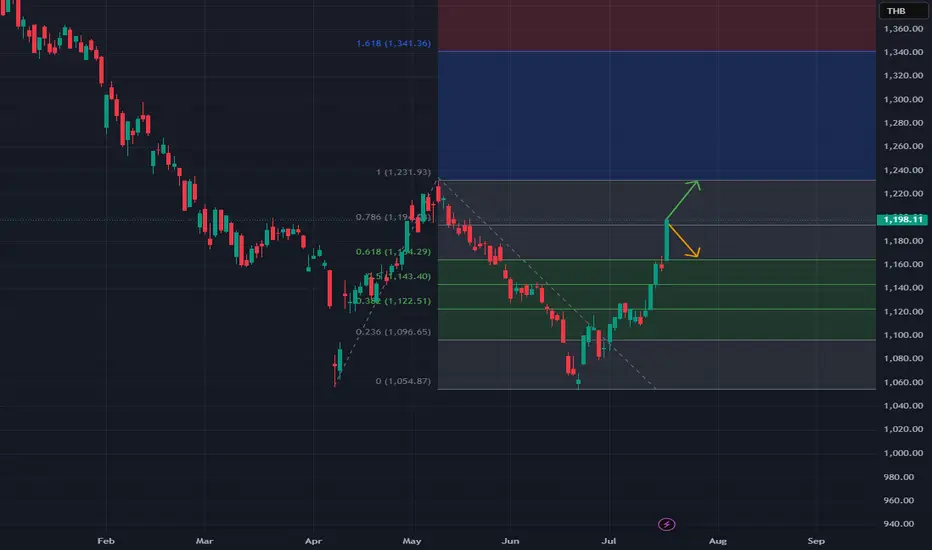
Analysis on SET INDEX (Cont.): Wait And See StageDear All
After a month, SET index reach its target at 1200.
Now it enter the new side way zone: 1185-1200.
The possibilities include
1. Break 1200, Next target 1230 ****
2. Drop Below 1185,
2.1 Next target 1160
2.2 Drop Below 1160
Best regard,
Trader PP
Analysis on SET INDEX: Time to BetHey yo,
Today, SET index create the very strong rejection bar.
As a result, the overall momentum become upward despite being downtrend.
As i analyzed down into the smaller timeframe,
I think how they would behave can be decided into 2 cases.
First, can stay above 1095, it would likely hit the 1
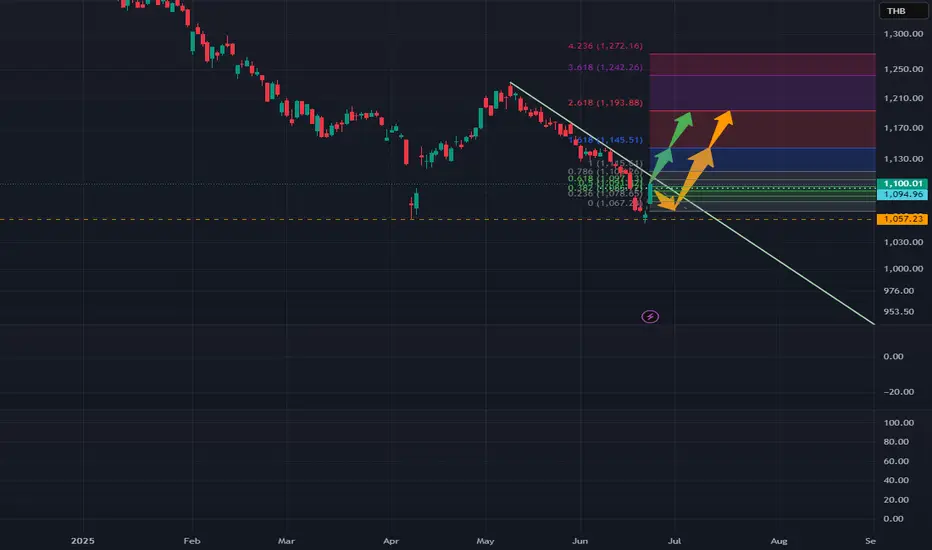
Analysis on SET INDEX: Time to bet (Continued)Dear All
Continued from the previous post,
It seem to choose to come down first before rising up.
So now, it is easy to plan the trade, as long as
There is buying flow coming around 1063 1053 // that would be the best point to buy.
But if broken, the long bias set up will become incorrect and cut
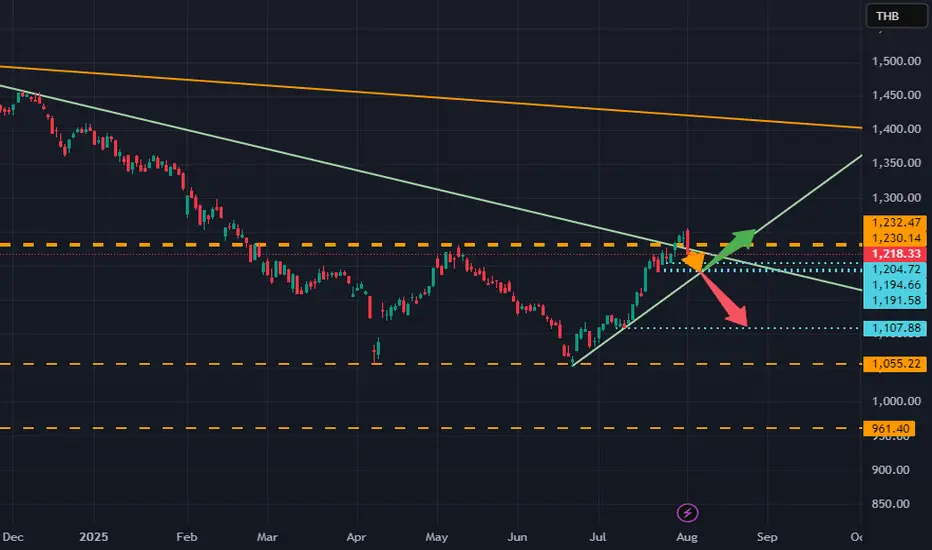
Set Breaking up downtrend channelHi there!!
Set Breaking up downtrend channel , This sign may be similar double bottom pattern ??
Focus and see
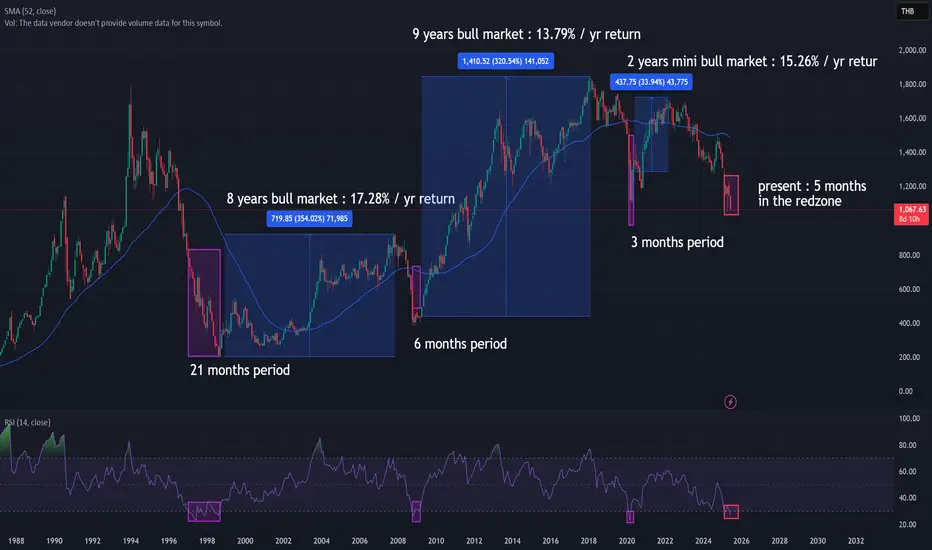
SET's 4th time RSI(50m)< 30 since it's inceptionEvery time the SET Index enters the RSI "red zone" (oversold territory), the long-term outcome has consistently been positive. Historically, the following 8–10 years have delivered strong returns, with some bull markets reaching over 15% annually.
The duration of time spent in this red zone has al
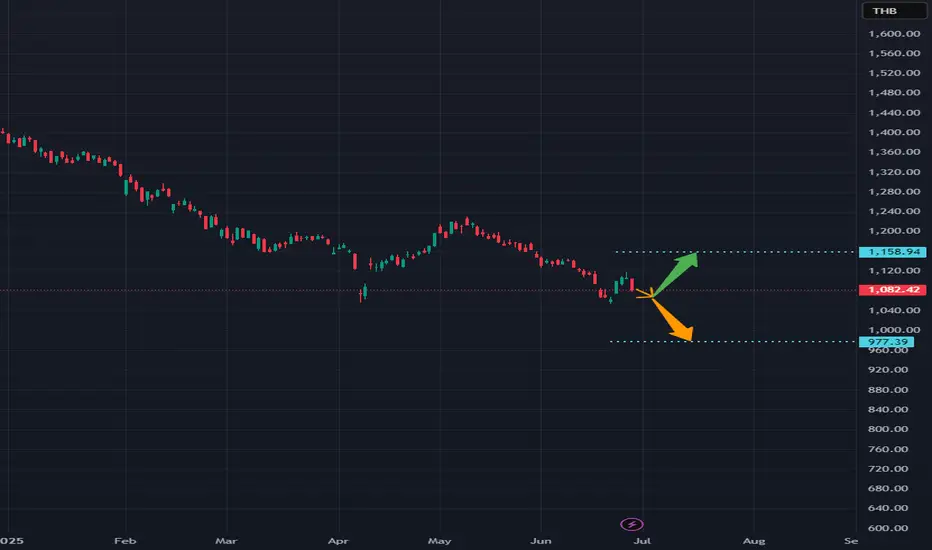
Analysis on SET INDEX: Almost the best time to buyHi All,
Long time no see,
As SET Index rally up in the beginning of the year,
Now it retrace back to make the second leg.
So, you should prepare yourself for this opportunity
Best Regards,

SET : Short term support & resistanceAs shown in the chart, the stock is currently trading between well-defined support and resistance levels on the weekly timeframe. The long-term support zone aligns with the historical low established during the last major market crisis, which has been retested recently. This confluence suggests a st

See all ideas
Summarizing what the indicators are suggesting.
Oscillators
Neutral
SellBuy
Strong sellStrong buy
Strong sellSellNeutralBuyStrong buy
Oscillators
Neutral
SellBuy
Strong sellStrong buy
Strong sellSellNeutralBuyStrong buy
Summary
Neutral
SellBuy
Strong sellStrong buy
Strong sellSellNeutralBuyStrong buy
Summary
Neutral
SellBuy
Strong sellStrong buy
Strong sellSellNeutralBuyStrong buy
Summary
Neutral
SellBuy
Strong sellStrong buy
Strong sellSellNeutralBuyStrong buy
Moving Averages
Neutral
SellBuy
Strong sellStrong buy
Strong sellSellNeutralBuyStrong buy
Moving Averages
Neutral
SellBuy
Strong sellStrong buy
Strong sellSellNeutralBuyStrong buy
Displays a symbol's price movements over previous years to identify recurring trends.