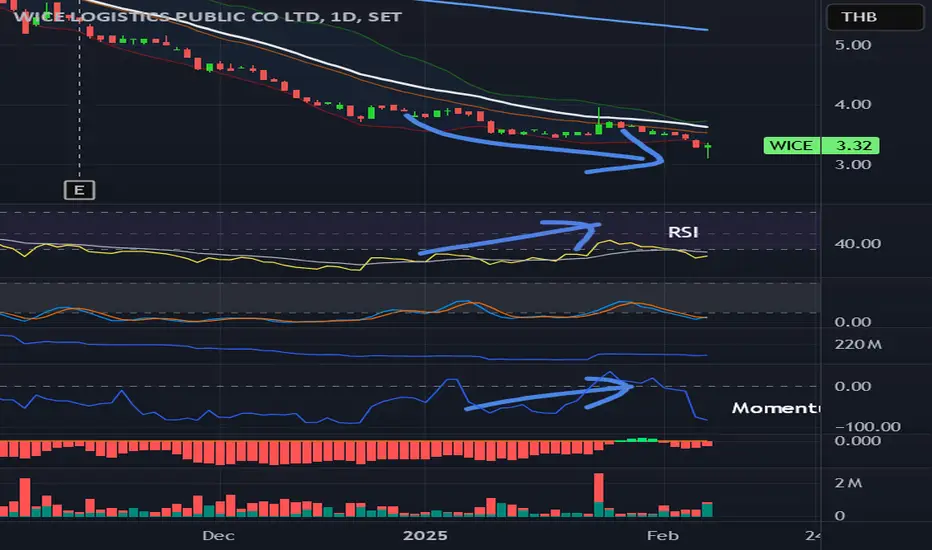
WICE is going up to test EMA25 for a new round.Support 3.28 , stop loss 3.20
from this day graph, rsi and momentum have shown divergent trend since new year, with the latest long lower wig with almost all are negative delta values with ask imbalance on the side.
IMO, 3 positive deltas make it not that bull, but overall chance will be going up a
0.18 THB
97.73 M THB
4.10 B THB
About WICE LOGISTICS PUBLIC CO LTD
Sector
Industry
CEO
Araya Kongsoonthorn
Website
Headquarters
Bangkok
Founded
1993
ISIN
TH6651010R12
FIGI
BBG009NZ1J95
WICE Logistics PCL engages in the provision of international air and sea freight forwarding, customs broker, inland transportation, cross-border transport, multimodal transport operator, warehousing service, and all freight related services for imports and exports. It operates through the following segments: Sea Freight, Air Freight, Cross-Border Service, and Supply Chain Solution. The company was founded in May 1993 and is headquartered in Bangkok, Thailand.
Related stocks
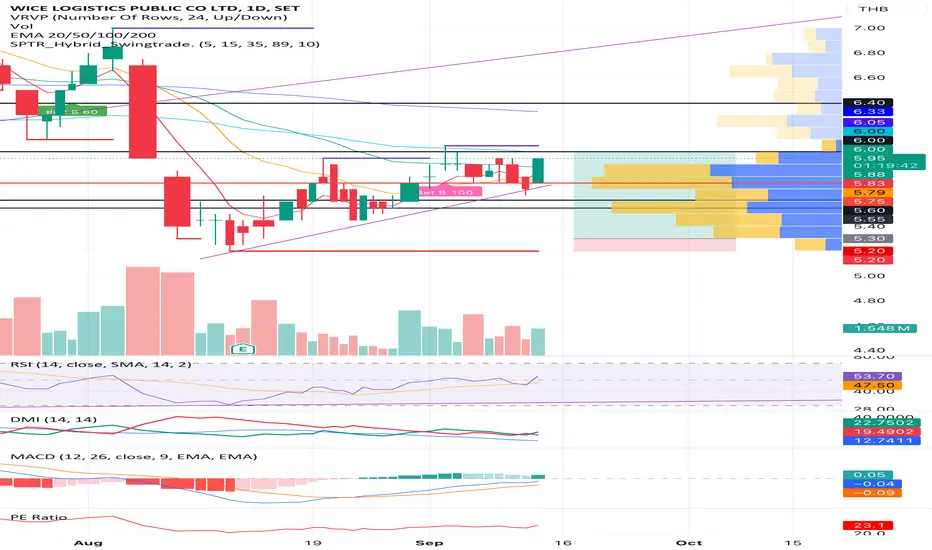
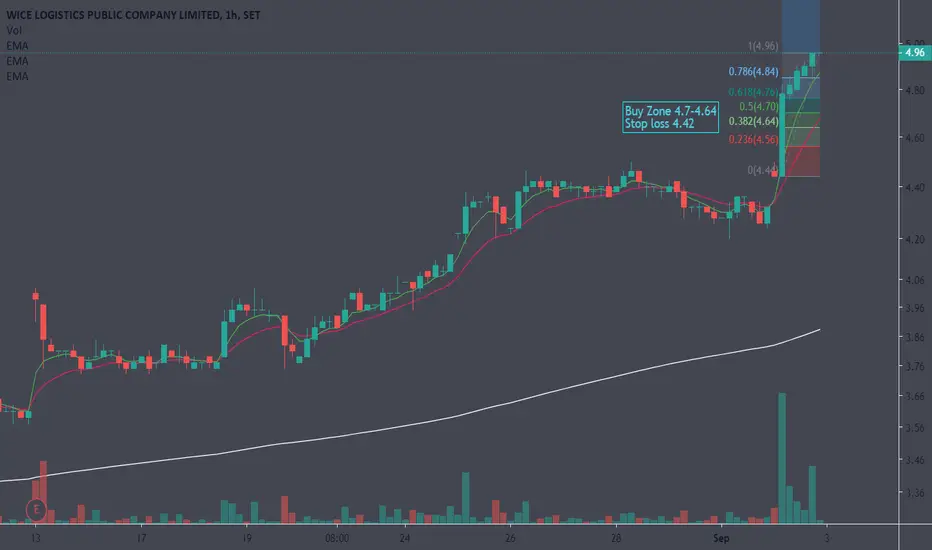
WicePlan for collection
Base on Ema and drawdown under 6
Cut loss at5.65 when it close
Duke 12-9-2024
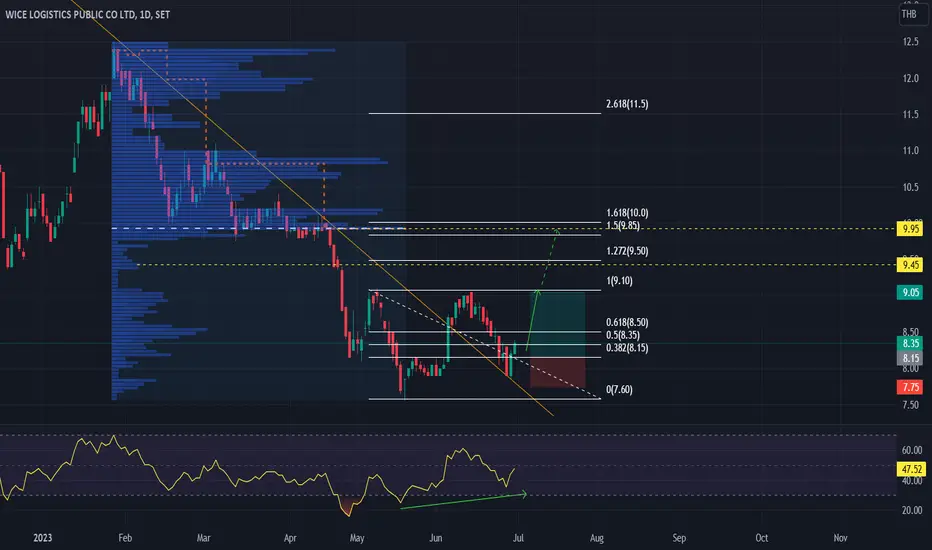
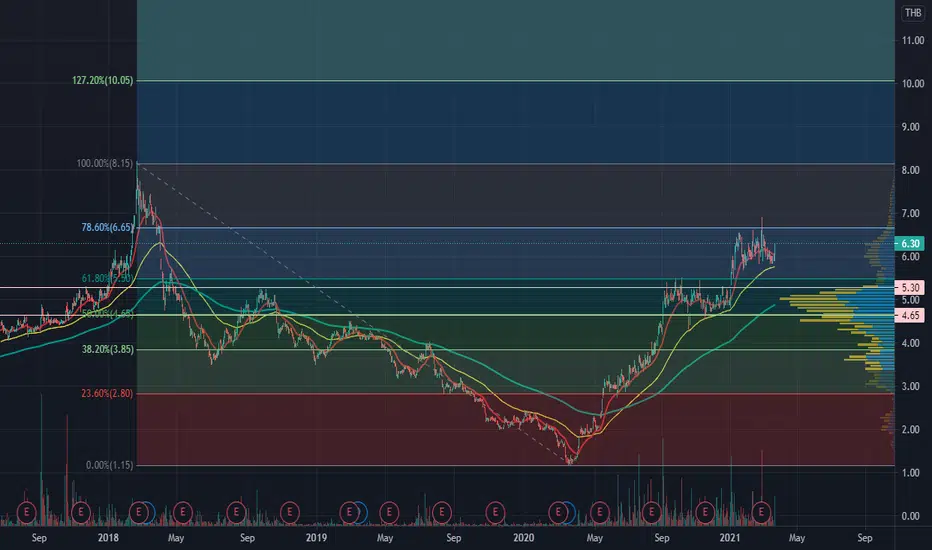
Wice breaks a down trend line.WICE can break a down trend line with a higher low. So, we can set a trading strategy as LONG position and set a target at the resistance level around 9 THB.
Moreover, if it can break 9 THB, we can expect a target profit by using a combination between FIBO extension and Fixed range analysis. These
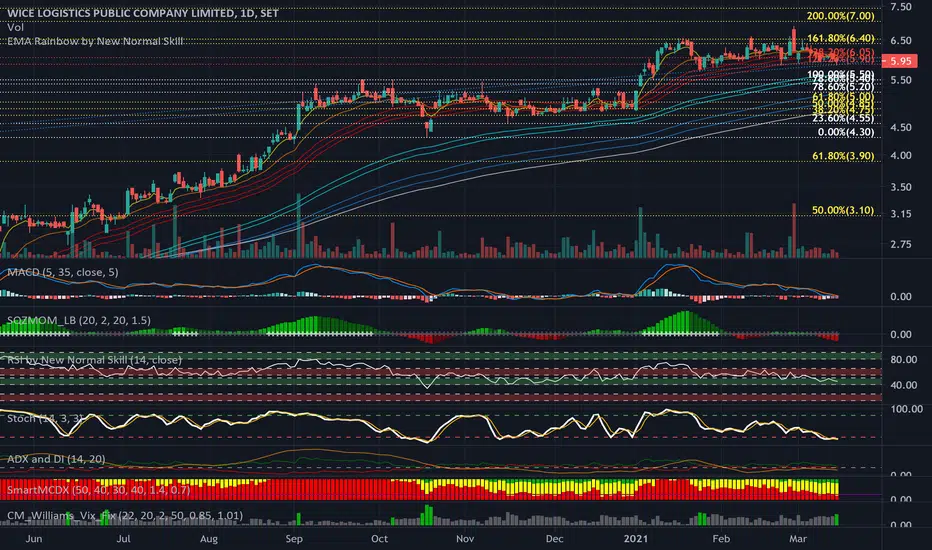
WICE - weekly chartAfter profit taking by Insti investors due to slower profit. Share price is now parking at EMA200 weeks with stable profit QoQ. However, China's re-openining policy, WICE is expected to get back to the track once again.
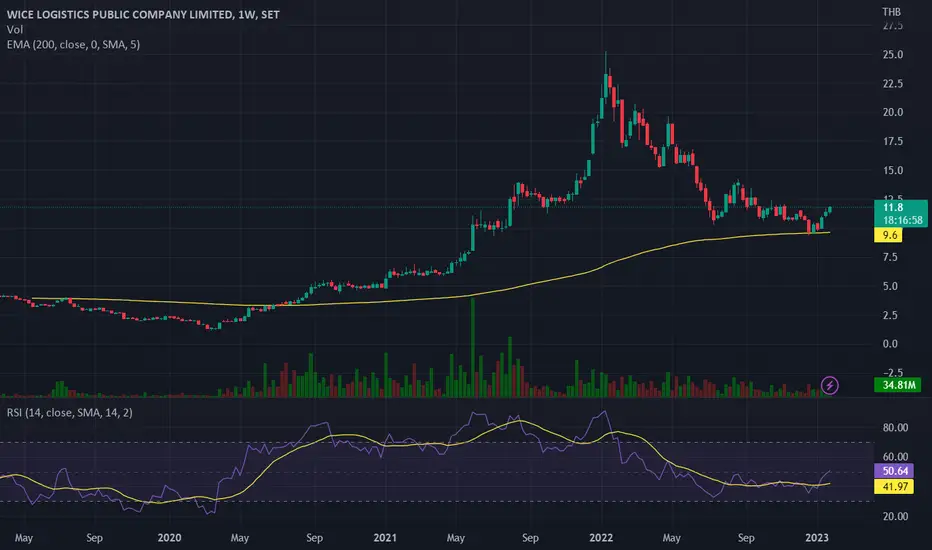
Wice is one stock with strong fundamental support. SET:WICE
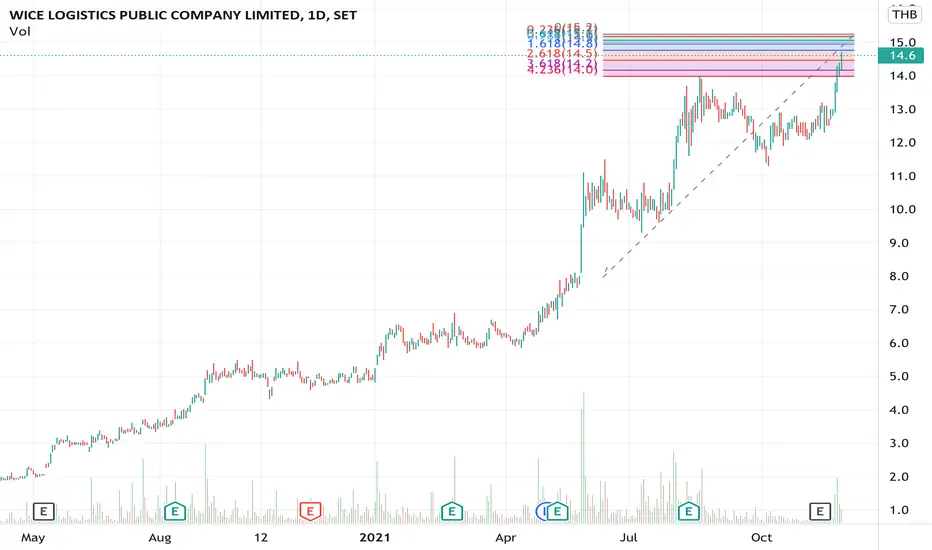
Wice is one of my favorite stocks which has profit over Covids19 and still keep in the strong trend in price until hit new ATH at 14.00 baht.
The Fibonacci extension target will be 14.7 and next 15.9.
However the price is going up around 100% this year, please consider to invest.
See all ideas
Summarizing what the indicators are suggesting.
Oscillators
Neutral
SellBuy
Strong sellStrong buy
Strong sellSellNeutralBuyStrong buy
Oscillators
Neutral
SellBuy
Strong sellStrong buy
Strong sellSellNeutralBuyStrong buy
Summary
Neutral
SellBuy
Strong sellStrong buy
Strong sellSellNeutralBuyStrong buy
Summary
Neutral
SellBuy
Strong sellStrong buy
Strong sellSellNeutralBuyStrong buy
Summary
Neutral
SellBuy
Strong sellStrong buy
Strong sellSellNeutralBuyStrong buy
Moving Averages
Neutral
SellBuy
Strong sellStrong buy
Strong sellSellNeutralBuyStrong buy
Moving Averages
Neutral
SellBuy
Strong sellStrong buy
Strong sellSellNeutralBuyStrong buy
Displays a symbol's price movements over previous years to identify recurring trends.