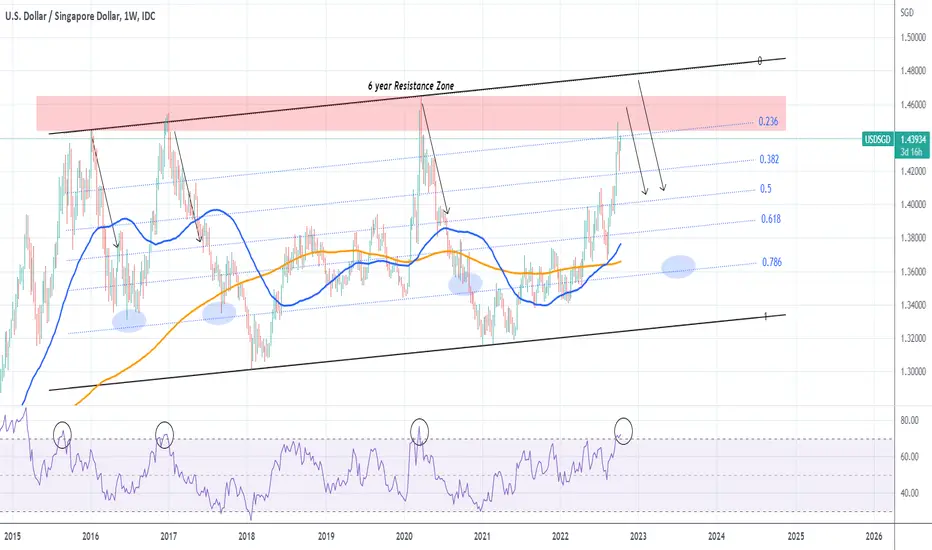
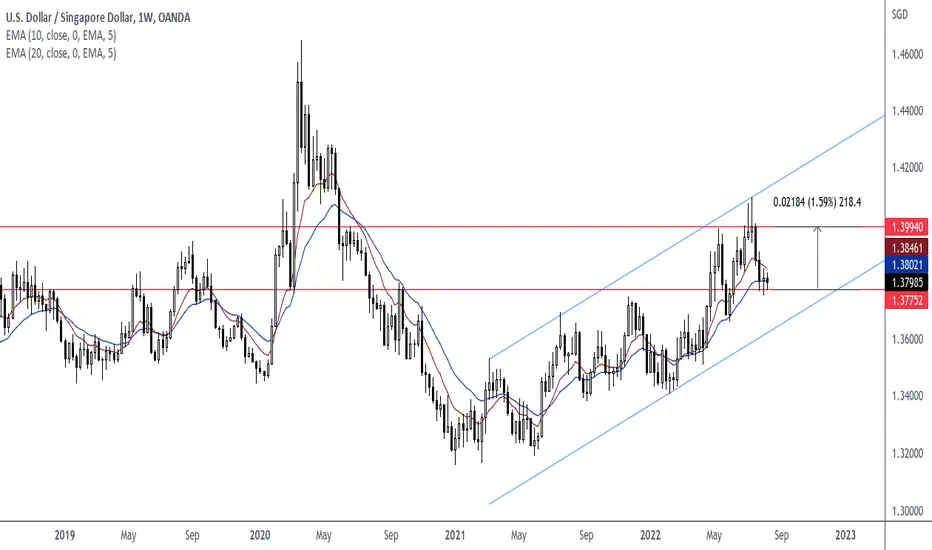
USDSGD Entered its 6 year Resistance Zone.The USDSGD pair has entered a Resistance Zone where it has made long-term tops and got rejected since January 2016. Even if the long-term pattern is a Channel Up, technically there isn't much room for further growth before a correction near the 0.786 Fibonacci retracement level at least.
It is interesting to see also that all rejections had the same aggressive sell-off behind them, reaching the middle of the Channel (0.5 Fib) in a matter of 2-3 months. Also check the 1W RSI. Strong rejections took place once it broke above the 70.000 overbought barrier. Right now we are above it.
-------------------------------------------------------------------------------
** Please LIKE 👍, SUBSCRIBE ✅, SHARE 🙌 and COMMENT ✍ if you enjoy this idea! Also share your ideas and charts in the comments section below! This is best way to keep it relevant, support me, keep the content here free and allow the idea to reach as many people as possible. **
-------------------------------------------------------------------------------
You may also TELL ME 🙋♀️🙋♂️ in the comments section which symbol you want me to analyze next and on which time-frame. The one with the most posts will be published tomorrow! 👏🎁
-------------------------------------------------------------------------------
👇 👇 👇 👇 👇 👇
💸💸💸💸💸💸
👇 👇 👇 👇 👇 👇
SGDUSD trade ideas
With USD strengthening, Usdsgd should be for a LONG***************************************************************************************
Hello there!
If you like my analysis and it helped you ,do give me a thumbs ups on tradingview! 🙏
And if you would like to show further support for me, you can gift me some coins on tradingview! 😁
Thank you!
Disclaimers:
The analysis shared through this channel are purely for educational and entertainment purposes only. They are by no means professional advice for individual/s to enter trades for investment or trading purposes.
The author/producer of these content shall not and will not be responsible for any form of financial/physical/assets losses incurred from trades executed from the derived conclusion of the individual from these content shared.
Thank you, and please do your due diligence before any putting on any trades!
USDSGD Looking For A Fade Ahead of 1.44In this update we review the recent price action in the USDSGD and identify the next high probability trading opportunity and price objectives to target

USDSGD POSSIBLE SHORT ON BREAK OF TRENDLINEWe could see SHORT positions if we break the up trendline and close below 1.4000. At that point we will have confirmed M pattern or a Double Top.

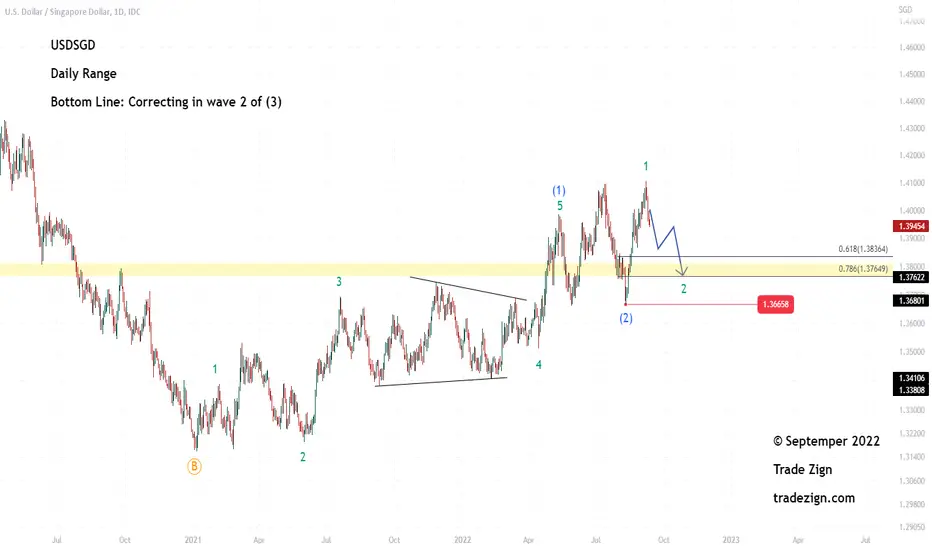
USDSGD idea (13/09/2022)USDSGD
We expect the continuation of the decline and correction on the pair in the coming period to end the correction in wave 2, and the correction may end at the 61% level at 1.3836 prices or the 78% level at 1.3764 prices before rising again
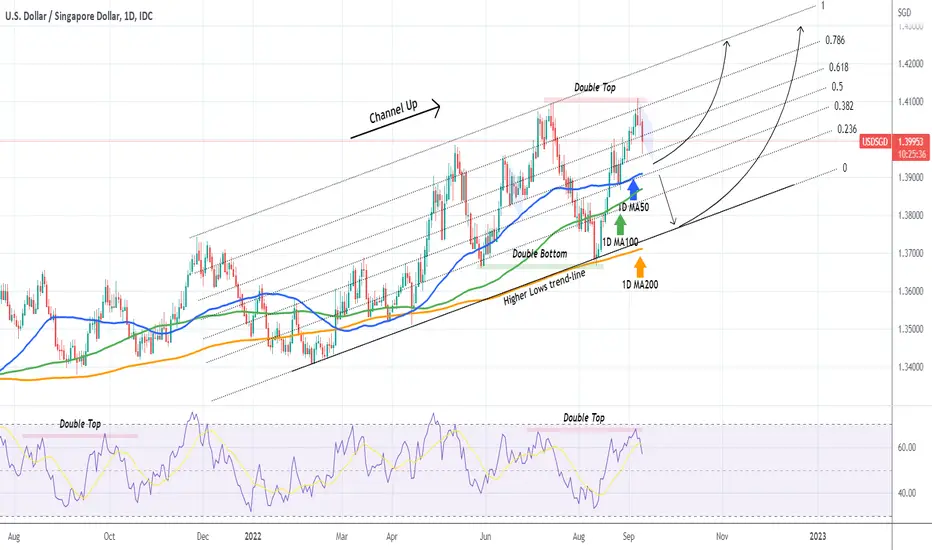
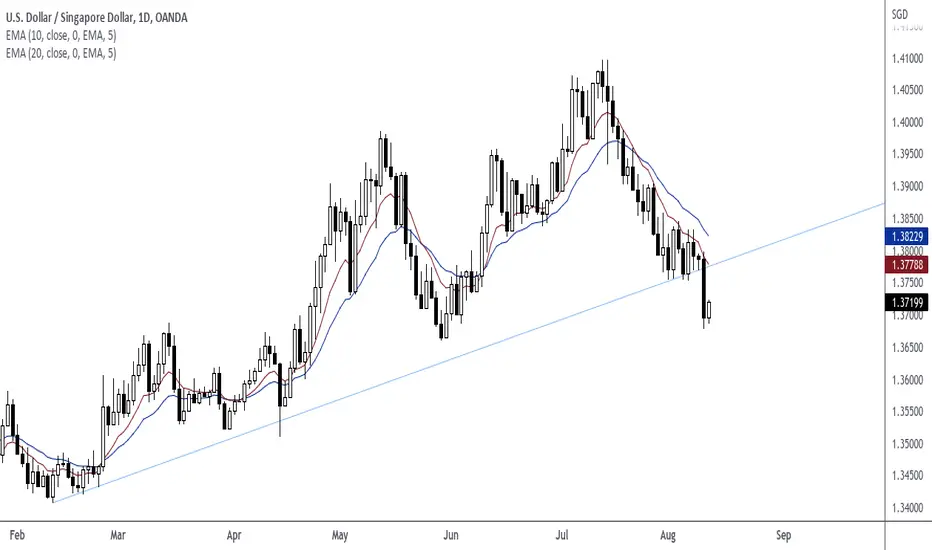
USDSGD pulling back. Two levels to buy.The USDSGD pair made a Double Top rejection two days ago and is currently on a strong bearish 1D candle. With the 1D RSI also rejected on a Double Top last since in September 29 2021, the next level to consider entering is just above the 1D MA50 (blue trend-line), which is where the June 16 Bull Flag found Support. A 1D candle close below the 1D MA50, should target the bottom of the long-term Channel, just above the 1D MA200 (orange trend-line), which is where the last two Higher Lows were formed on August 11 2022 and April 14 2022.
--------------------------------------------------------------------------------------------------------
** Please support this idea with your likes and comments, it is the best way to keep it relevant and support me. **
--------------------------------------------------------------------------------------------------------
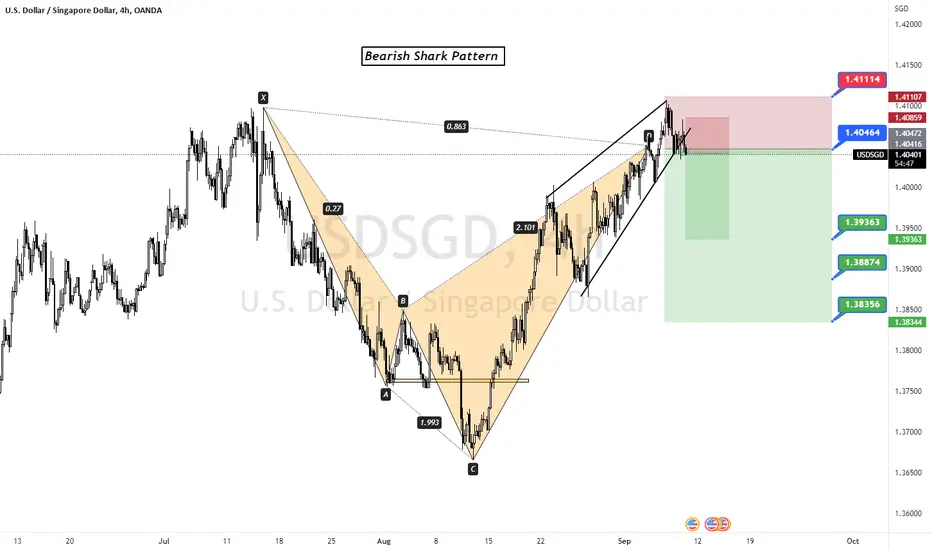
Bearish Shark Pattern (USDSGD)Beautiful formation of shark pattern respecting 0.886% of XC and
2.24% of BC. Entry is perfect as it forms an inverted hammer at Daily TF.
TP 1 and TP 2 are setup @0.38% and @ 50% of CD respectively. It will then
follow a 5-0 pattern opening a bullish entry at the 50% fib level.
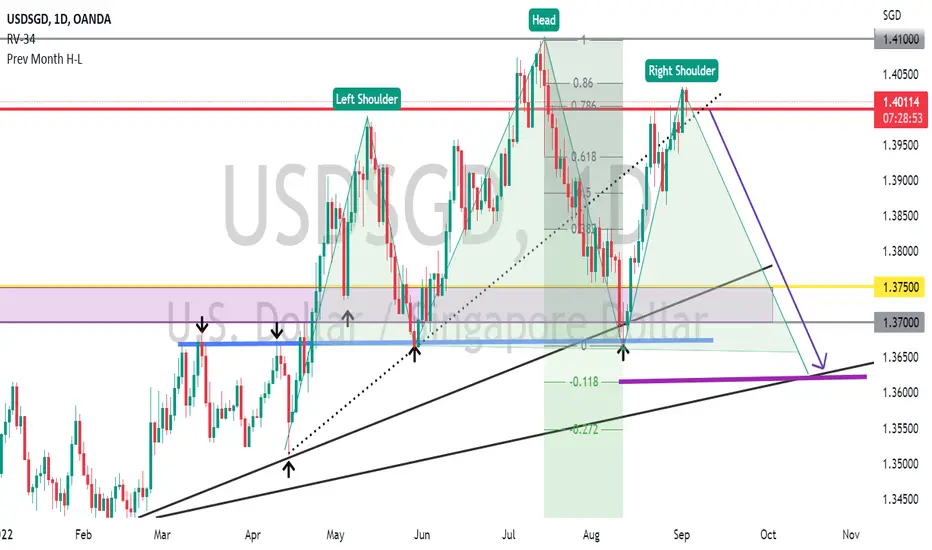
USDSGD HEAD AND SHOULDER PATTERN - SHORT SWINGWe are looking at a possible reversal. Head and Shoulder Pattern with a 88.6% deep Fib Retracement. Looking to Take Profits and trade all the way to 1.18 Fib Projection.
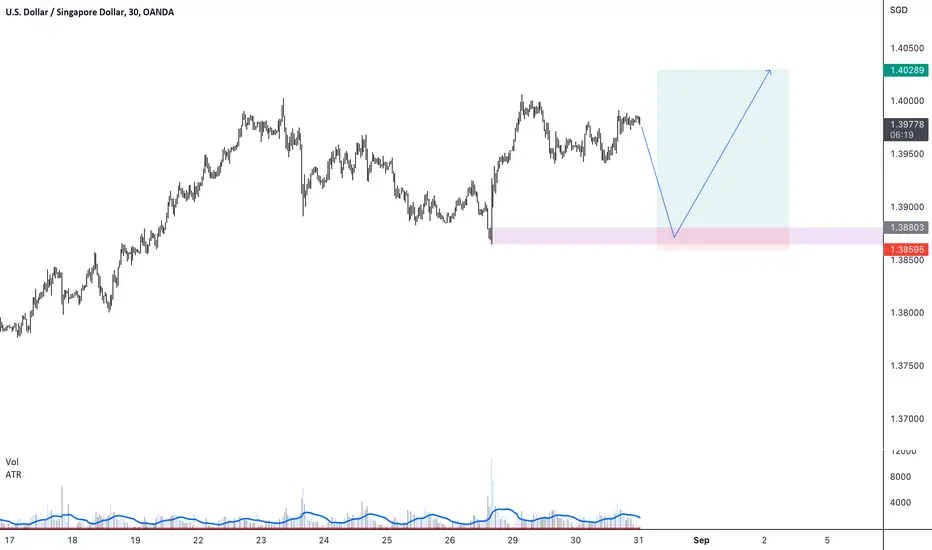
Long USDSGDAccording to the big time frames the trend is uptrend so wait to take a position at 1H demand zone.
USDSGD short Head and shoulder pattern on daily
Rejecting the shoulder and starting to create lower lows on 4 hour.
Respecting the right shoulder
Watched this last week and respected the neck.

My Weekly Analysis 39 Pt. 3I go through my currency pairs and analyze them while listening to music and talk to you guys.
*not a financial advisor*

My Weekly Analysis 39 Pt. 2I go through my currency pairs and analyze them while listening to music and talk to you guys.
*not a financial advisor*

USDSGD LONG POSSIBILITY ABOVE 1.3750In coming Weeks I am looking for Long Positions if we are above 1.3750. That will for a Left Shoulder of the H & S before a decline.
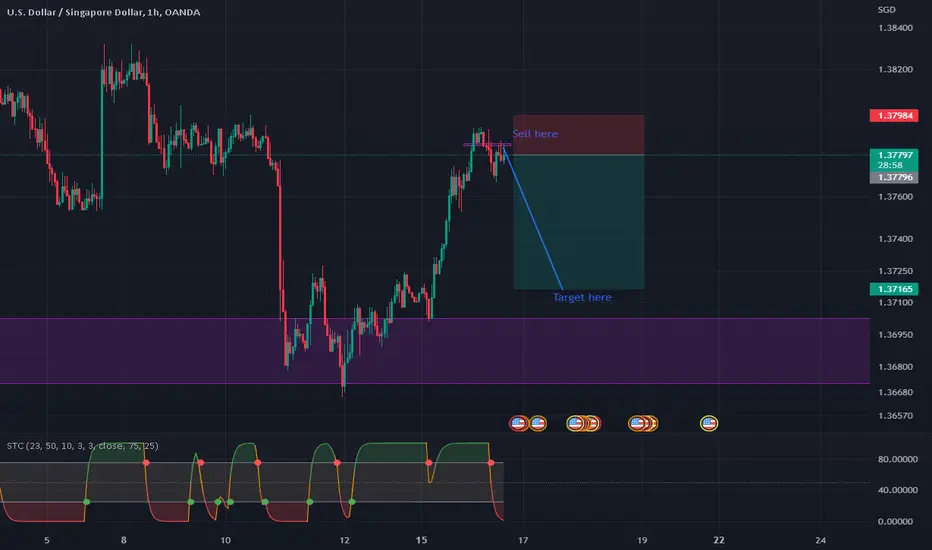
USDSGD | Sell SetupBAT pattern formation
Trending in LL and LH.
sell @ current price with Stoploss of LH

USDSGD, 1HExpected continuation of bullish trend on the basis of Dow Theory
Took entry at expected LH and took trade as per mentioned entry level, SL & TP.

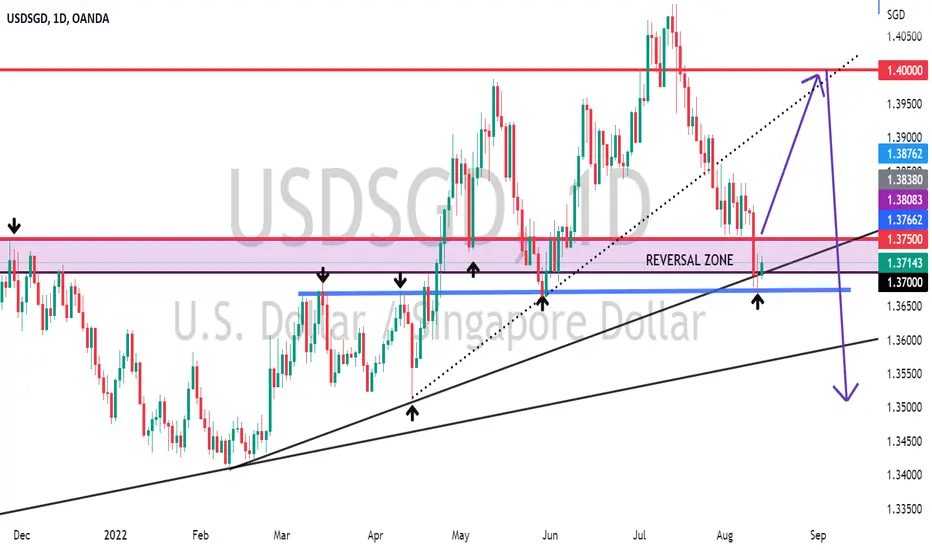
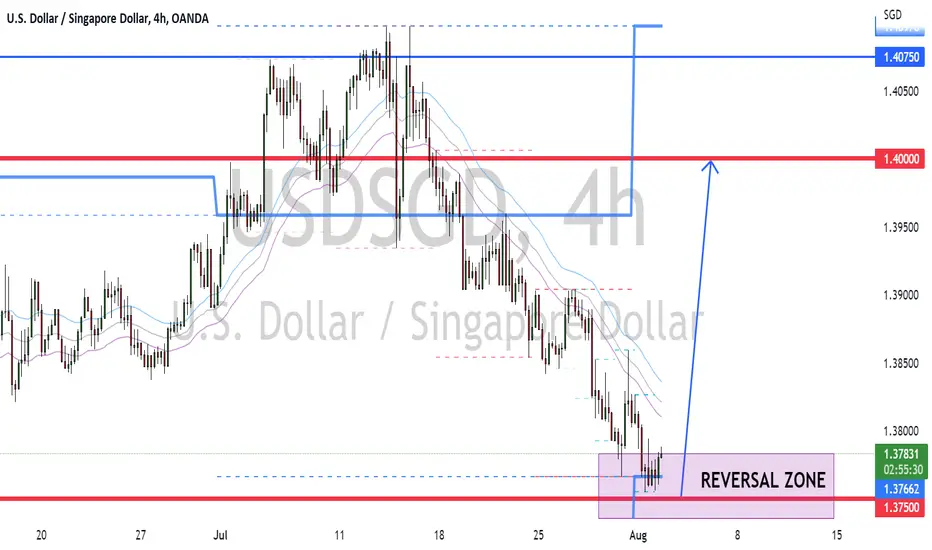
USDSGD LONG OVERVIEWBeing the 1st week of the month. We are looking at possible retracement to Monthly Pivot or 1.40000. Current reversal zone looks strong due to the false move breaking the previous month low. Inducing short positions. Price is also around 1.37500 Quarter Point.
USDSGD Long Long USDSGD playing this as an sbo
USd looks strong across the board and this was probably the best set up
testing the daily 50 and price action is making obvious HH/HLs

USDSGD 25th JULY 2022Data from Singapore released today showed inflation based on the consumer price index (CPI) grew 6.7% (yoy) in June, which was the highest level in 14 years, since September 2008.
Core inflation also rose 4.4% (yoy) from May's 3.6%, and was at its highest level since December 2008.
Inflation in Singapore continues to rise, even though the Monetary Authority of Singapore (MAS) has tightened its policy three times.
SINGAPORE INFLATION
USDSGD D1

