SGDUSD trade ideas
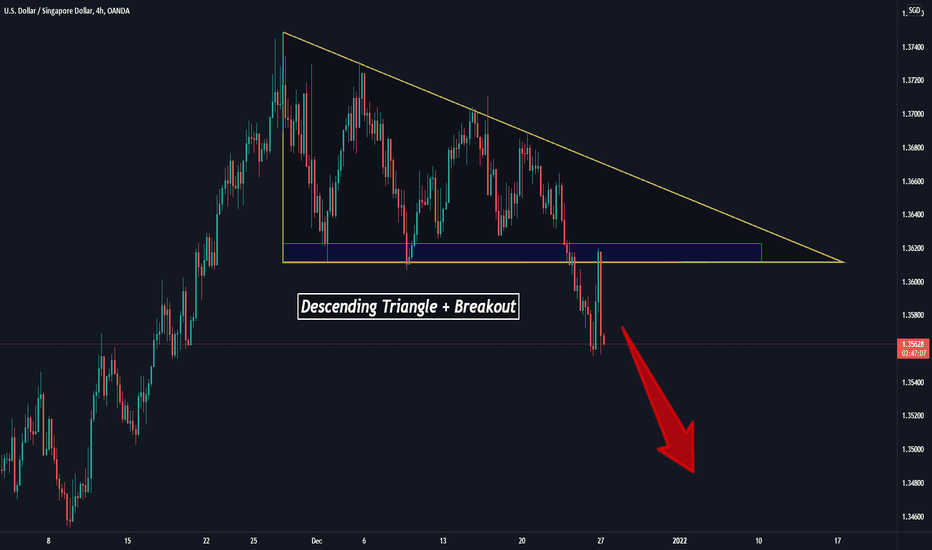
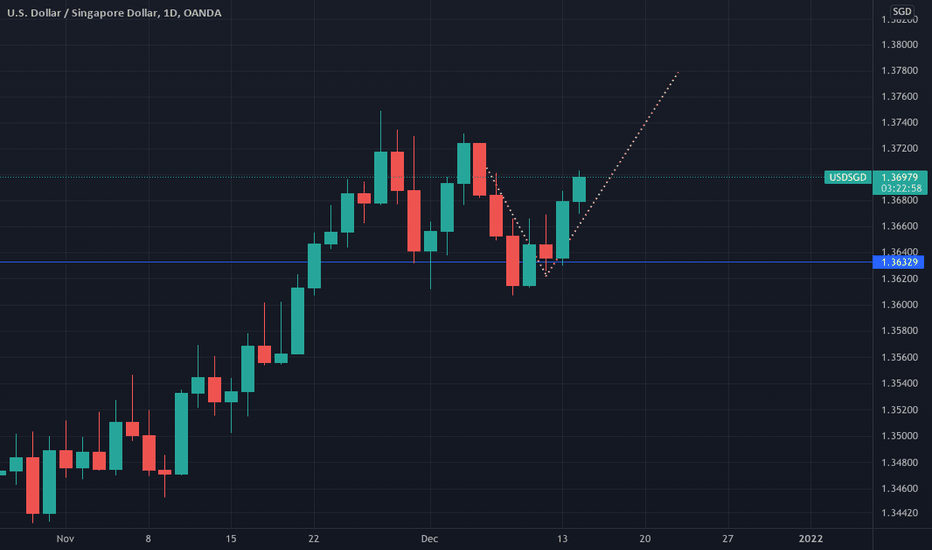
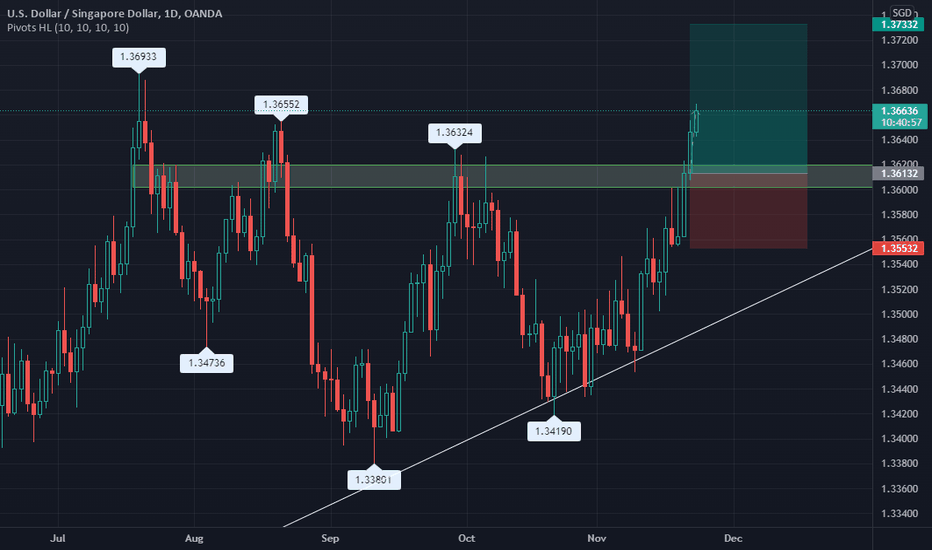
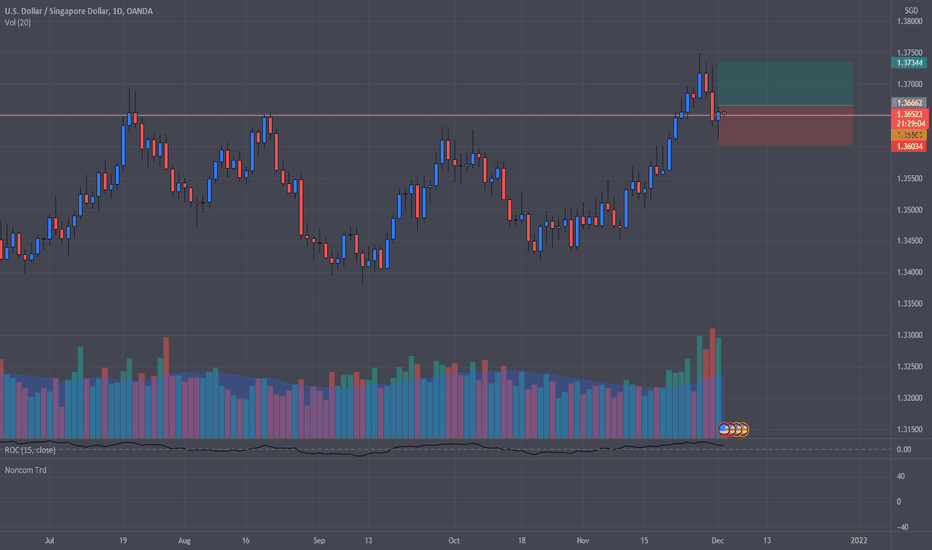
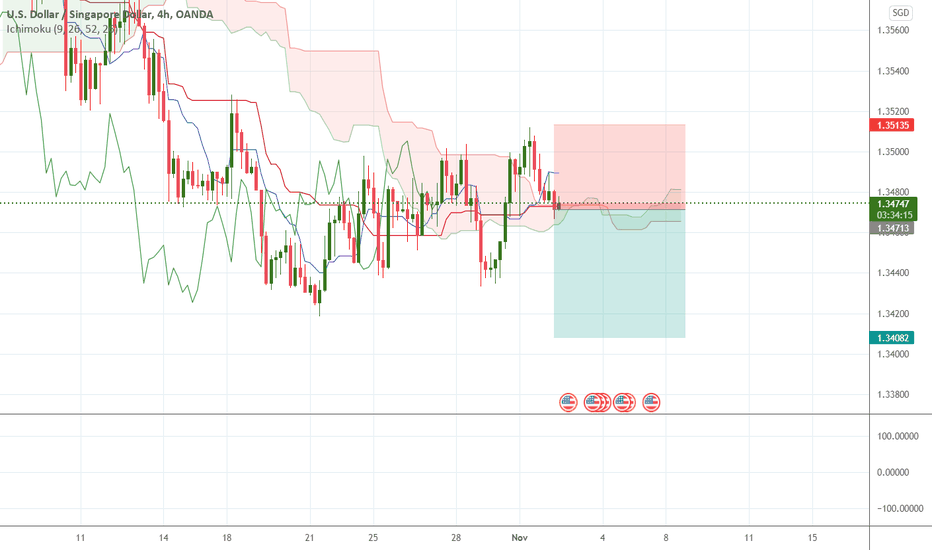
USDSGD DESCENDING TRIANGLESHORT trade analysis on USDSGD .
Graph is looking bearish from resistance area - retest on Triangle breakout . Price completed Descending Triangle Pattern and already retested , which signalizes bearish continuation . Bearish Engulfing Candle also indicates sell on the chart. Trade idea is also shown on RSI indicator.
If you liked this idea or if you have your own opinion about it, feel free to write in the comments.
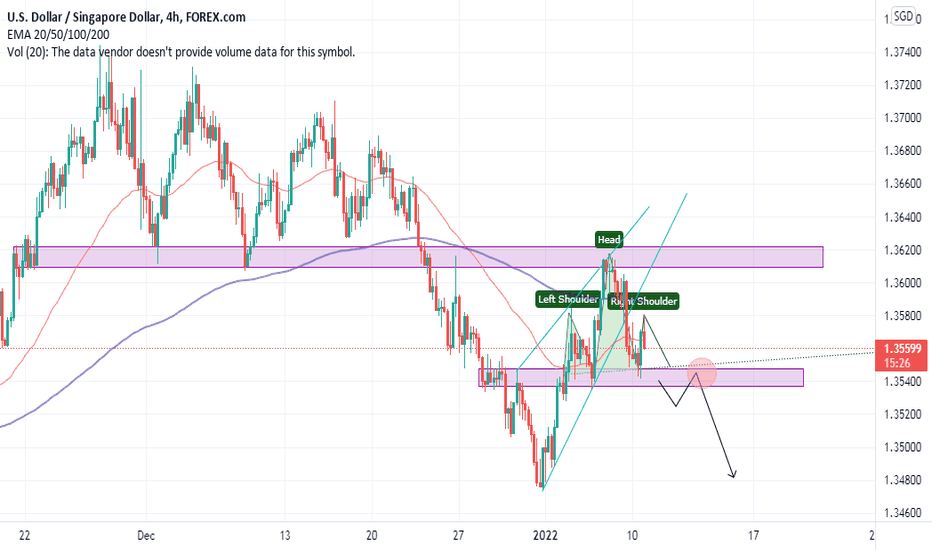
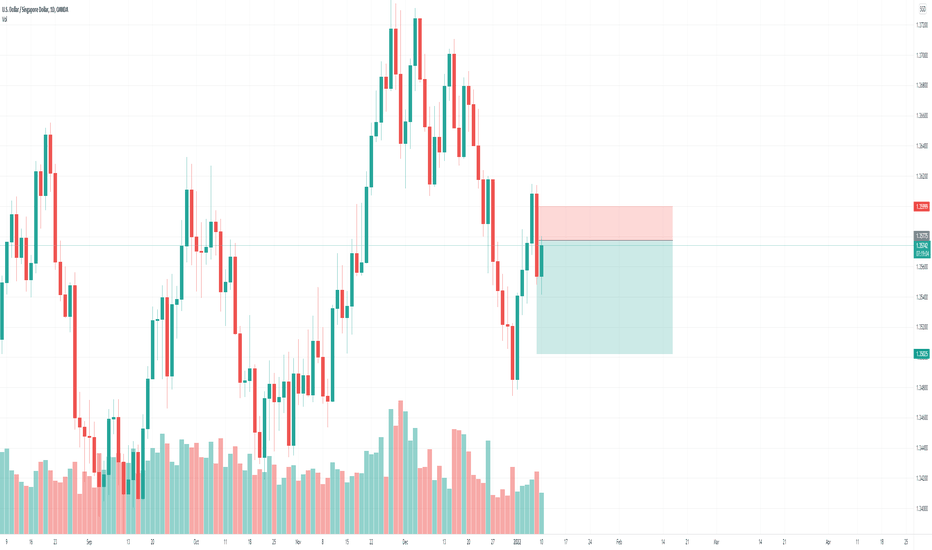
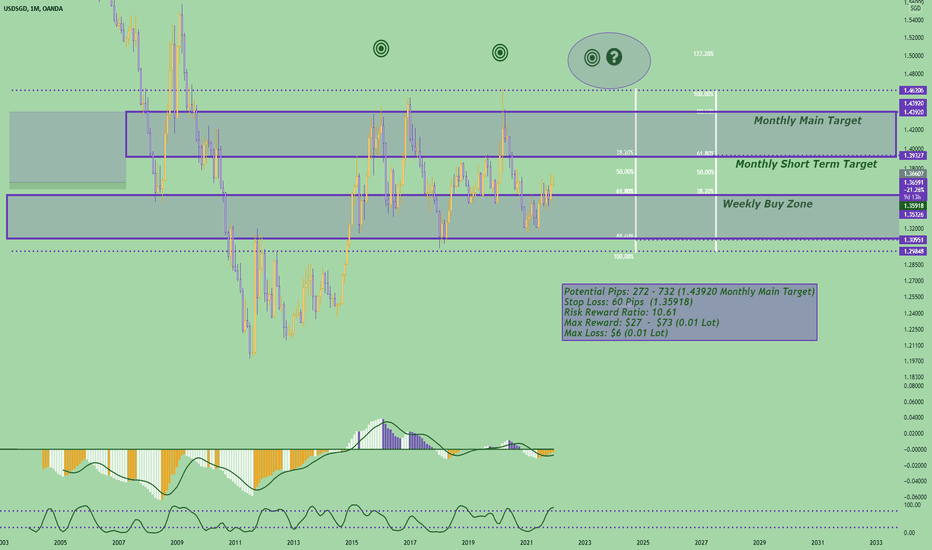
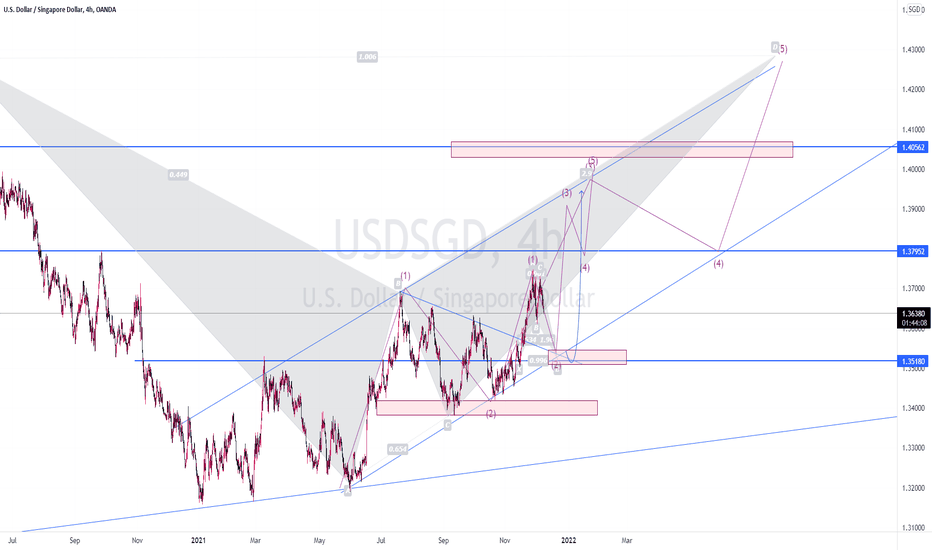
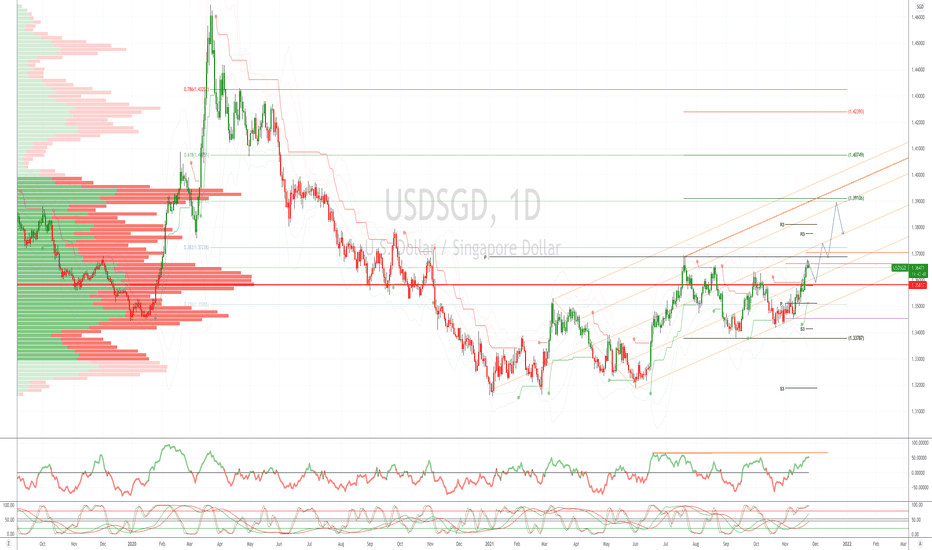
USDSGDOn the monthly we are coming out of a weekly buyzone. Looking for price to retrace the previous high. We are on the low side of the macd with it losing some momentum. It may take a while to reach its target. However, I need to focus on one chart that looked promising on the forex side of things. I don't need to trade everyday. I'm working on my discipline as a trader and am learning how important it is to just calm down. I like the DXY gaining strength towards the end of next year with interest rate hikes. I like the positioning of this chart. I will be patient and will update this chart as I see fit.
Not Advice. Good luck!
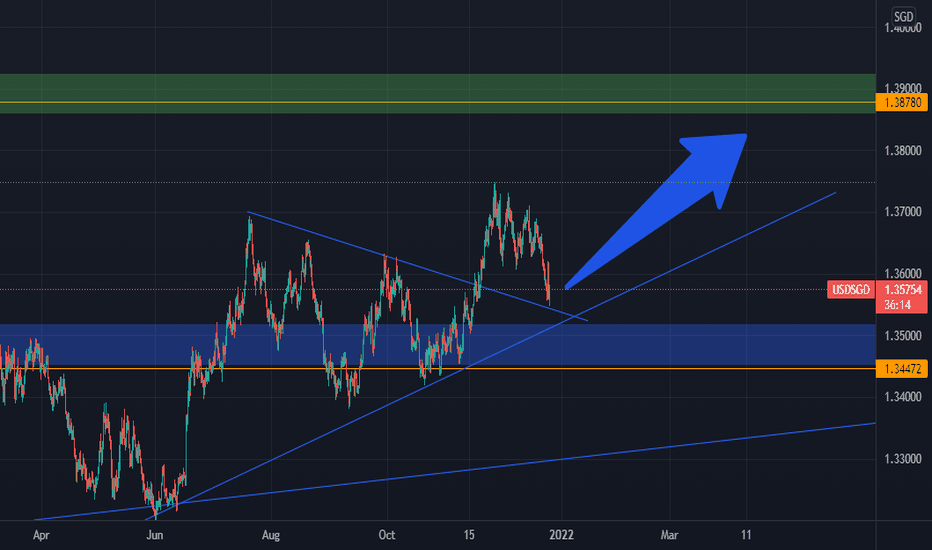
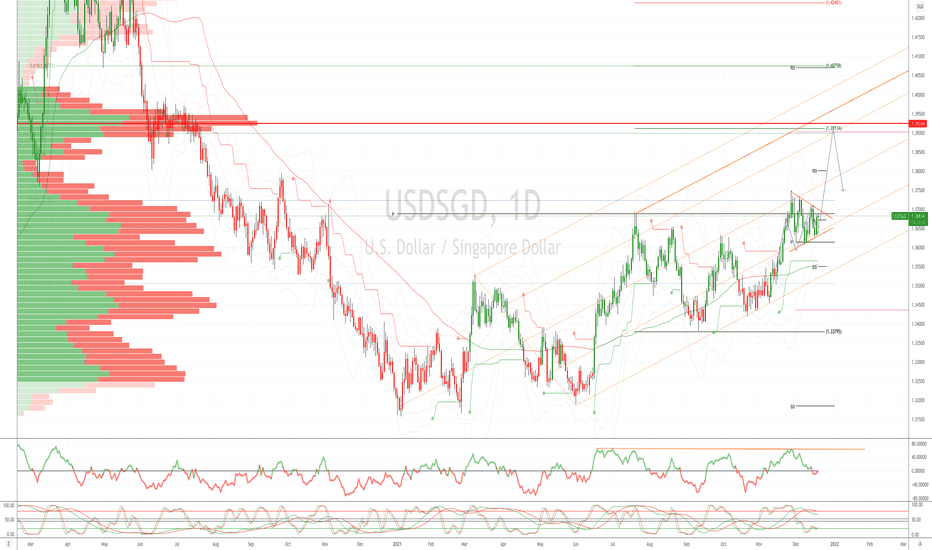
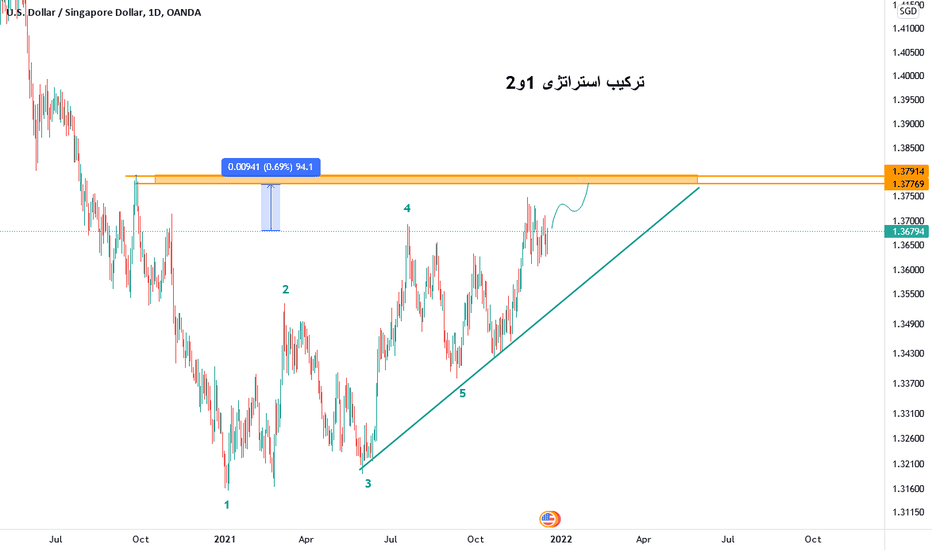
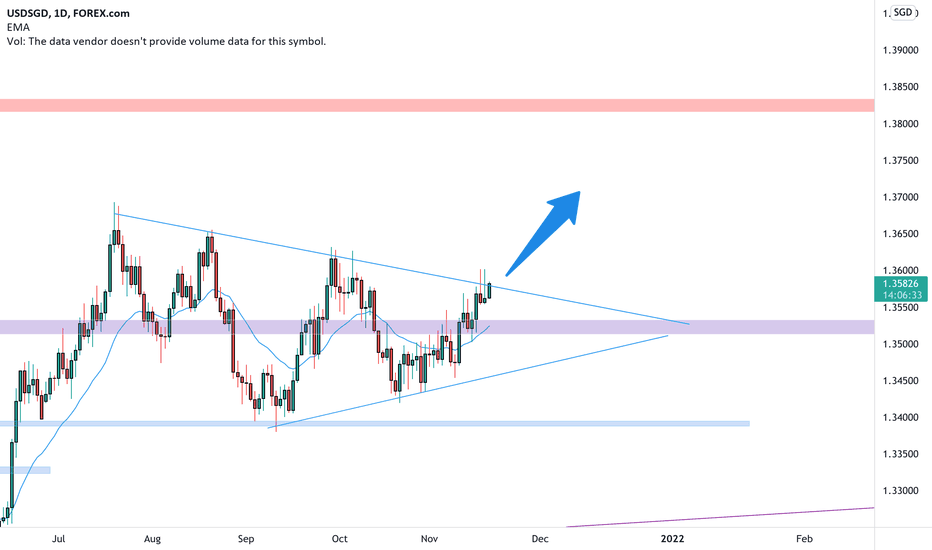
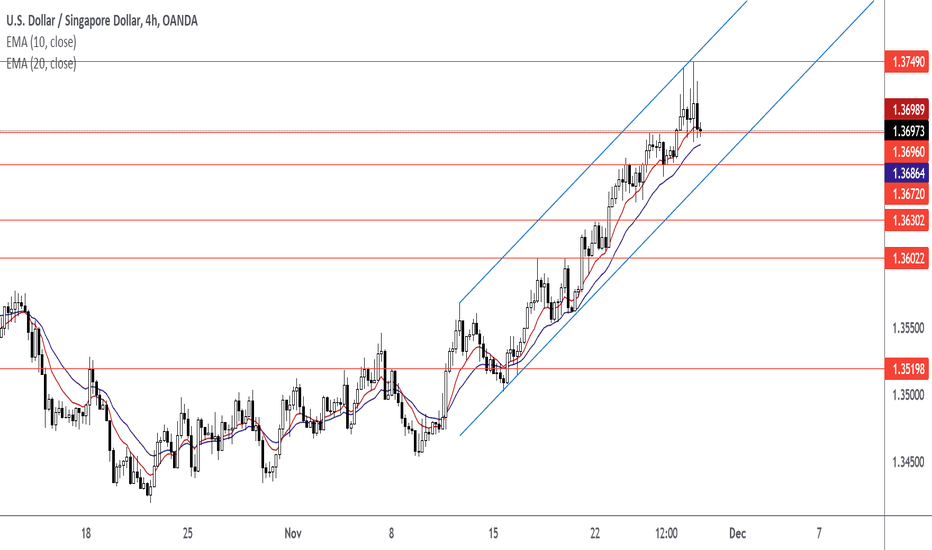
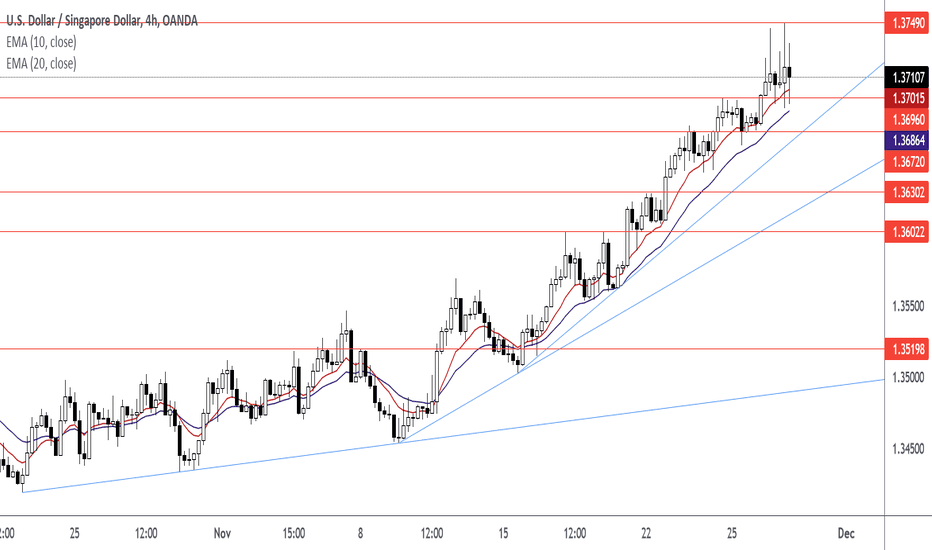
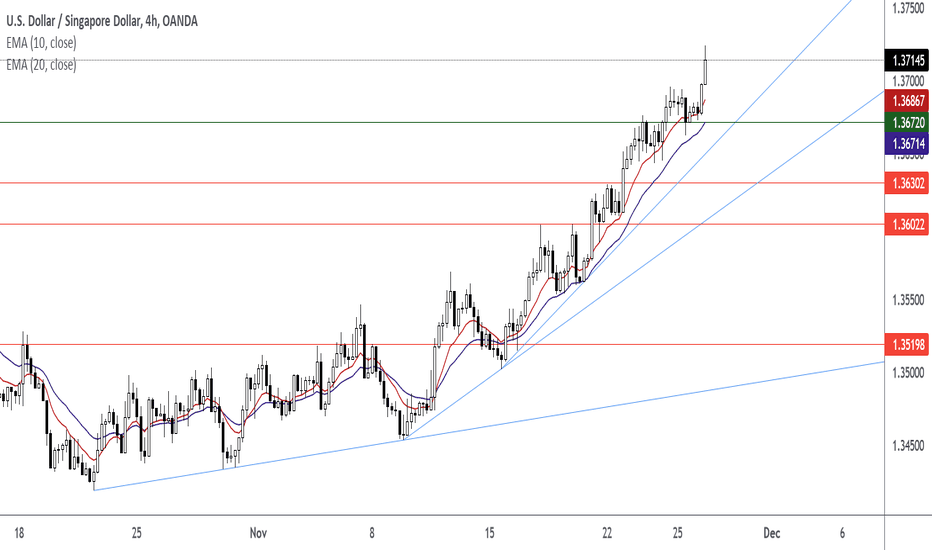
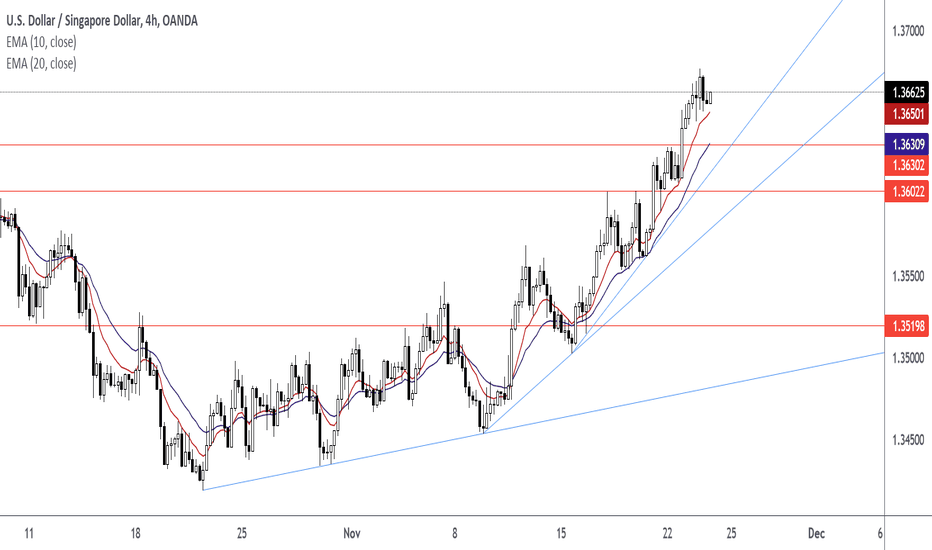
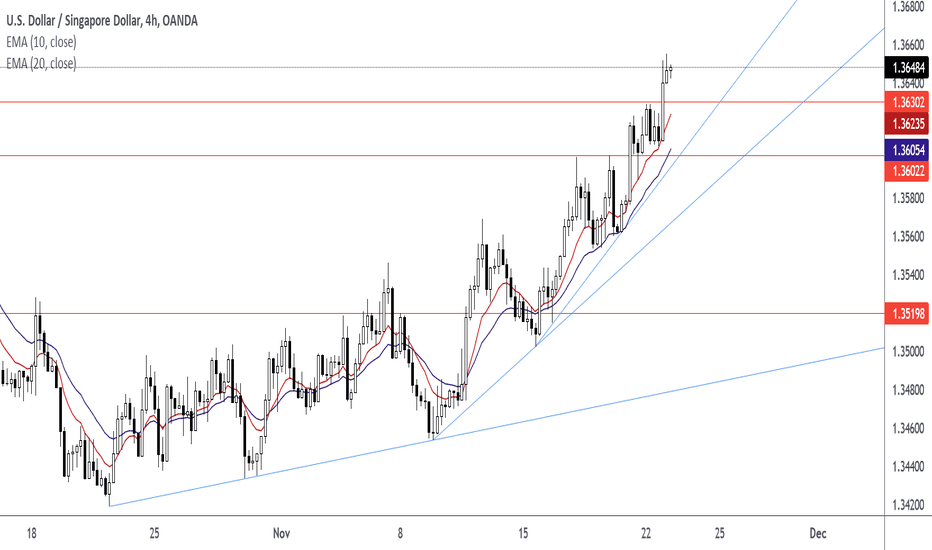
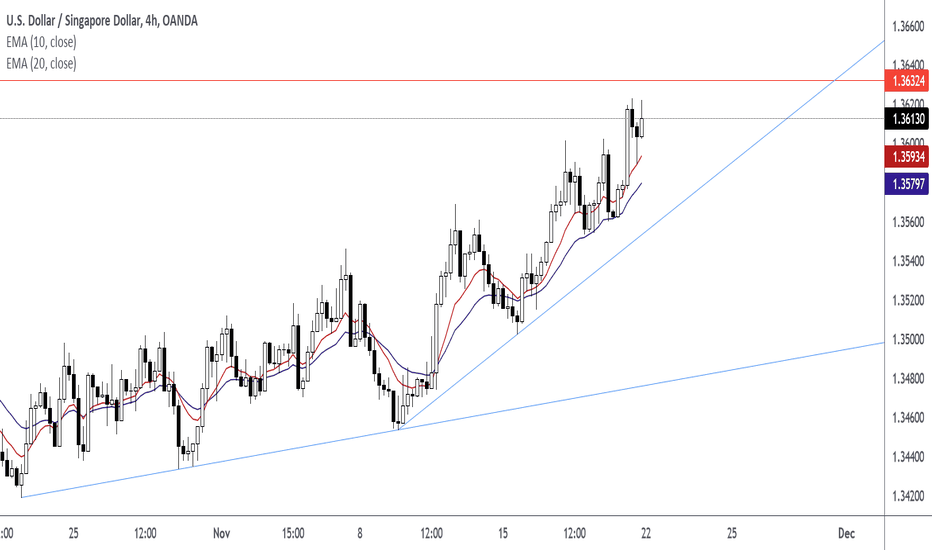
USDSGD looking up 🦐USDSGD on the daily chart is trading between 2 narrowing trendlines.
The price is now moving in a bullish momentum and according to Plancton's strategy if the market will break above and satisfy the academy rules we will set a nice long order.
--––
Follow the Shrimp 🦐
Keep in mind.
🟣 Purple structure -> Monthly structure.
🔴 Red structure -> Weekly structure.
🔵 Blue structure -> Daily structure.
🟡 Yellow structure -> 4h structure.
⚫️ Black structure -> <4h structure.
Here is the Plancton0618 technical analysis , please comment below if you have any question.
The ENTRY in the market will be taken only if the condition of the Plancton0618 strategy will trigger.
