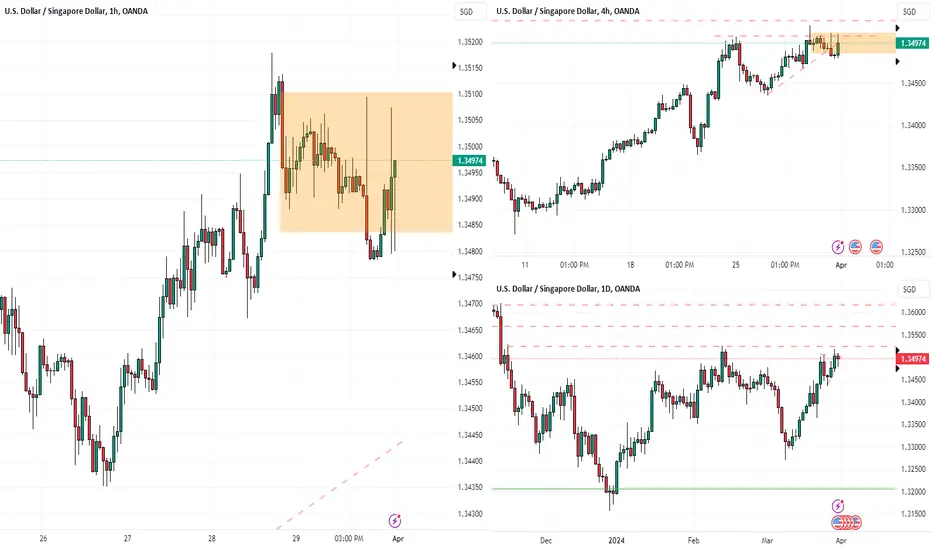
USDSGD Bullish unless this Support breaks.The USDSGD pair is on the 1D MA50 (blue trend-line) currently but within conflicting Channels. The long-term one is a Channel Up that hasn't yet been invalidated, the medium term one a Channel Down and the shortest term a Channel Up.
As long as Support 1 (1.34225) holds, we will go with the short-term Channel Up and stay bullish, targeting 1.37250, which will be a Lower High on the medium-term Channel Down. If on the other hand, Support 1 breaks, we will take the loss and go short instead, targeting 1.32725 (Support 2).
-------------------------------------------------------------------------------
** Please LIKE 👍, FOLLOW ✅, SHARE 🙌 and COMMENT ✍ if you enjoy this idea! Also share your ideas and charts in the comments section below! This is best way to keep it relevant, support us, keep the content here free and allow the idea to reach as many people as possible. **
-------------------------------------------------------------------------------
💸💸💸💸💸💸
👇 👇 👇 👇 👇 👇
SGDUSD trade ideas

GBP/CHF Short and USD/SGD ShortGBP/CHF Short
Minimum entry requirements:
• Tap into area of value.
• Risk entry after a 1H rejection or a phase line break.
USD/SGD Short
Minimum entry requirements:
• 1H impulse down below most recent low.
• If 2 touch 5 min continuation, reduced risk entry on the break of it.
• If 2 touch 15 min continuation, 5 min risk entry within it, or reduced risk entry on the break of it.

the pair is waiting for trendline reactionthe pair is waiting for trenline reaction but our main scenario is bearish .
we are following up to enter short
if you have any comments pls share


USDSGD SELLS @ 1.351Selling USDSGD here, price is at supply. Only issue with this trade is price dipped into weekly demand. However, I'd expect price to retrace back into the demand before firing up to weekly supply.
AB-CD Bullish reversal pattern formingAn excellent trading opportunity, for this pair on the 4H time frame as 2 opportunities are presented according to my analysis.

USDSGD - 1D Chart Market Close 5th May (Close Trade) For my short USDSGD trade this will currently be the last post, as I have exited all my positions.
As mentioned earlier just before NFP,
I had closed out half the trades before NFP; and the other half I rode with NFP.
After the data was released my TP1 at 1.3475 was reached and my trades were closed out and I will be not chasing another short opportunity as the risk reward ratio won't make sense, overall speaking this trade averaged out on over 140 pips gain for me.
For those that want to know more as to why I entered the USGSGD trade , please see the below:

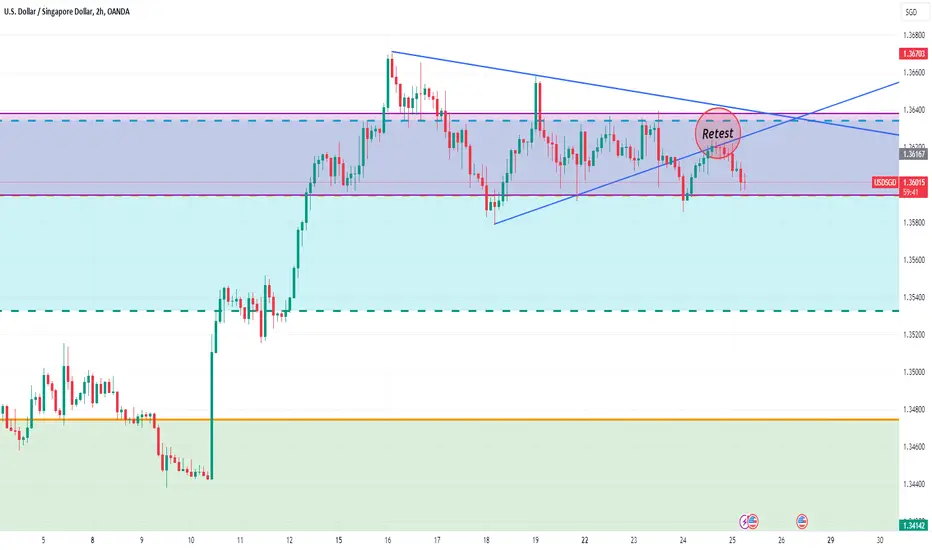
USDSGD 4H Chart - 3rd May awaiting NFPFollowing up from my previous post on the 21st of April
This trade has progressed along my expectations, as indicated by the three orange circles, there were two retest and the one that's highest contained a bearish engulfing formation on the 4H chart , which also formed a lower high of 1.36596 in comparison to the high that was formed on 16th April of 1.36703 , which is indicated by the orange line in the graph.
My stop loss of the previous high was not triggered and this trade currently is making money, I did reopen additional positions 1.36445 and 1.36447 due to the engulfing formation and with a tight stop loss going into FOMC meeting, I had more upside than downside.
Now NFP is nearing , likely will take half profits first and ride the other half out with my final take profits not changing as stated in previous posts.

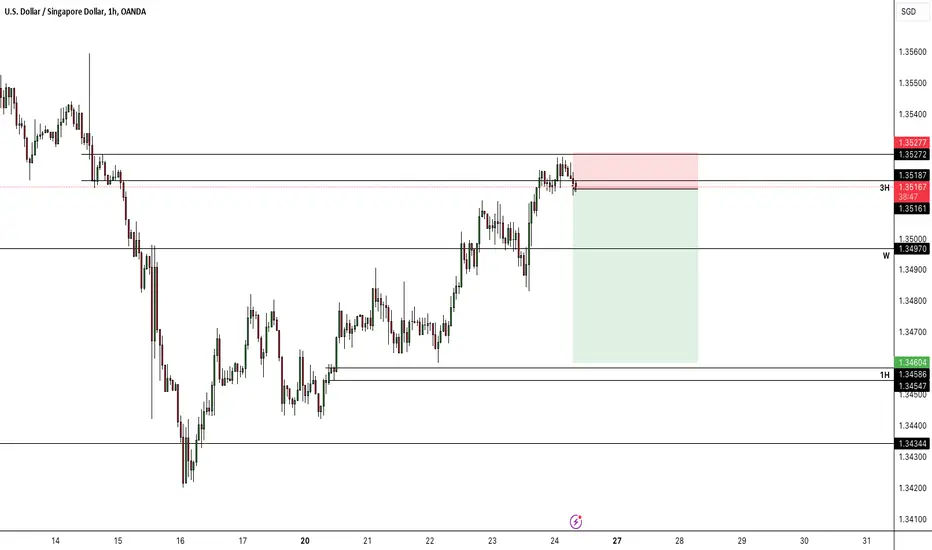
USDSGD 2H Chart - 25th April 1st Retest done? wait break supportFor USDSGD
The initial retest on breaking the triangle seems to have been completed.
Price action seems to be still ranging between 1.3635 and 1.3595 from the start of the week till now, and the lower boundary as illustrated by the lilac box has been tested multiple times from the start of the week till now.
My position remains same as before I am still short on USDSGD, if a clean break on 1.3595 happens it would no doubt strengthen my view, and my take profit levels remain the same
TP1: 1.34746
TP2: 1.34142
For those that like my posts, please drop a boost and follow me, I'll likely be doing two updates a week, once mid week, and once on Sunday.
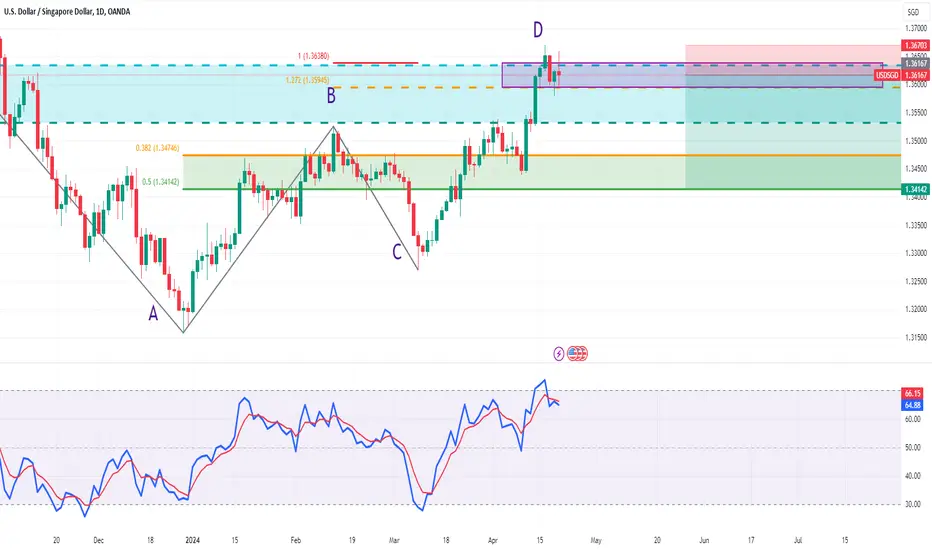
USDSGD 1D Chart - 21st April So for USDSGD, an harmonic pattern has formed, with the top of 1.36720 being retested and forming a lower high of 1.36591.
I have added another indicator on this chart and currently said indicator aligns with my outlook of shorting USDSGD.
If we were to short this position we would be looking at:
1:2.64 ratio at the 0.382 profit level @1.34746 &
1:3.78 ratio at the 0.5 profit level @ 1.34142
Thus at market open I would be looking into shorting USDSGD
USDSGD Still a buy but not for long.The USDSGD pair has been trading within a Channel Up pattern (blue) since the February 02 2023 Low but on December 28 2023 it posted a Lower Low, so we have to consider the possibility of an emerging (dotted) Channel Down.
As a result, the trend remains bullish but technically we should be careful and only target the top of Channel Down at 1.37350 (symmetrical Bullish Leg at +4.49%).
-------------------------------------------------------------------------------
** Please LIKE 👍, FOLLOW ✅, SHARE 🙌 and COMMENT ✍ if you enjoy this idea! Also share your ideas and charts in the comments section below! This is best way to keep it relevant, support us, keep the content here free and allow the idea to reach as many people as possible. **
-------------------------------------------------------------------------------
💸💸💸💸💸💸
👇 👇 👇 👇 👇 👇

USDSGD 1D Chart - 15th April 2024Harmonic pattern forming on USDSGD day chart
with potential turning region at 1.36380 - 1.35945
Will be monitoring hopefully price will go touch 1.36395 and retrace
then will be a good opportunity in selling


USDSGD: Bullish TrendUSDSGD is in Bullish Trend, printing HH's and HL's. Taking the support from trendline and expected to print further HH's and HL's.


USDSGD 31/03/2024Weekly:
-Inverse H&S pattern.
-IC.
Daily:
-Bullish M pattern.
4H:
-4H imbalance overlaping with the daily imbalance.
Usd index still bullish with it, watching for more upsideTradingview Ideas:
Hello fellow traders , my regular and new friends!
Welcome and thanks for dropping by my post.
As mentioned in my streaming, i mentioned that usd has no major change in its price structure, likely more upside and bias to long for the majors.
Do check out my stream video for the week to have more explanation in place.
Do Like and Boost if you have learnt something and enjoyed the content, thank you!
-- Get the right tools and an experienced Guide, you WILL navigate your way out of this "Dangerous Jungle"! --
*********************************************************************
Disclaimers:
The analysis shared through this channel are purely for educational and entertainment purposes only. They are by no means professional advice for individual/s to enter trades for investment or trading purposes.
*********************************************************************
USDSGD Buy signal Hey guys! its your girl forex potatoe, i have posted this analysis sometime back and the price never really held as there was no clear direction.
So now here is a longterm position or swing trade on this pair with a very clear buy direction
Confluences:
Double or W pattern
RSI Divergence
Price currently above the moving averages
Third touch
Let me get your opinion on this analysis


USDSGD 26/03/2024Weekly:
-Inverse H&S pattern.
-IC.
Daily:
-Bullish M pattern.
-Inverse H&S pattern.
-IC.
4H:
-IC.
-Market shift.

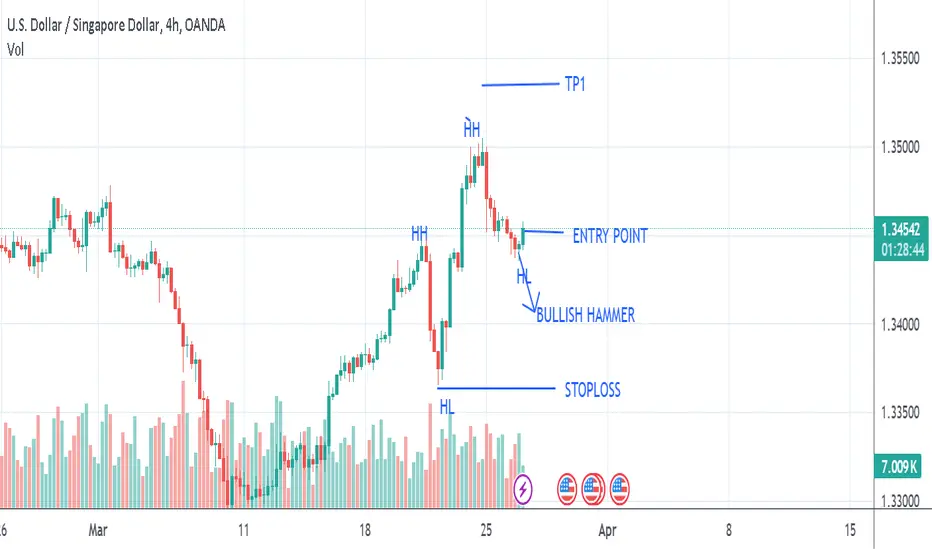
USDSGD IS IN BULLISH as it close bullish hammer on HL side in 4hUSDSGD IS IN BULLISH as it close bullish hammer on HL side in 4h time frame
UsdSgd UptrendThe rise initiated in the dollar, triggered by the higher-than-expected U.S. CPI data, also propelled an upward movement in USD/SGD.
Technically, the price has broken the long-term downward channel upwards and is currently finding support at significant Fibonacci levels in both the downward and upward directions.
Expanded flat (ABC)SGD has been holding up relatively well compared to other Asian currencies (RMB, JPY, ringgit etc) against USD over the past few years. It is one of the strongest currency in Asia, but not for long.
Based on my analysis, USDSGD is in the 1,2 formation of the white C wave as depicted in the chart. USDSGD is the midst of completing the C wave of an expanded flat (ABC) commencing from 1994. One characteristics of the C wave of an expanded flat(ABC) is it takes the longest time to complete among the three waves.
As depicted in the chart, a 2.0 extension will target wave 3 of the impulsive wave at 1.84, a 1.618 extension will target wave 4 at 1.74 and a 2.618 extension will target wave 5 at 2.0.
A 0.618 retracement of the red wave (A) is at 1.96 and a 1.618 extension of wave A of the "potential" expanded flat (ABC) will target wave C at 2.0
A confluence of the above three analysis all points to 2.0 as the end price for wave C.
That's the beauty of Fibonacci and Elliott wave !!!
The question now to ask is the wave 2 of the wave C completed ? Based on previous analysis on DXY, it should be. But then again, let the market do the talking !
