SGDUSD trade ideas
usdsgd a down trend It is down on the daily and h4 timeframe..just look for setup to go short.
Hello there!
If you like my analysis and it helped you ,do give me a thumbs ups on tradingview! 🙏
And if you would like to show further support for me, you can gift me some coins on tradingview! 😁
Thank you!
Disclaimers:
The analysis shared through this channel are purely for educational and entertainment purposes only. They are by no means professional advice for individual/s to enter trades for investment or trading purposes.
The author/producer of these content shall not and will not be responsible for any form of financial/physical/assets losses incurred from trades executed from the derived conclusion of the individual from these content shared.
Thank you, and please do your due diligence before any putting on any trades!
USD/SGD LongOANDA:USDSGD
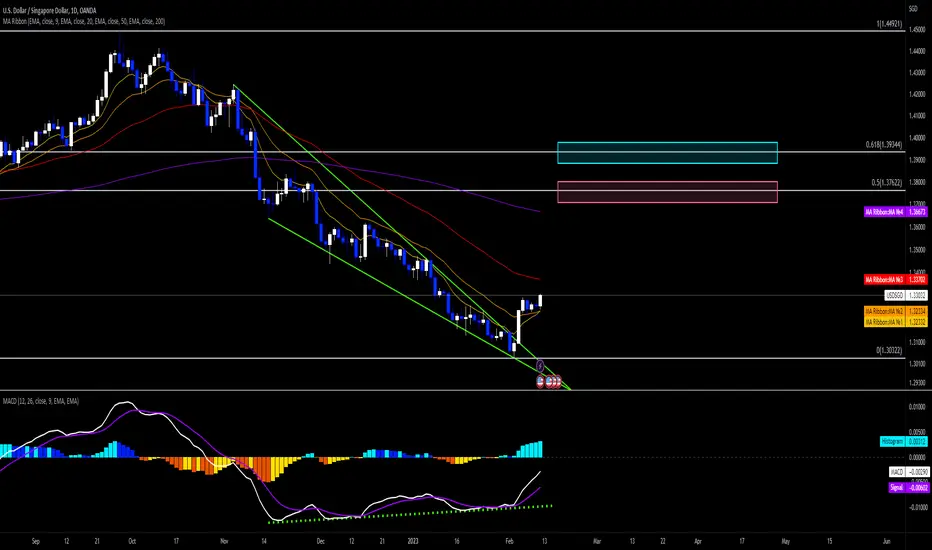
USD/SGD has broke out of a nice descending wedge.
MACD showing some bull divergence.
Looks like a run to at least the 50% or 61.8% Fibonacci retracement level is likely.
Target 1 = 1.376
Target 2 = 1.393
Long.
Fat_Fat
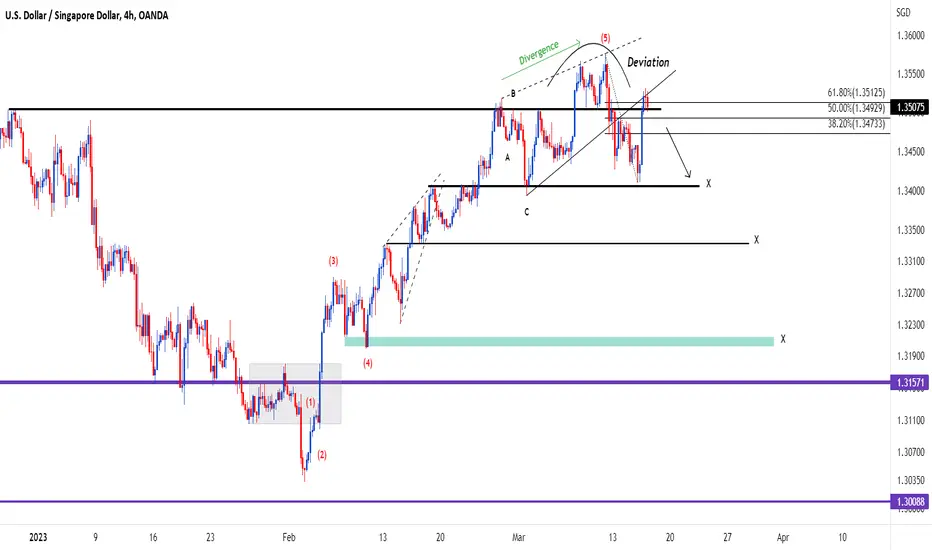
USDSGD - bigger correction to goIdea is in the chart.
RSI divergence + Deviation + Trendline break.
Down.
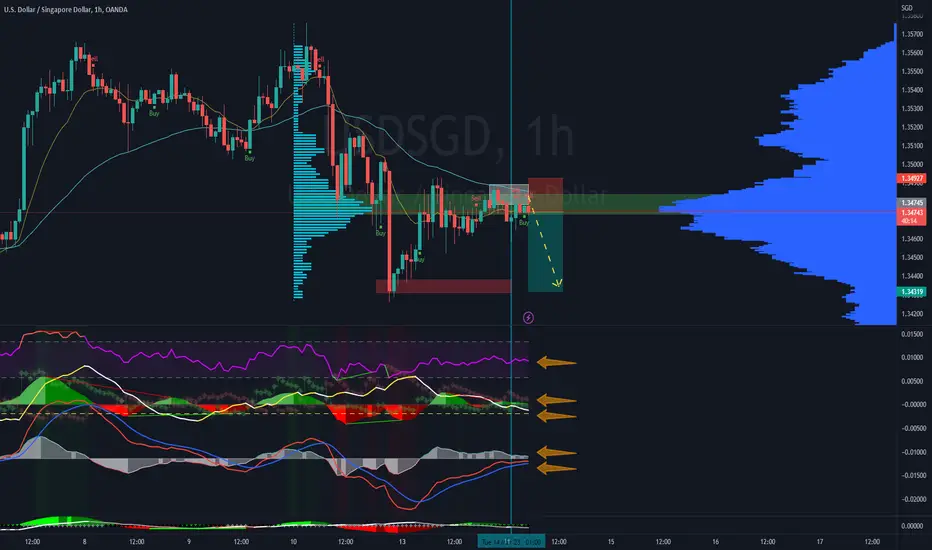
USDSGD SHORTPossible bearish movement of the pair. The price is currently in a trading zone with significant volume , with rejections at the top of the price right at the 55 period EMA , which is essential in my strategy for analysis of possible trend continuations. We also see significant development in the Squeeze momentum indicator and macd histogram monitors, with directionality changes to bearish confirmed. We see the attached ADX indicator entering below the 23 level line (0 point of the MACD histogram), indicating the weakness of the previous move higher as it bounced towards the 55 period EMA , to continue falling as the moves have indicated. previous; along with a possible sell signal pattern coming soon on the MACD lines. There could be a continuation of the downtrend.
If you are going to take my opinion into account, please respect the projection time, this is extremely important. If it is not fulfilled in the foreseen time and it makes a range, it will be better to close the operation in case it is possible.

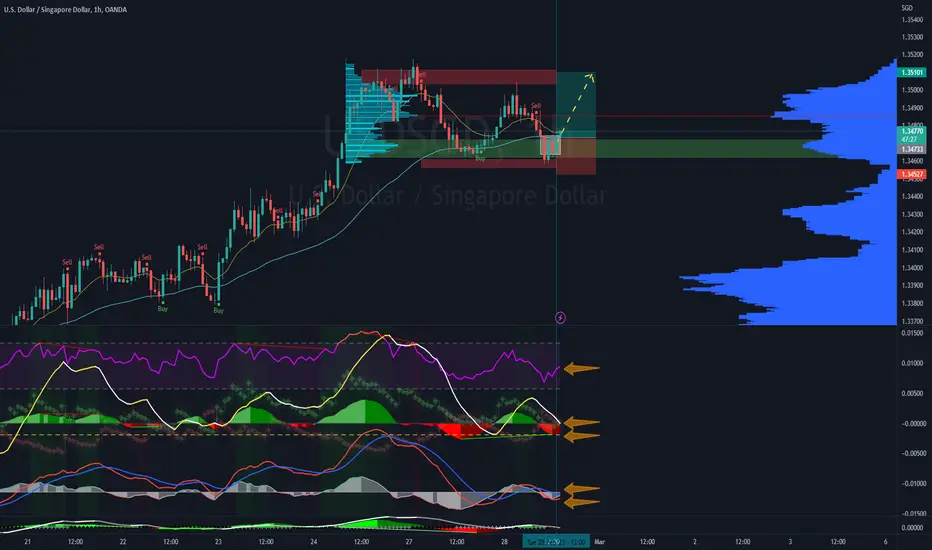
USDSGD LONGPossible upward movement of the pair. Price is currently in a lower bound trading zone with significant volume making stops and holding rejections at the bottom of the price near the 55 period EMA , essential in my strategy for analysis of potential trend continuations. Indicators like Squeeze Momentum and the MACD histogram have turned bullish after their red valley; accompanied by the loss of bearish strength indicated by the ADX rebounding towards the EMA . The MACD lines would be giving a possible buy signal soon. I think you could go looking for the previous high price zone when you see indications of a bounce move higher on the 4-hour chart. In 1 hour timeframes we see that it has broken the bearish structure, forming higher lows than the previous ones.
If you are going to take my opinion into account, please respect the projection time, this is extremely important. If it is not fulfilled in the foreseen time and makes a range, it will be better to close the operation in case it is possible.
USDSGD in a bearish trendAfter the series of HH and HL, the trend have shown reversal by printing new LL and LH and waiting for a pullback to print new LH for possible Short Entry.

USDSGD-Three White Soldiers n Hammer-BullishUSDGSD was in bearish trend before it broke its previous LH. Now it has printed Three White Soldiers and recently a Hammer too. Which means Bulls are taking charge now.

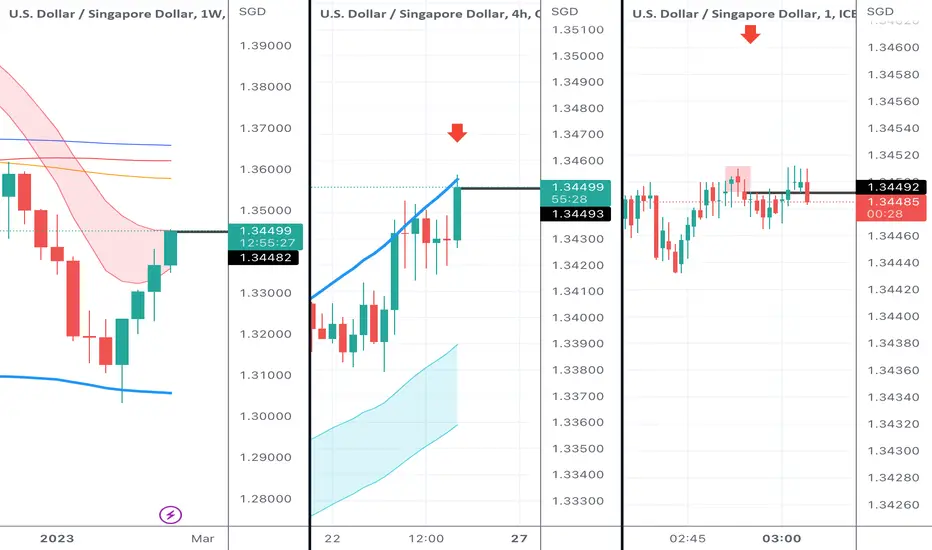
Usdsgd sell 1.3449Usdsgd hitting top of red resistance SCD band on weekly- this is first test after strong decline on weekly.
On 4hr hitting top bolinger band.
On 1min in the same area: sellers produced double gapping separation cluster of two candles
Sell 1.3449
Let’s what next
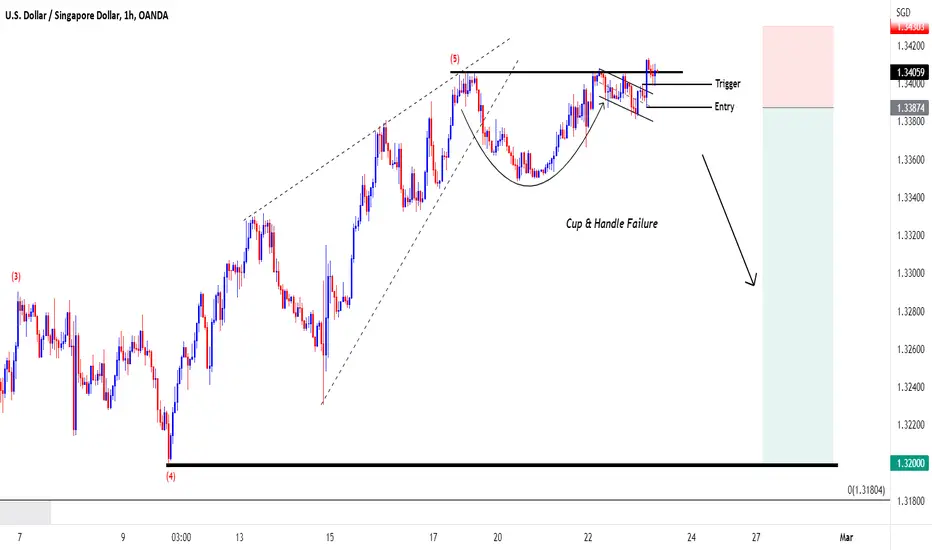
USDSGD - Potential Cup and Handle FailureNon- impulsive move up. IMO, price already triggered a potential failure.
Target 1.32.
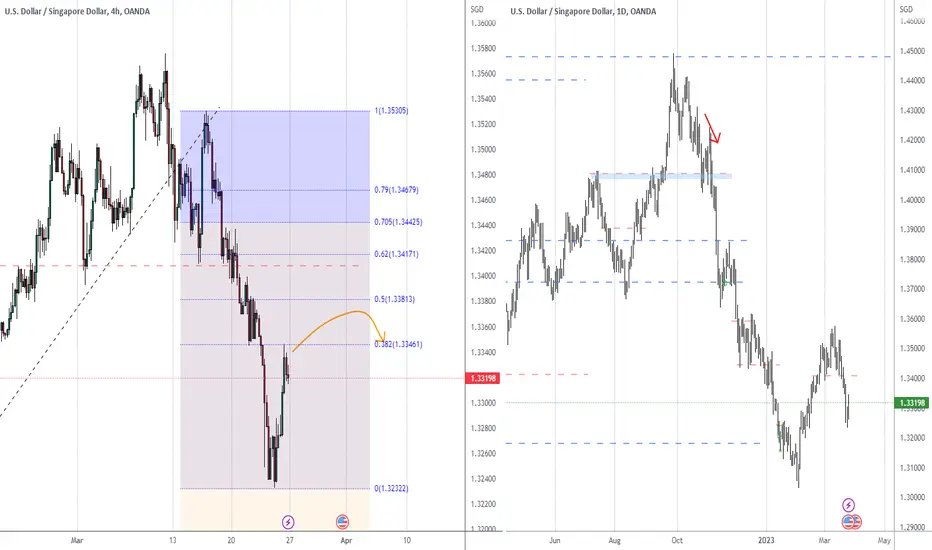
USDSGD Trading The Corrective CycleIn this update we review the recent price action in the USDSGD and identify the next high probability trading opportunity and price objectives to target

USDSDG || Going ShortSeries of HHs and HLs
Bearish Bias::
1. Double Top Formation
2. Formation of Equal Highs (EHs)
3. Rising Wedge Formation
4. Bearish Divergence Formation on 4H TF

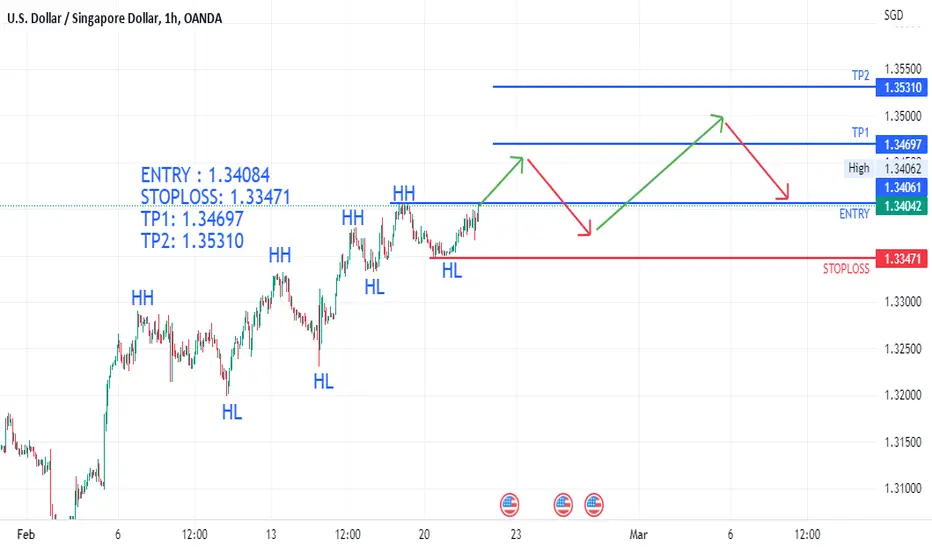
USDSGD Bullish TrendUSD/SGD Currently trading in a bullish trend -
Possible HH and HL are mentioned in the chart.

USDSGD Bullish TrendUSD/SGD is trading in a bullish trend - Currently near its Higher Low, Possible Next Targets are mentioned in the chart.
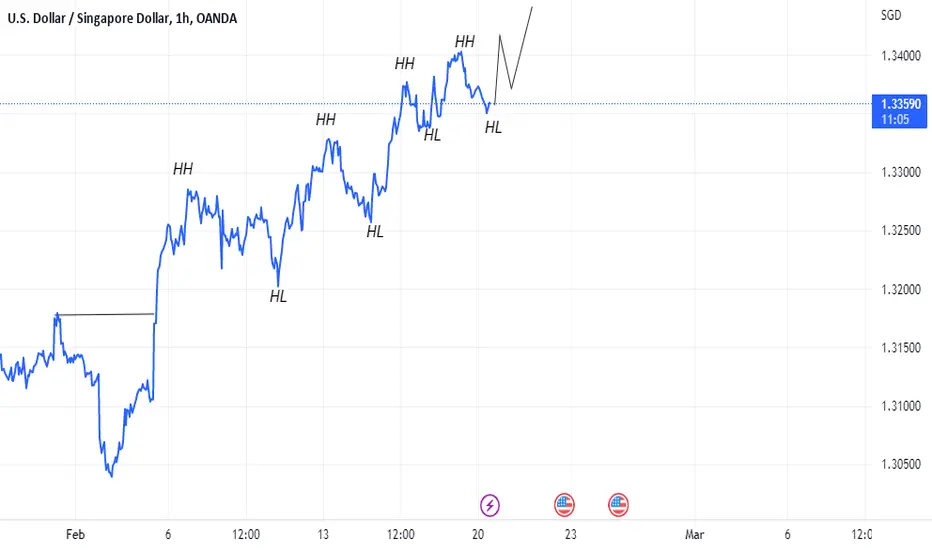
USDSGD (Bullish Trend)After Bearish Trend, the market is making up consecutive Higher Highs and Lows, which indicates towards Bullish Trend.

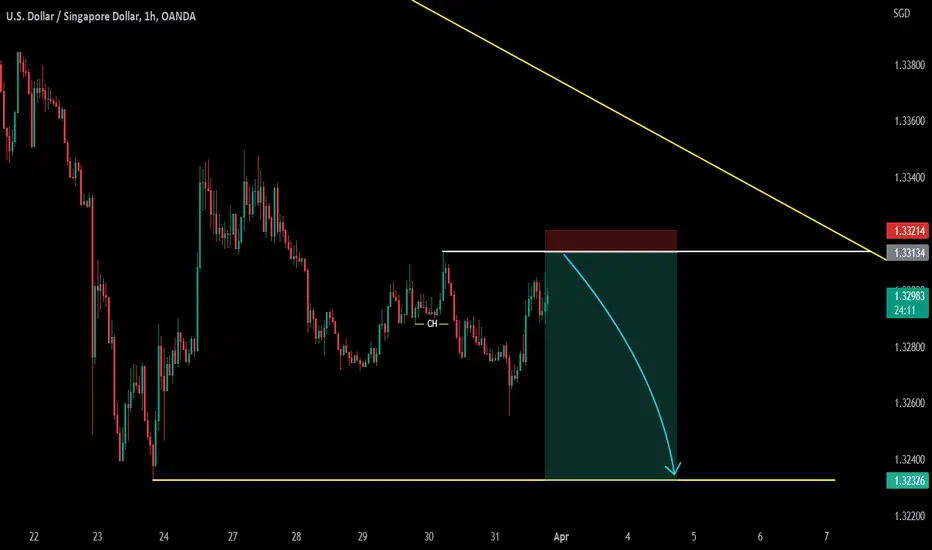
USDSGD HOT PROJECTIONThis market is in a current dominant downtrend. Price action dictates an exhaustion in the short-lived uptrend correction and a continuation of the downtrend. The daily trendline aligns with the current price and the short trendline drawn using the 4hr and 1hr timeframe signifies a possible entry for a lengthy downtrend continuation for the week.

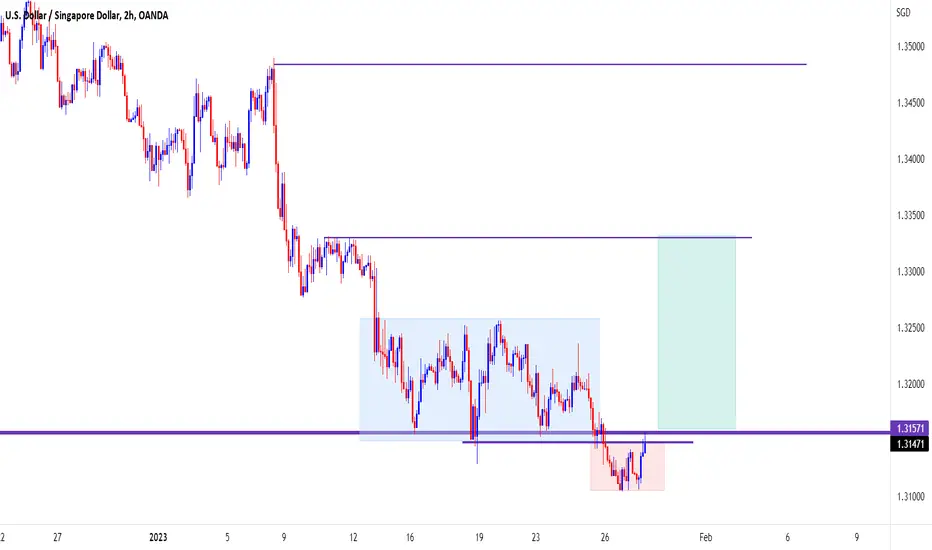
USDSGD - Long from HTF support zonePotential Power of 3 reversal trade.
This is only the first touch of support zone and price could still go lower even if this pattern plays out.
Good luck.
Maybe a correction underway Awesome opportunity on USDSGD long opportunity. Price hit strong monthly support. A correction is possible.

Let's see how it plays outDollar is getting stronger while the stock market appears to pull back. It may take a few day to climb up, but it is worth to open a small position and add after consolidation.

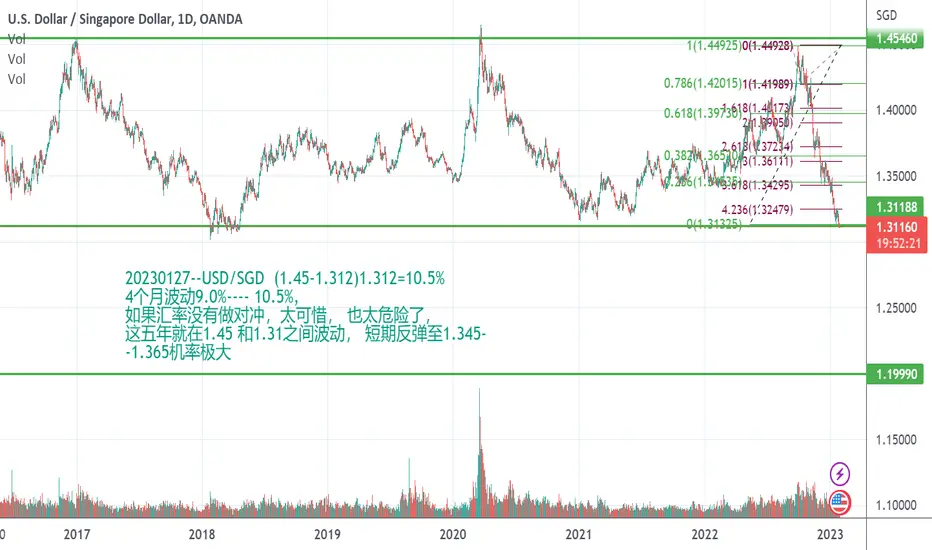
USD TO SGD short term chance is comingUSD TO SGD short term chance is coming,
20230127--USD/SGD (1.45-1.312)1.312=10.5%
moving 9.0%---- 10.5% in four month , rebound to 1.345---1.365 chance is high