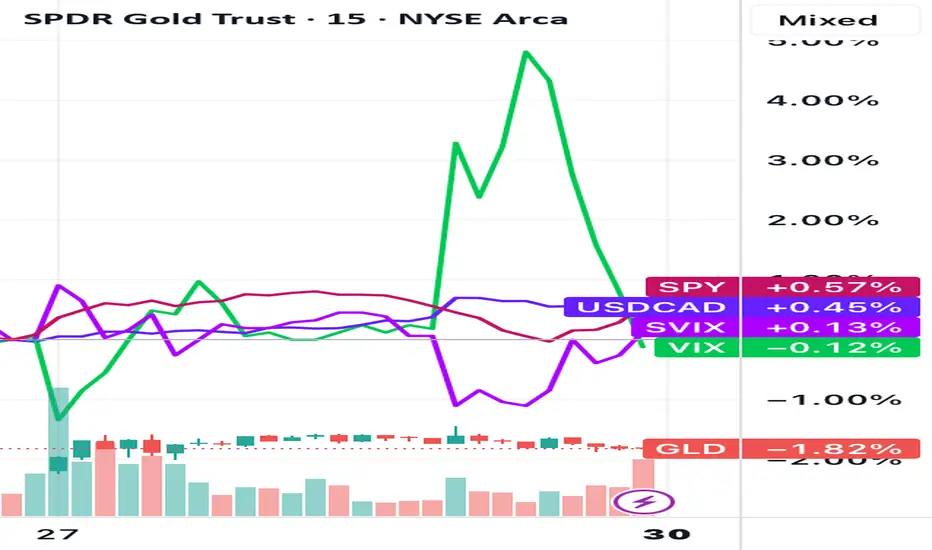
Fear and greed vs SPYWhen VIX crosses over SPY rapidly, it’s usually a reliable sell signal. USD and GLD added for additional fear signals as well as inflation measures.
VIX falling to baseline and SVIX returning to previous value indicates regained stability or growth for SPY (entry point)
GSD trade ideas
Short Goldbeen entering puts every time gold surges on any War headlines. it's getting sold into by smart money. it's been successful three to four times in a row. I currently have 11 open puts for the $300 strike expiring August 15th. I picked them up when we were pushing high 309 on Wednesday. high potential to be in the money if we continue to slide. all of the worst doom war news still couldn't get this thing higher, we are going down.
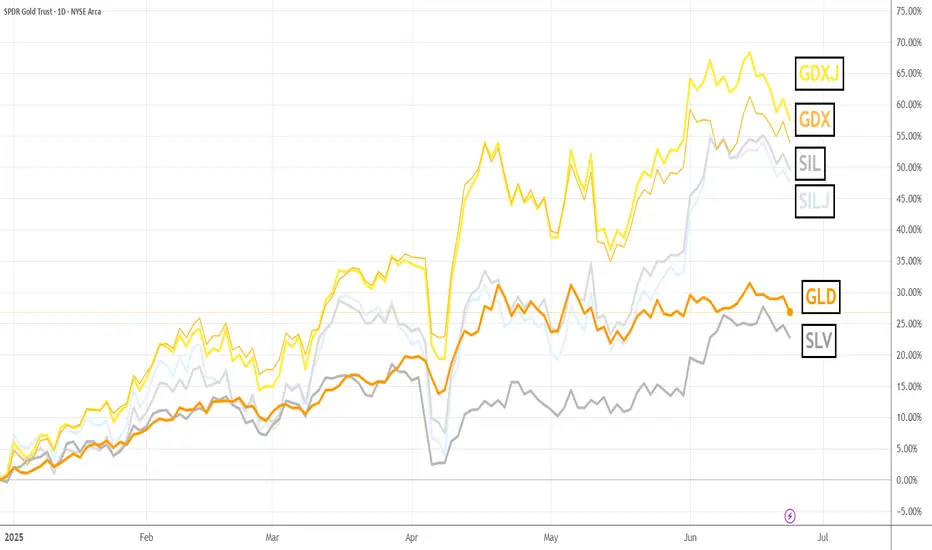
Have you noticed Gold and Silver Miners lately?No doubt you are aware of the serious run Gold made so far in 2025, and you might also be aware that Silver is catching up fast lately. But have you thought to take a look at Gold and Silver mining stocks and the ETFs that track them? As Robin might have said (but never did), "Holy prospectors Batman, these stocks are flying higher!"
It is a real question whether this trend will continue, but if it does, GDX/J SIL/J are the ETFs to watch.
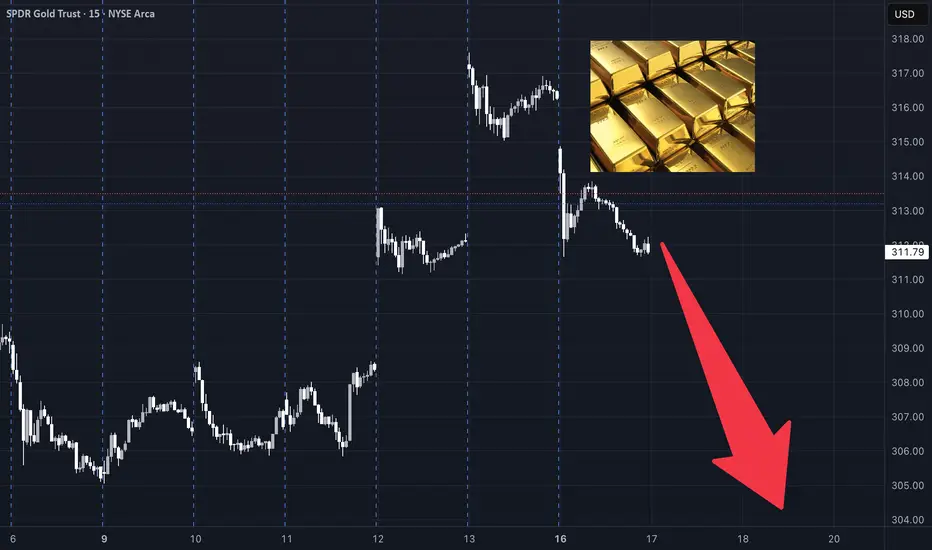
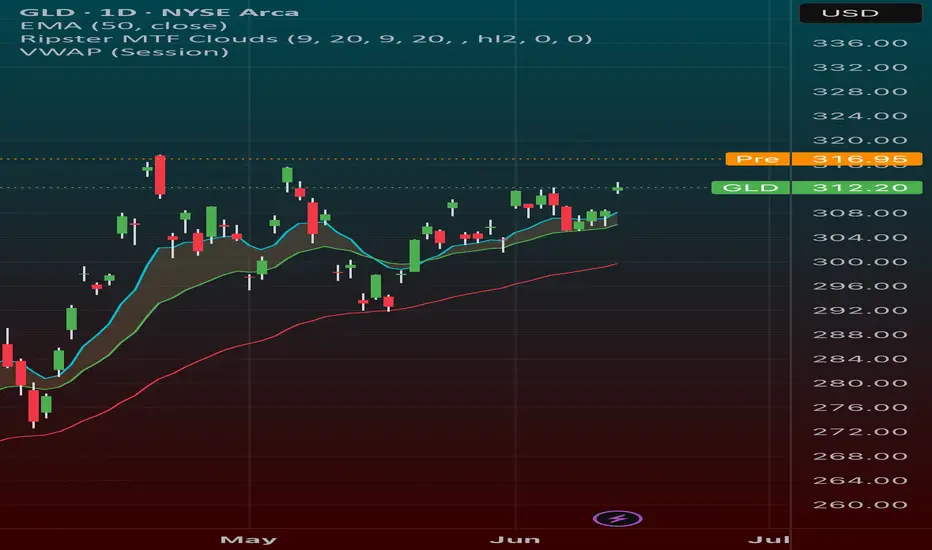
GLD Weekly Trade Setup — June 16, 2025🪙 GLD Weekly Trade Setup — June 16, 2025
🎯 Instrument: GLD (SPDR Gold Shares)
📉 Strategy: Short Bias via Puts
📅 Entry Timing: Market Open
📈 Confidence Level: 65%
🧠 Technical & Sentiment Snapshot
Current Price: $311.78
5-Min Chart: Below EMAs (10/50/200); RSI ≈ 34 → short-term oversold
Daily Chart: Above 10EMA ($309.94), RSI ≈ 56 → neutral-to-bullish
Bollinger Bands: Near lower band on M5 → volatility likely
Support/Resistance:
• Support: $311.68 / $307.28
• Resistance: $312.20 / $313.00
🗞️ Market Sentiment Overview
VIX: Elevated at 20.82 → high risk premium environment
Options Flow: Heavily put-weighted near $305–$310 strikes
Max Pain: $285 → bearish options bias into expiration
News: Geopolitical tensions increase flight-to-safety temporarily, but fading momentum fuels retrace setups
🔽 Recommended Trade: GLD PUT
Parameter Value
🎯 Strike $307.00
💵 Entry Price $0.84
🎯 Profit Target $1.25–$1.70
🛑 Stop Loss $0.50
📅 Expiry June 20, 2025
📏 Size 1 contract
⚖️ Confidence 65%
🧷 Trade Plan
📥 Entry: At market open
📈 PT Zone: $1.25 to $1.70 premium, based on drop to $306–307
🛑 Stop: If premium drops to $0.50 OR GLD breaks above $313
💰 Risk Mgmt: Keep exposure <2% of total account equity
⚠️ Key Considerations
Upside Risk: Sudden bullish shift or risk-off headlines can drive reversal
Time Decay: Premium erosion risk is higher if GLD consolidates
Volatility Drag: VIX dropping could suppress put premiums quickly
🧾 TRADE_DETAILS (JSON)
json
Copy
Edit
{
"instrument": "GLD",
"direction": "put",
"strike": 307.0,
"expiry": "2025-06-20",
"confidence": 0.65,
"profit_target": 1.25,
"stop_loss": 0.50,
"size": 1,
"entry_price": 0.84,
"entry_timing": "open",
"signal_publish_time": "2025-06-16 16:15:17 UTC-04:00"
}
💡 If GLD struggles to reclaim $312.20 at the open, the put setup becomes attractive. Breakout above $313? Exit quickly.
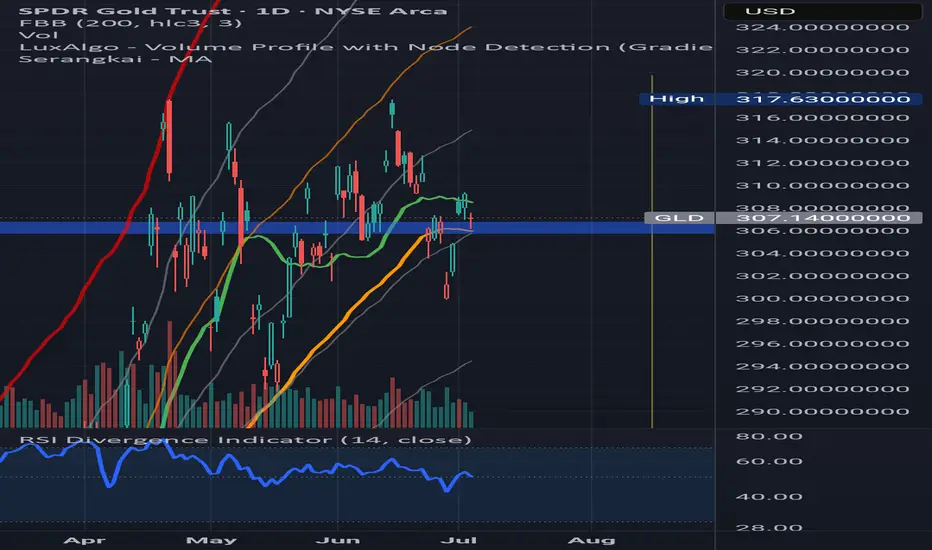
GOLD poised for breakout GLD & /gcAfter going on a huge run to 317 we have spent a significant time now basing out and consolidating we’ve come down into that 300 range and tested and built up quite a bit of support
With the Iranian intentions we could kickstart the next move in gold 317 is the breakout. I am looking to play this breakout on an intra day pull back with some calls one month out for a swing Trey looking at the 320 or 325 strike price
Gold - Falling VolatilityI've been selling option premium as momentum has fallen. Money is leaving gold and moving into silver.
As price reaches lower band, I'll be adding delta in anticipation of moves to much higher levels. Gold appears to be at the bottom on a long-term, rising channel and is providing positive long term opportunities.
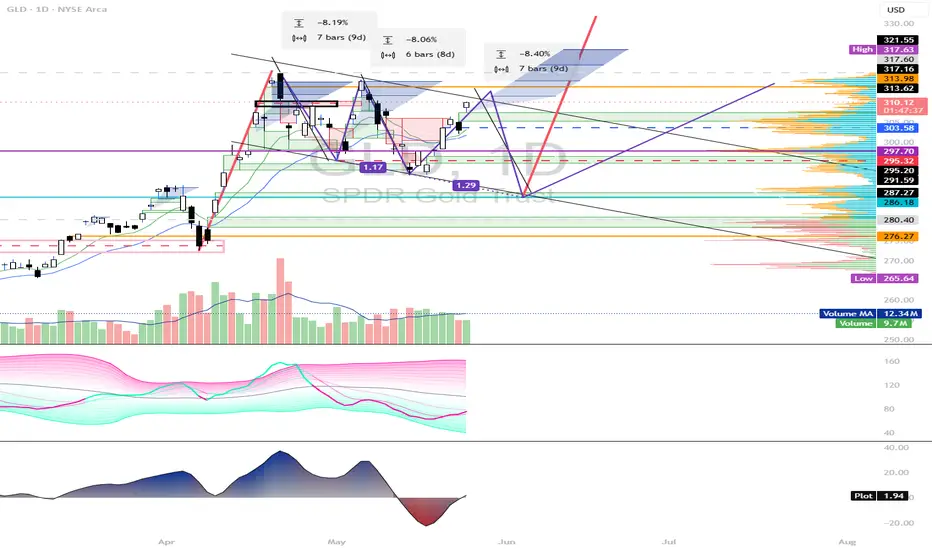
Three drive GLD setup, to simple?Gold is in a lot of media right now and everyone probably has some exposure, i myself am here and as are you. Im taking my chips and placing it on a short setup before a run if there is one. Three drives pattens on candles with bearish sentiment TA, LL, LH, opex is over, yada yada.
GL
GLD Swing Trade Setup – 6/18 $320 Call for 5–10 Day Breakout Mov🟡 GLD Swing Trade Setup – 6/18 $320 Call for 5–10 Day Breakout Move
📅 Trade Date: June 4, 2025 | 📈 Timeframe: 5–10 Day Swing
🎯 Playing a bullish continuation with defined risk & strong confidence
🧠 Multi-Model Consensus
Model Bias Strategy Strike Entry PT SL Confidence
Composite Mod. Bullish Long Call 320 1.68 2.52 0.84 75%
🔎 Technical & Sentiment Overview
Weekly Chart: Price > EMAs, clean bullish MACD crossover
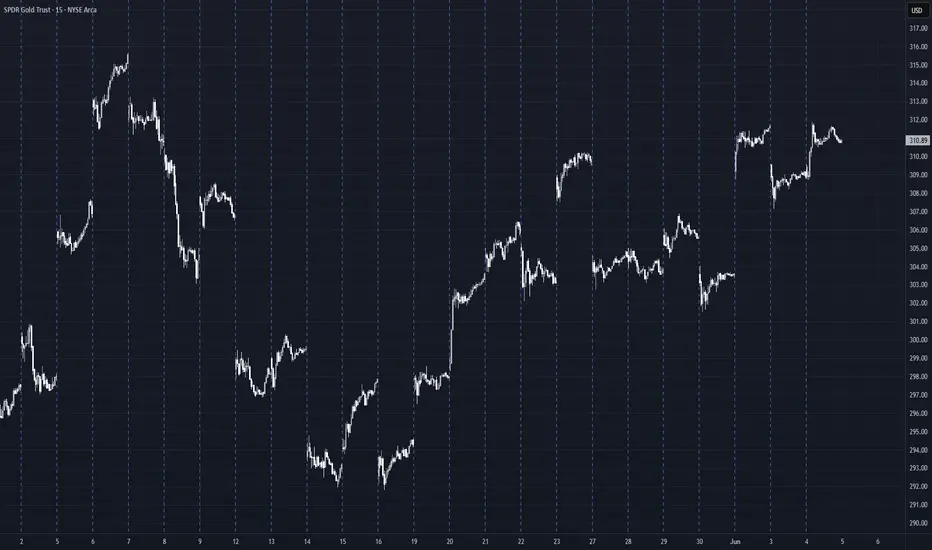
15-min Chart: Consolidating near $311–$313 support, breakout forming
Sentiment: Bullish news tailwinds (gold demand, USD weakening)
Max Pain: $308 = short-term pullback risk
Implied Volatility: Stable with limited crush risk
Options Flow: Moderate OI build in $313–$325 calls, upward bias
🎯 Trade Setup – Long GLD Call
Instrument: GLD
Direction: CALL (LONG)
Strike: $320.00
Expiry: 2025-06-18
Entry Price: $1.68
Profit Target: $2.52 (50% gain)
Stop Loss: $0.84 (50% loss)
Size: 1 contract
Entry Timing: Market open
Confidence: 75%
⚠️ Risk Management & Considerations
🛑 SL Discipline: Exit if premium drops to $0.84
🕒 Time Stop: Exit within 7–10 days if trade stagnates
🔁 News Risk: Watch for economic releases and dollar strength reversals
⚖️ Support Check: Must hold $310.50 zone on M15 chart
✅ Trade Thesis Summary
With GLD holding bullish structure on higher timeframes, models show strong agreement on upside continuation. We're targeting the $320 breakout with a controlled-risk weekly option.
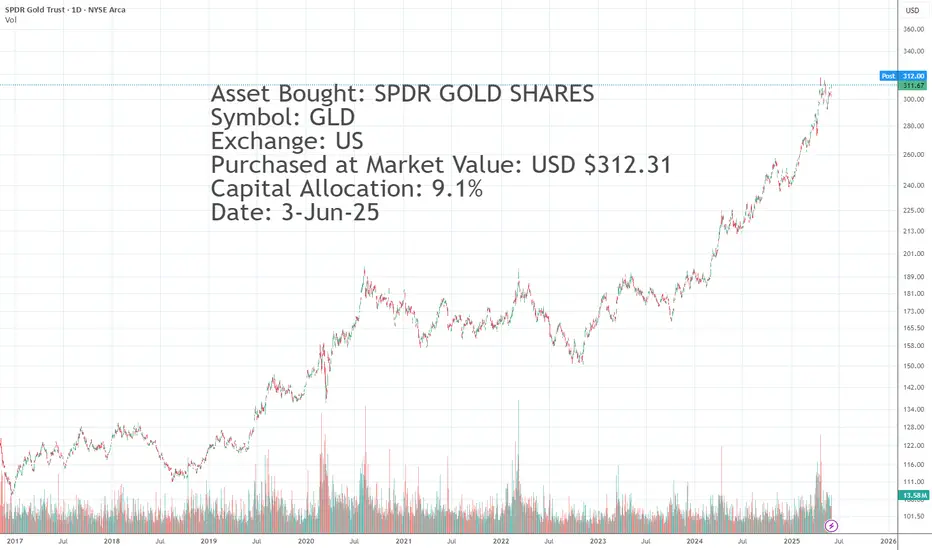
Asset Bought: SPDR GOLD SHARES Symbol: GLD Exchange: US PurchasAsset Bought: SPDR GOLD SHARES
Symbol: GLD
Exchange: US
Purchased at Market Value: USD $312.31
Capital Allocation: 9.1%
Date: 3-Jun-25
Market ReviewGoing into next week for me, I will be playing defensive now. The easy money has been made and now time to look to lock/take profits. Keep an eye on IWM for an inverted Head-and-Shoulder pattern soon. Cheers!

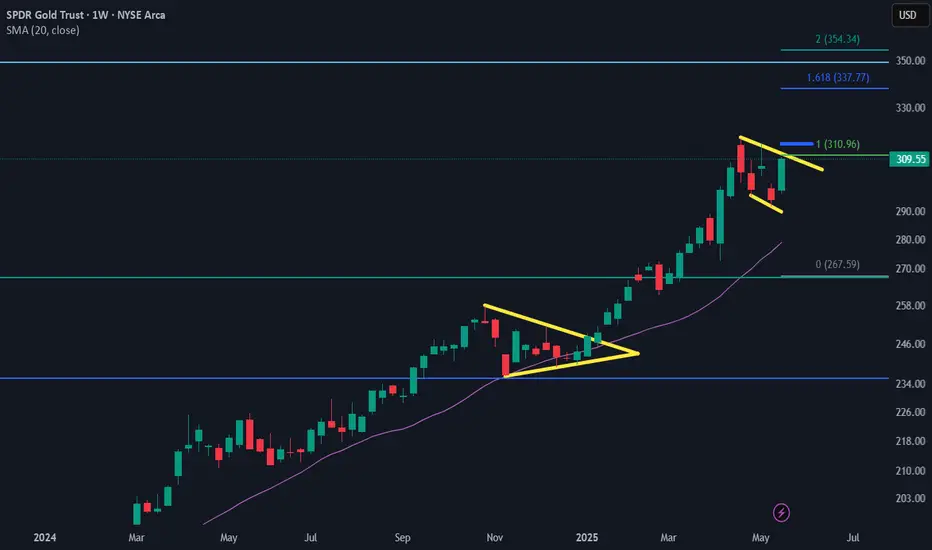
As Trump Destroys America Gold SoarsGold may be forming a bullish flag which has the price objective of $354.34. Additionally the anti-American policies enacted by Trump should continue to support bullish Gold market
AMEX:GLD
COMEX:GC1!
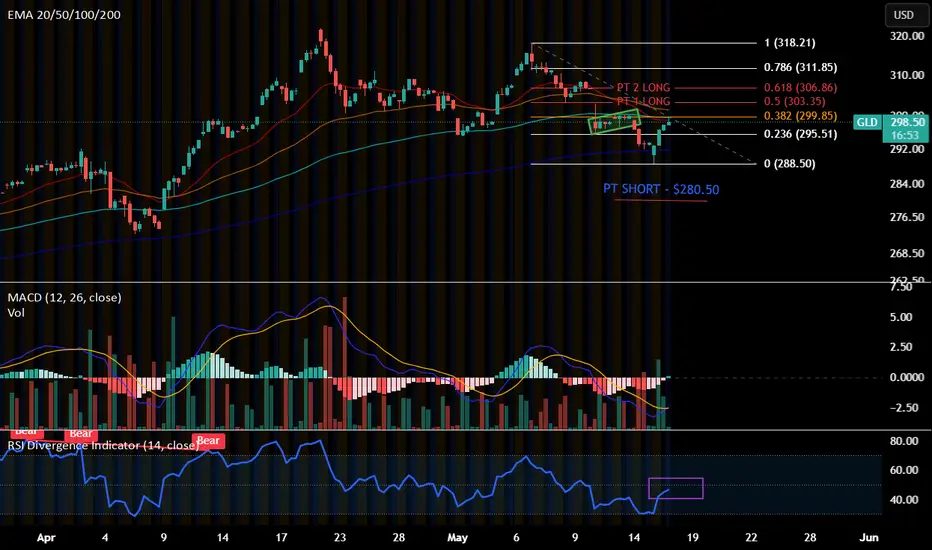
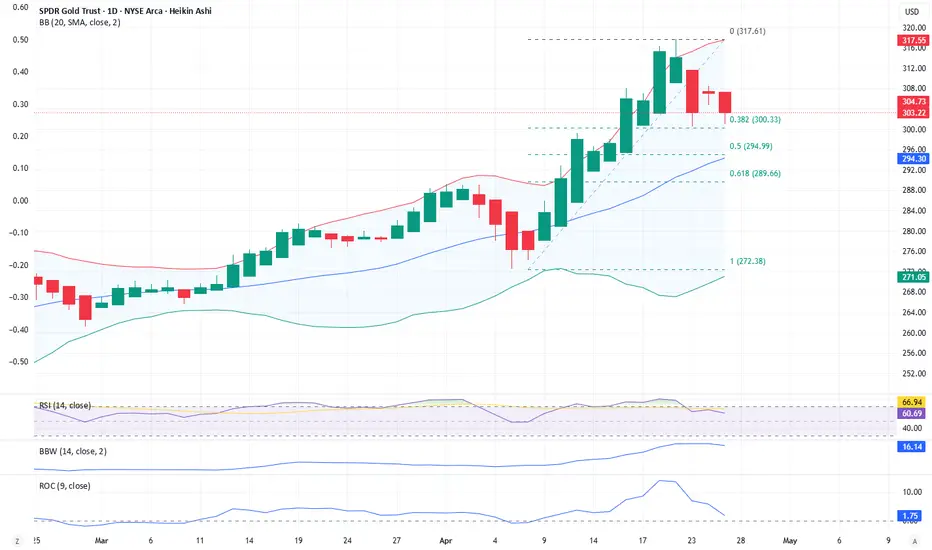
Neutral - GLD (Short-term) & Short (Long-term)A. Short-term: NEUTRAL
Daily chart pattern: Double top
RSI: Close to 50. Needs to cross 50 to turn bullish momentum
1. Double top confirmation
- Fib 0.382 rejects at $299.85
-> Enter PUT option for PT: ~$280.5
2. Failed double top
- Pass fib 0.382 at $299.85 to gap up
-> Enter CALL option for PT1: ~$303
PT2: ~306.5
B.Long-term: PUT
Overall long-term opinion: LEAP PUT for GLD with expiration date more than 1 year. PT: ~200
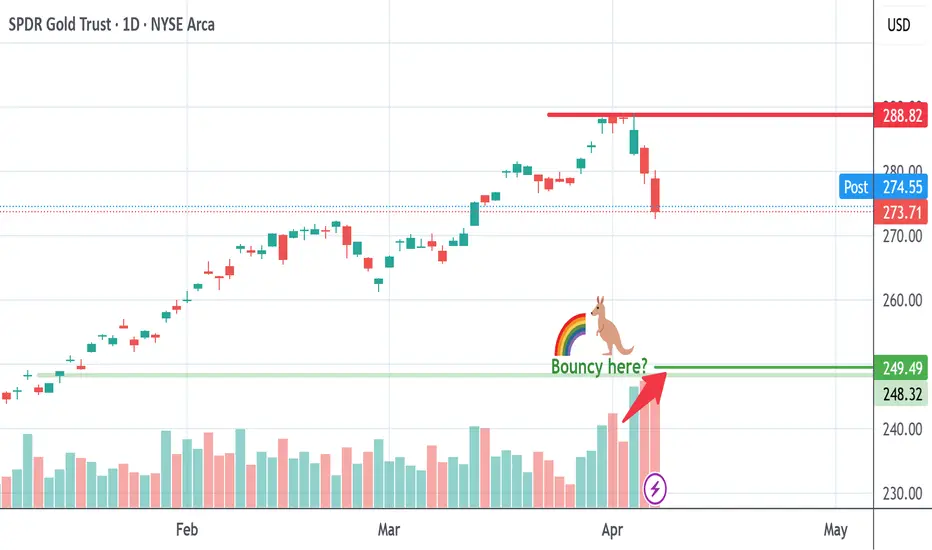
GLD where to?My dowsing work suggested a high around $288 on GLD, which obviously worked out (see prior idea). There's often a decent reversal opportunity once levels are hit. This one was golden... Wah-wah.
I'm trying not to over ask on things because with my work, I think it opens the door for misleading information or confusion on my part.
Simply put, the guidance was to get a date from the past, which was Jan. 10th. Look to revisit that price, which happens to correlate with the area of the 200 sma. When I asked what price from the H/L of that day, I get $249.
I drew a line to show the reference candle from January.
I ask what date this may occur by & get May 15th, but another date came of July 26th. There's some big stuff I think happening in indexes too in June/July. Dates are often reversals, but can be nothing. You just never know, but odds are more often they are something.
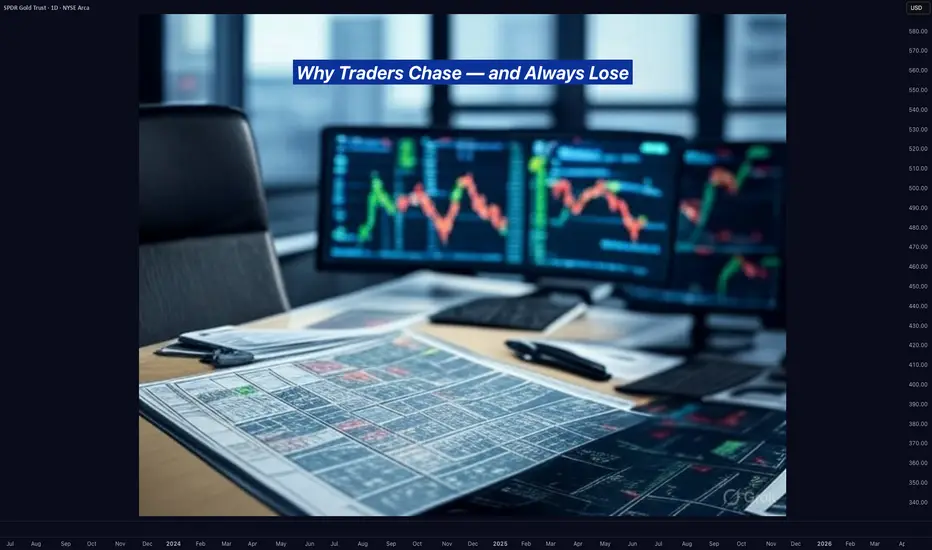
Why Traders Chase — and Always LoseHard truth:
You don’t miss opportunities. You chase noise.
Let’s break down the real reason you keep “missing moves”:
1. FOMO is not urgency — it’s confusion.
When you enter because “everyone’s talking about it,” you’re not trading a setup. You’re reacting to social proof.
2. Volatility ≠ opportunity.
Big moves look attractive, but if they’re not in your plan — they’re distractions, not trades.
3. The market rewards patience, not activity.
Every click, every chart, every refresh feeds your dopamine — not your edge.
🚫 Solution?
Stop scanning. Start filtering.
Use tools that prioritize structure over noise. That’s why we built TrendGo — to give clarity in chaos and help you avoid traps masked as opportunity.
📌 Don’t chase. Build your edge.
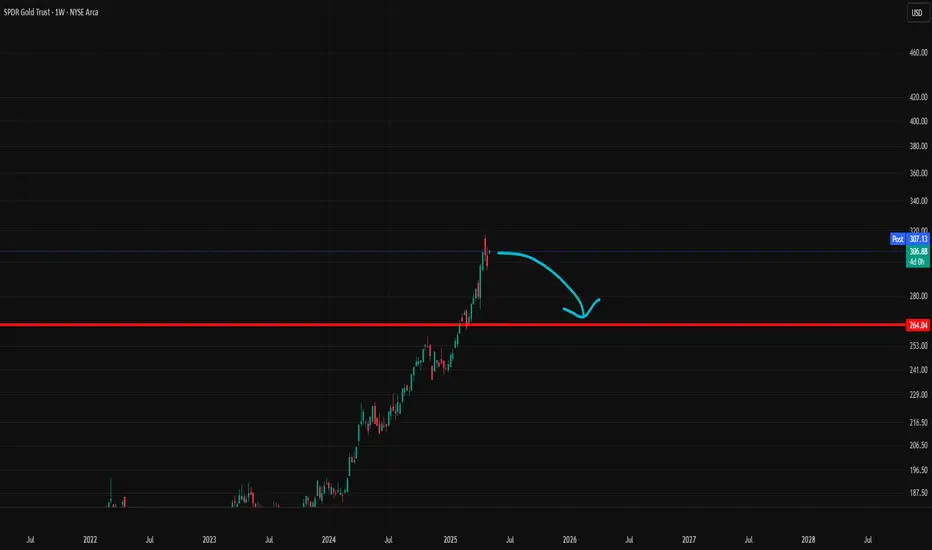
Gold is going to retrace back to 264.04Gold is going to retrace back to 264.04. Its time to buy a lot DULL .
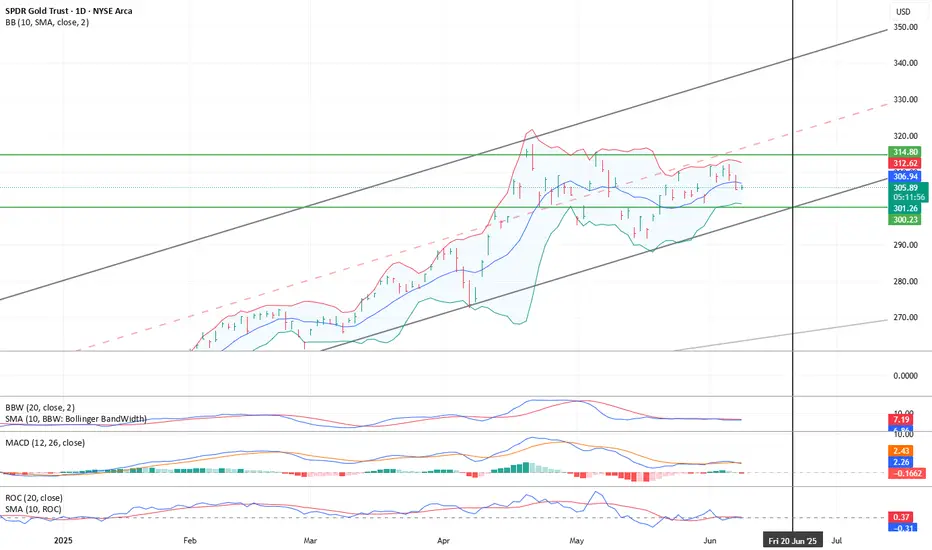
Gold - Time for a BreatherHigh probability that GLD will move to the 20 day moving average at 295. The BBW indicator shows that momentum is softening. At this signal, prices generally revert to the mean or in some cases, sell off quickly to the -2 standard deviation.
I've been using the futures to hedge my positions. Interesting that the CME has come out with a 1 oz gold future. The gold casino is really starting to open up.
GLDGold has extended slightly passed the 2.618 extension fib and then began to fall back down. It is too early to tell if price has finally topped or not. It is no coincidence though that it started moving lower as the market started moving higher. I believe that any drop in price for gold is only temporary. It will, IMO, begin to move higher again around the time this larger consolidation of the indices completes.
Should price start to move higher again, we will need to look towards the 2.786 & 3.0 for points of resistance. However, if a local top is in fact in place, we would then continue lower in an overlapping/choppy fashion. I will update as it warrants.

GLD Will TOP SOON - Good For Crypto and AltsGLD has been on a tear lately, but I believe the rally will come to an end next week. This will be good for BTC and Alts. First looking at the RSI on GLD we can see it is now overbought on a monthly and this somehow coincides with the April 2 deadline on Tariffs. IMO I think this is a trap and GLD will begin to fall after it reaches just above the line I have in the chart.
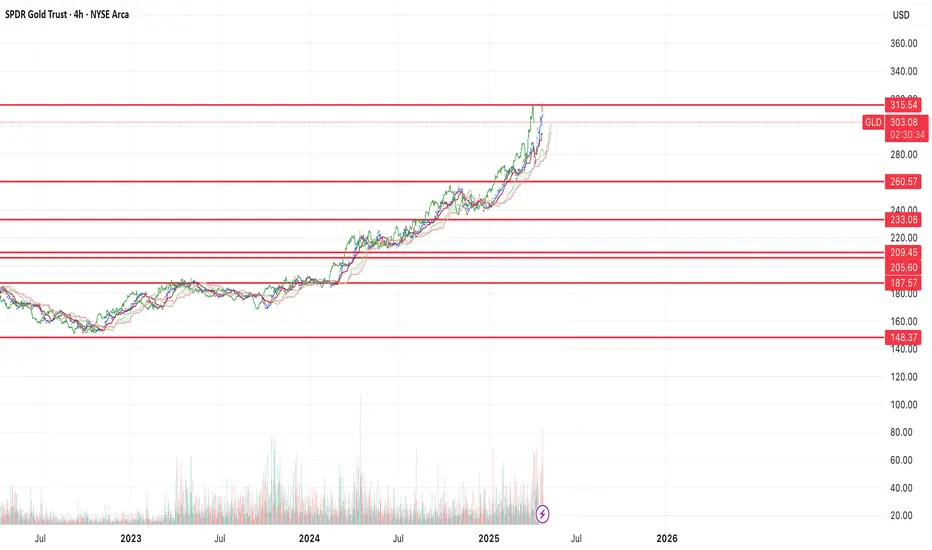
$GLD short term top in $260-148 target on the downsideAMEX:GLD looks a bit extended here. I could see the possibility of GLD falling back to the $260 support at a minimum and maximum all the way down to $148
The $209 support would be the 50% retracement of the recent run. I like that as a level for a bounce.
Let's see where we end up.
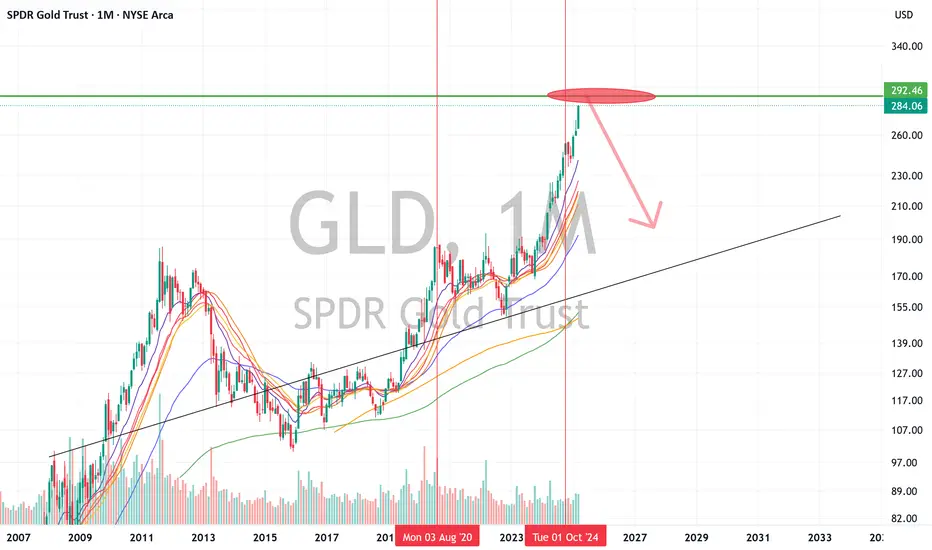
Decoding Gold's Ascent Through Fibonacci Channels.The price of gold has been exhibiting a discernible pattern, closely tracking Fibonacci channel levels. This upward trajectory, characterized as a "gold buyers' train," has seen the price ascend through various Fibonacci channels.
Notably, the price encountered resistance and stalled upon reaching a key Fibonacci level, often referred to as the "golden ratio" or a similar significant Fibonacci retracement or extension point.
This phenomenon has been observed repeatedly; since 2020, the price action has twice reached and subsequently been halted at specific Fibonacci channel levels, suggesting these levels act as strong areas of either support or resistance depending on the direction of the movement.
Currently, the price is approaching a third Fibonacci channel level, implying a potential continuation of this established pattern and requiring careful monitoring to determine if the same resistive behavior will manifest again, or if the price will finally break through to higher levels within the Fibonacci sequence.
This repetitive interaction with Fibonacci levels underscores their significance as potential indicators of future price movements in the gold market.

Gold ETF (GLD): Volume-Powered Breakout
GLD has gained 60% since breaking out at 191.65 in March 2024. It now aims for 318.85, with a longer-term target of 350.65 if the macro backdrop continues to deteriorate.
Demand Drivers: Safe haven flows, central bank accumulation, and the loss of confidence in USD-backed bonds. Volume confirms conviction buying.
Strategic Implication: GLD is confirming the broader shift out of fiat and into hard assets. Investors expect instability to persist.
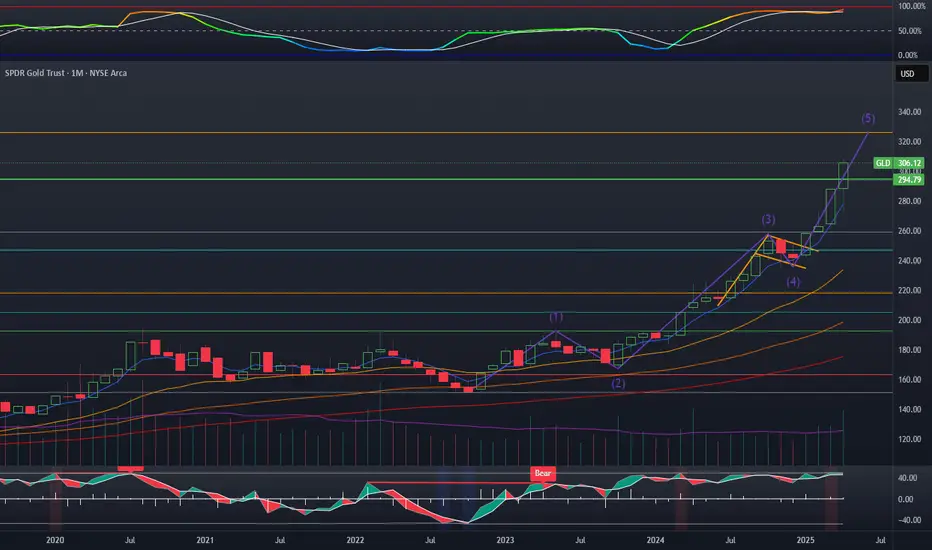
GLD gold to top at 327GLD has been absolutely ripping during market uncertainty, and if you account for the 50% retrace on SYX it is not outperforming. I drew a fib extension and looked at a wave analysis for a potential top, they are in alignment. BBWP is nearing firing red and the advanced stochastic cannot stay up here forever. Given that this is a monthly chart we should see a bit more upside, could take a few weeks.
Summary:
Golden fib extension matches 5 wave projection amid elevated volatility and buyer strength, should see a pull back between 320-330
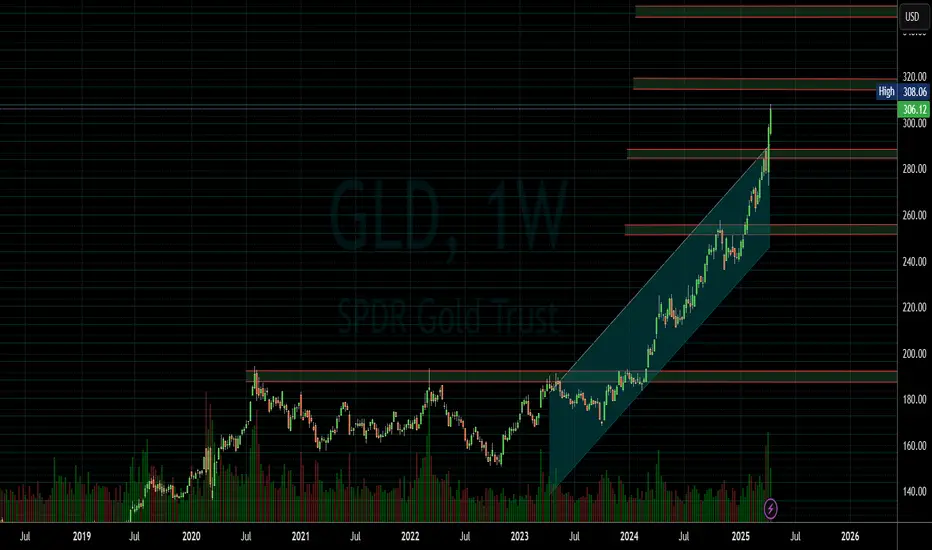
Perfect trade setup: $GLD to 325; DXY to 95Gold has been in a raging bull market since 2023 with the index making new higher highs and higher lows as shown in the weekly candle stick chart. In contrast the Dollar index TVC:DXY is making new lows every single day shown in dark blue line chart. In this blog space we have been continuously talking about the weakness in the Dollar and the major support and resistance levels in TVC:DXY for more than 3 months. As the TVC:DXY is below the psychological level of 100 and most probably heading lower where 95 is the key support level, I think the time for commodities like Gold has arrived. SPY Gold Spot ETF AMEX:GLD has made an ATH of 302 which is above the key psychological level of 300.
In my opinion AMEX:GLD is not done going up. If we plot the Fib retracement levels for the previous bear market ending in 2022, we see that AMEX:GLD can effectively reach 325 level which is the 4.236 fib level. This will indicate another 7% upside, a similar amount of potential downside in the $DXY.
Verdict: Long AMEX:GLD , Short TVC:DXY until trend reversal.
