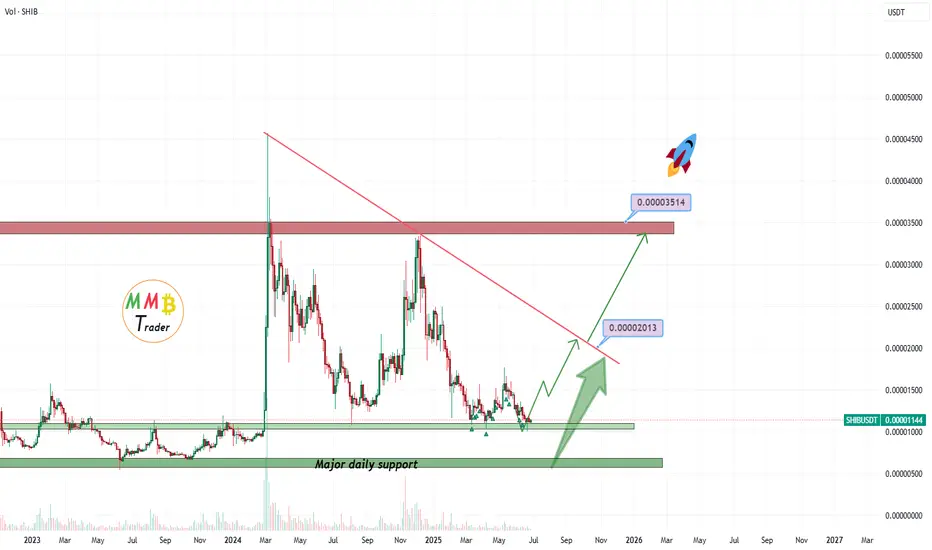
SHIBUSDT lowest and strong support is ahead As we can see price is near major daily support zone now and here we have one of the last daily supports which is currently touching and price can easily receive bull candles and start pump like green arrows if the supports hold.
DISCLAIMER: ((trade based on your own decision))
<<press like👍 if yo
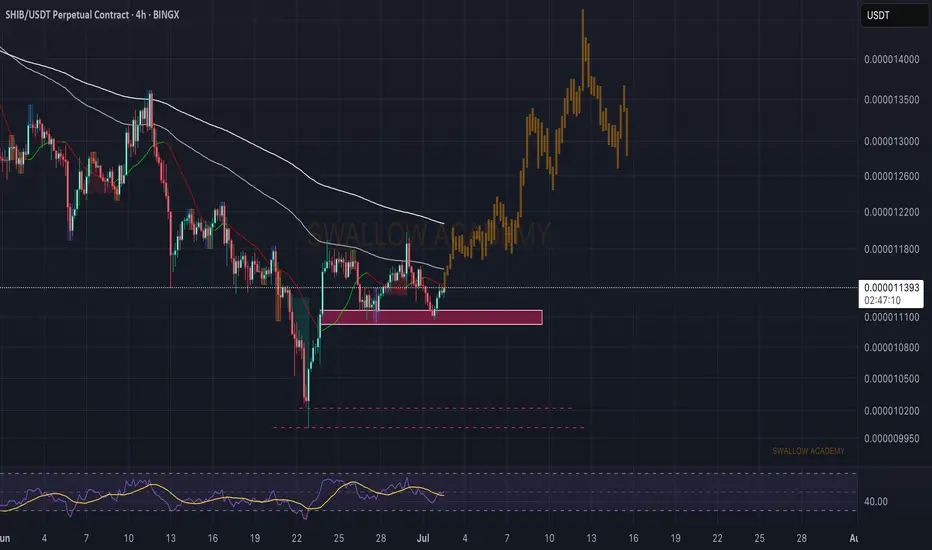
Shiba Inu (SHIB): Seeing Buyside Dominance, Looking For BreakoutShiba has formed a decent foundation near the local support area, while on the bigger timeframes we are seeing that the price is at a major support area.
With that being said, we are seeing a potential breakout happen, which would lead us to another bullish movement. We are keeping this game plan
Shiba Inu (SHIB): Looking For Bounce From Current AreaShiba caught our attention with recent hovering near the local EMA area, where we have established some sort of supportive area. As we see the strength of this area, we are looking for a proper bounce from here, which then would give us a chance to get 10-20% of movement.
Swallow Academy

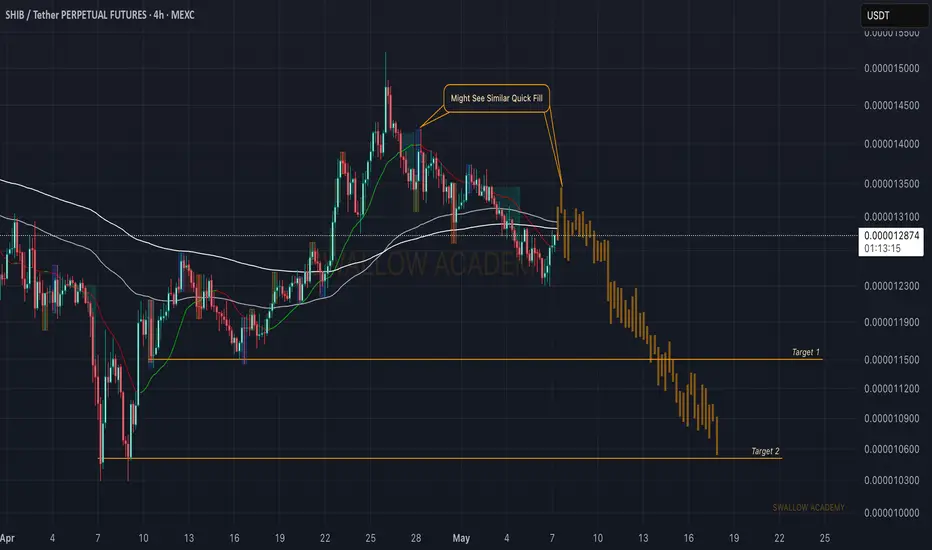
Shiba Inu (SHIB): Possible Quick Fill of CME & Downward MoveSHIB has recently broken the 200EMA line and is currently retesting that area. Now, the 200EMA has been a strong downtrend holder for a very long time on SHIB (if we look at a wider chart).
With the recent fakeout above that EMA, we expect the price to continue that decline but before that, we migh
Shiba Inu (SHIB): Approaching Bounce Zone | Bullish TrendSHIB has reached the lower side of the bullish trend, which has aligned with EMAs (just as in previous times). We are looking for a bounce to happen from here, which would give us a nice R:R position that we can take from here.
Now we are looking for proper dominance from buyers to be seen; after

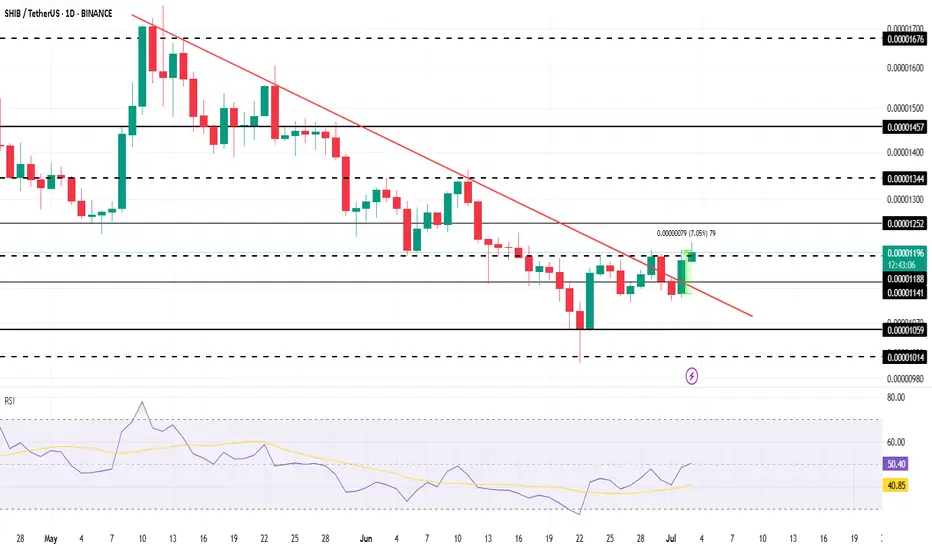
SHIB Escapes 2-Month Downtrend, RSI Signals Rally Ahead BINANCE:SHIBUSDT price has climbed by 7%, reaching $0.00001198 at the time of writing. This upward movement has allowed SHIB to escape a two-month-long downtrend, signaling a potential shift in market sentiment.
SHIB's technical indicators are showing signs of bullish momentum. The Relative S
Is shib getting ready to plot a Giant W on the 1W? Last year in December I spotted a W on the one week and subsequently the shib took off. Here we are one year later this time the W, If completed, is about 10 times larger than the last one. Many assets are lining up with an early February blow through the roof. Keep your eyes open and good luck!

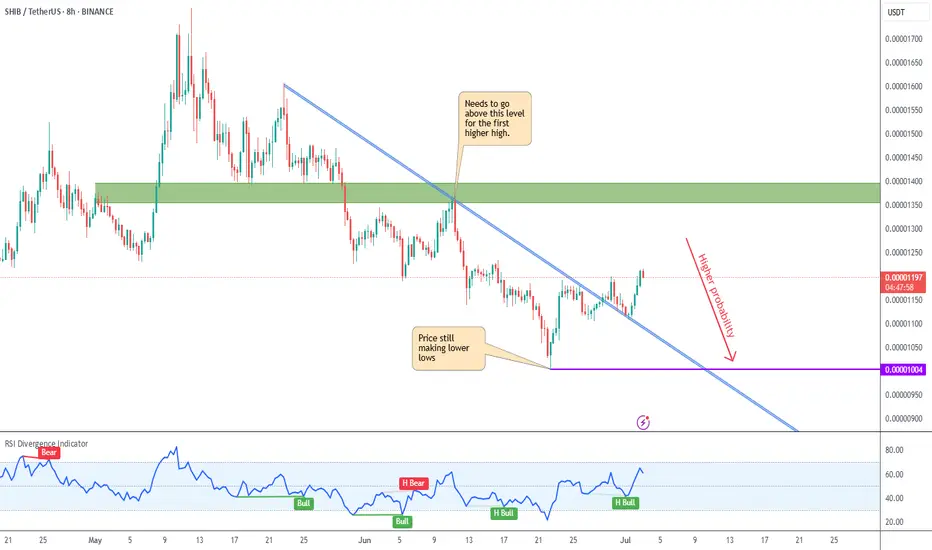
SHIB AnalysisAlthough price has been recovering for the last couple of weeks, I still don´t see clear reversal indications.
We have yet to see a higher high / higher low, or bullish RSI divergence. These are key to consider a reversal.
The green resistance zone is a key level to be broken for a bullish bias
Location, Location, Location!!!Knowledge is Power!
But how deeply do most people really understand this?
The average mind thinks power comes from possessing knowledge. But here’s a deeper truth — simply imagining yourself with mastery can trigger powerful feelings. Why? Because as Terence McKenna once described, the human brain i

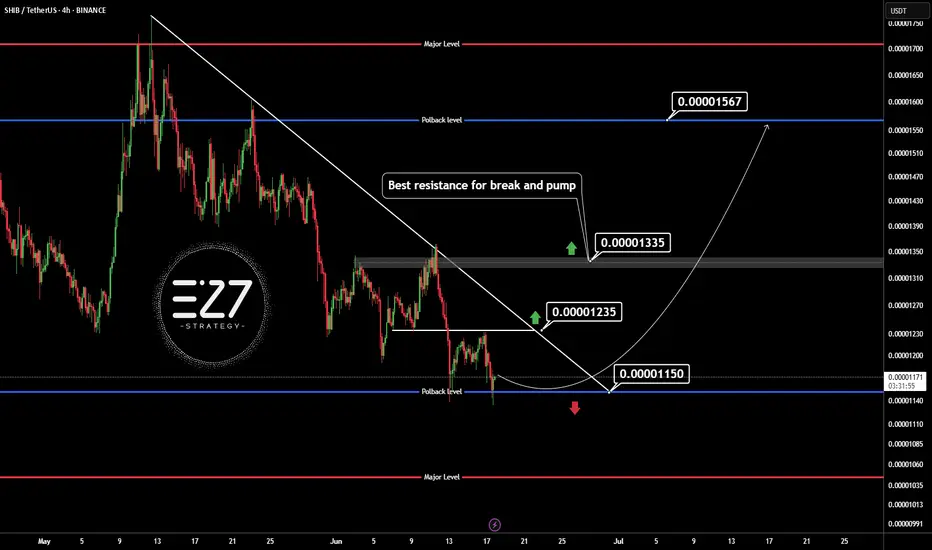
SHIBUSDT🕯 The key resistance level, identified as the best resistance for a break and pump, stands at 0.0000135, with a potential price increase to 0.00001567 if breached, serving as the next target (Pullback level). On the support side, the main level is observed at 0.0000115, and should the price fall bel
See all ideas
Summarizing what the indicators are suggesting.
Oscillators
Neutral
SellBuy
Strong sellStrong buy
Strong sellSellNeutralBuyStrong buy
Oscillators
Neutral
SellBuy
Strong sellStrong buy
Strong sellSellNeutralBuyStrong buy
Summary
Neutral
SellBuy
Strong sellStrong buy
Strong sellSellNeutralBuyStrong buy
Summary
Neutral
SellBuy
Strong sellStrong buy
Strong sellSellNeutralBuyStrong buy
Summary
Neutral
SellBuy
Strong sellStrong buy
Strong sellSellNeutralBuyStrong buy
Moving Averages
Neutral
SellBuy
Strong sellStrong buy
Strong sellSellNeutralBuyStrong buy
Moving Averages
Neutral
SellBuy
Strong sellStrong buy
Strong sellSellNeutralBuyStrong buy
Displays a symbol's price movements over previous years to identify recurring trends.