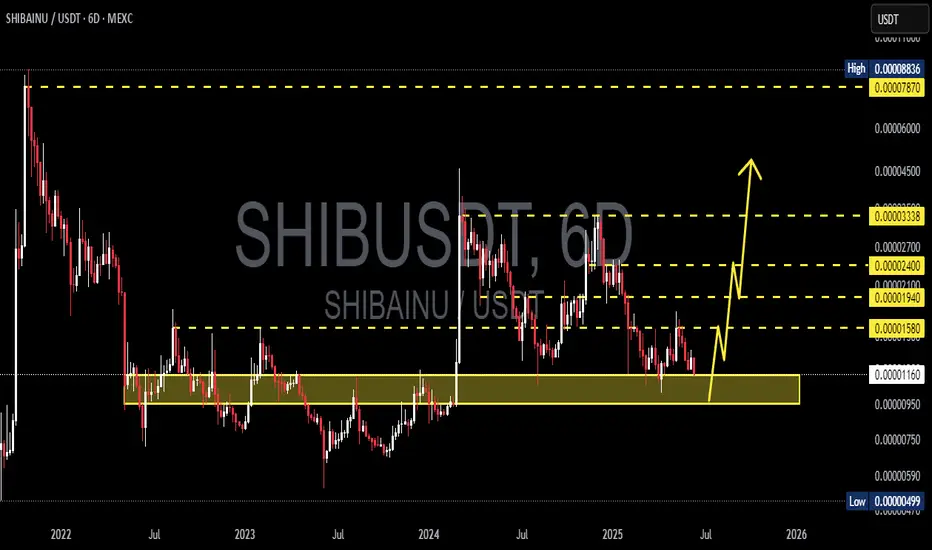
SHIBUSDT soon after breaking red trendline can pump hard On this pump for market we may not have a new ATH for coins like SHIBUSDT or we may have(10% possible).
But as we can see price had a huge amount of fall and now with simple touch near previous daily high we earn good +200% profit.
DISCLAIMER: ((trade based on your own decision))
<<press like👍 if y

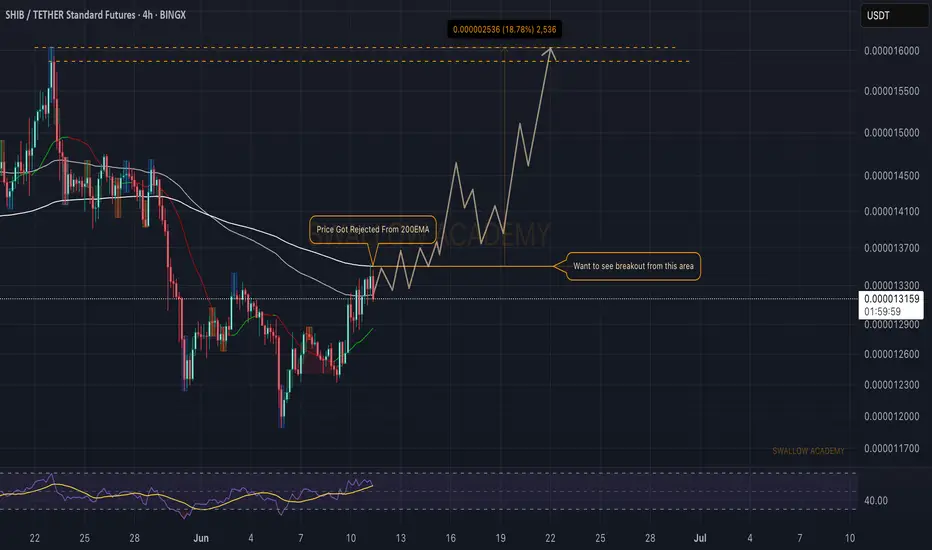
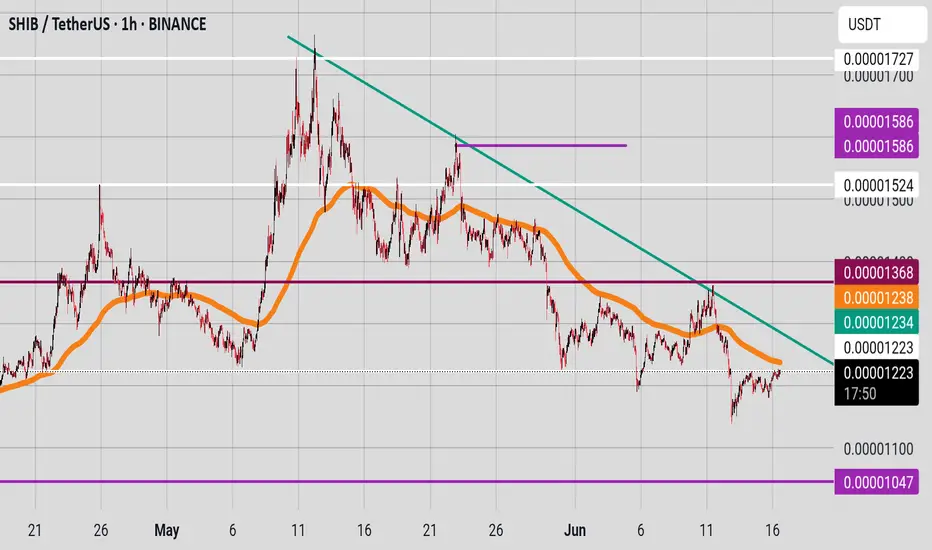
Shiba Inu (SHIB): Waiting For Buyers To Break 200 Moving AverageShiba had recently been rejected by 200EMA, and since getting rejected, the price has been falling and sellers are starting to show dominance, but this does not mean that we are entering yet into a bearish trend.
As we got a rejection, now we are waiting and going to monitor how the next candles w
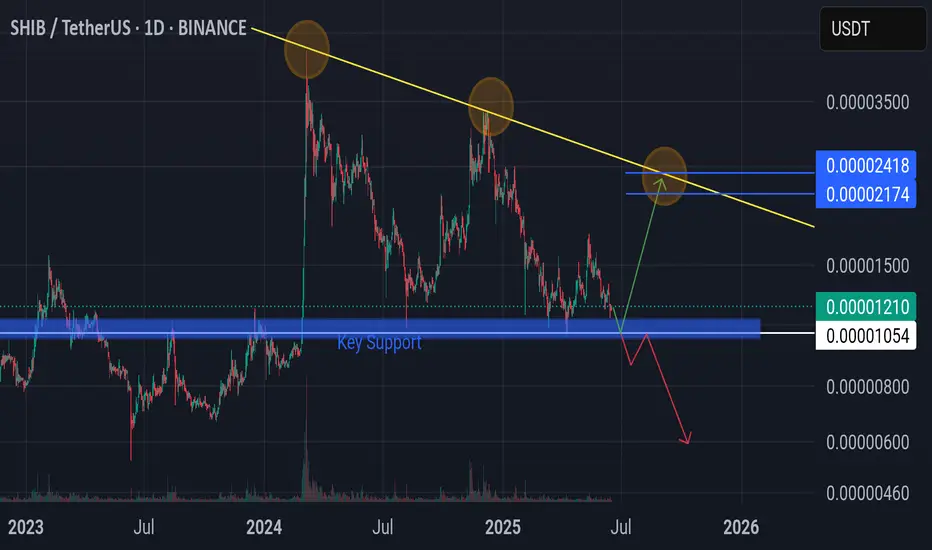
Shiba Inu!! next chapterCurrently near key support. potential reversal towards target 0.000021-0.000024.
⚠️ Invalid if falls below key support 0.00001054.
SHIB/USDT is in Bullish TrendSHIB/USDT is looking good to go up side it is showing good retracement on daily chart and also showing bullish divergence on daily chart it can be buy current price or if some one want to be more sure then buy after new HH

SHIBUSDT: Price Weakness & Your Next Short OpportunityMy focus is on SHIBUSDT, and the picture is clear: price is weak. This isn't a market where buyers are proving their strength; in fact, the opposite is true.
Most traders are confused by volatility. But you need to see the real opportunity. My analysis points to this: both red boxes I've marked on
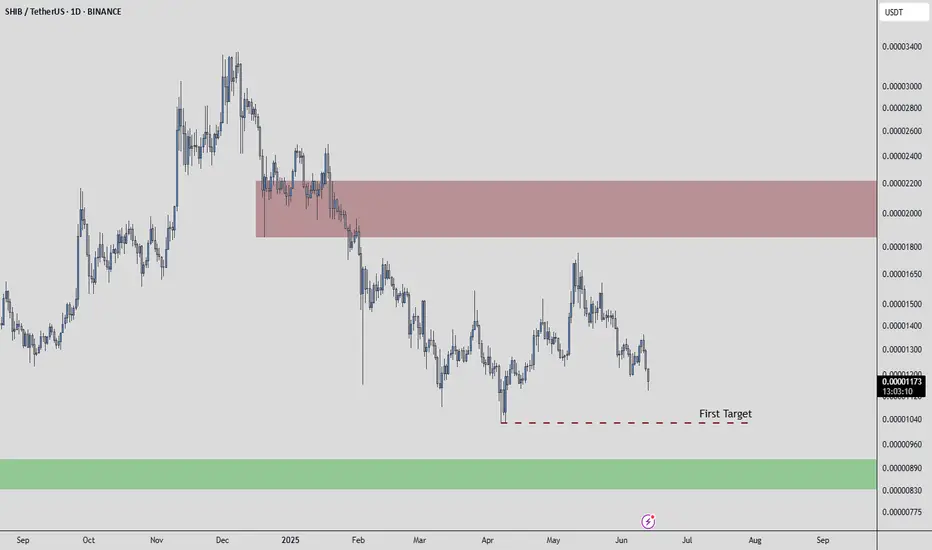
SHIB Accumulation Phase: Double Bottom Formation SHIB is currently trading sideways on the daily timeframe, showing signs of accumulation as price consolidates between well-defined support and resistance levels. The lack of directional breakout has kept the market in range, but recent structure suggests that buyers may soon gain control — if key s

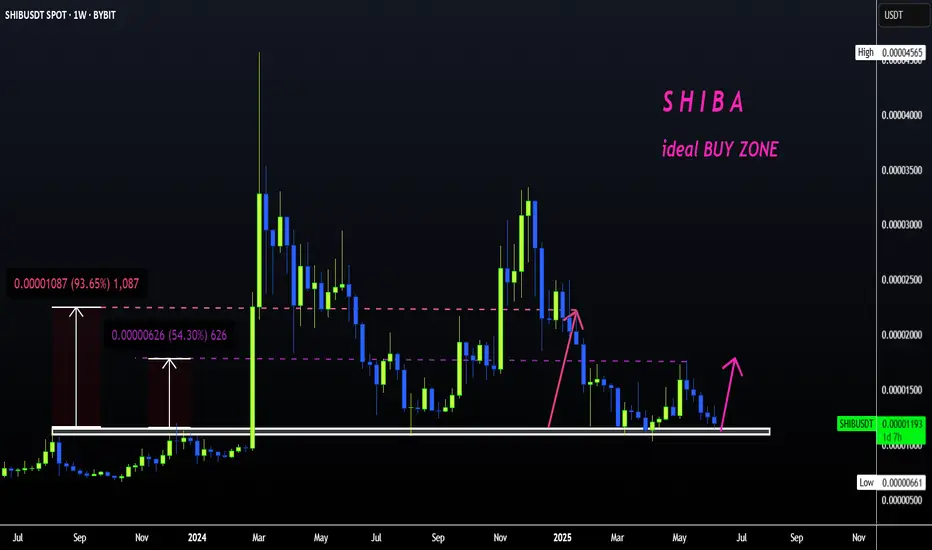
SHIBA +100%?? | BEST Buy OPPORTUNITYSHIBA has been in a downtrend for many weeks.
From here, upside is likely - especially if we look at the consecutive amount of "red" weekly candles (blue on this chart).
A 40% bounce zone is easily possible from this zone. Even at modest, 20% would be ideal:
____________
BYBIT:SHIBUSDT
The trendlineSHIB needs to beat the 0.00001223 key level and then the 200 EMA at 0.00001238 and then that downward trendline, to get the bulls fired up.

SHIBUSDT 6D Analysis SHIB ~ 6D Analysis
#SHIB Buy back gradually from here if you still have confidence in this coin with a short term target of at least 20%+ from this support.
See all ideas
Summarizing what the indicators are suggesting.
Oscillators
Neutral
SellBuy
Strong sellStrong buy
Strong sellSellNeutralBuyStrong buy
Oscillators
Neutral
SellBuy
Strong sellStrong buy
Strong sellSellNeutralBuyStrong buy
Summary
Neutral
SellBuy
Strong sellStrong buy
Strong sellSellNeutralBuyStrong buy
Summary
Neutral
SellBuy
Strong sellStrong buy
Strong sellSellNeutralBuyStrong buy
Summary
Neutral
SellBuy
Strong sellStrong buy
Strong sellSellNeutralBuyStrong buy
Moving Averages
Neutral
SellBuy
Strong sellStrong buy
Strong sellSellNeutralBuyStrong buy
Moving Averages
Neutral
SellBuy
Strong sellStrong buy
Strong sellSellNeutralBuyStrong buy
Displays a symbol's price movements over previous years to identify recurring trends.