Shib/Usdt Idea Shib/USDT Technical Analysis:
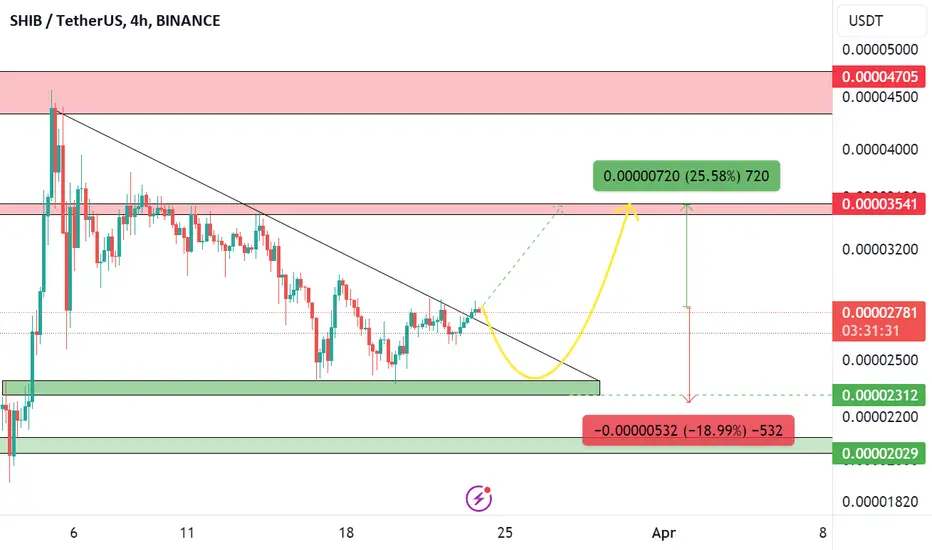
The Shib/USDT trading pair is currently witnessing a pivotal moment as its price is situated on the cusp of a potential breakout. Specifically, the price of Shib/USDT is attempting to surpass the trendline resistance level on the 4-hour time frame chart. If this breakout successfully materializes, market analysis suggests a potential bullish rally ranging between 30% to 60%.
It is important to note that trading and investment decisions should not solely rely on this analysis, as unexpected market movements can occur. This information is provided for educational purposes only and should not be considered as financial advice. We recommend conducting thorough research and using risk management strategies when making trading decisions.
SHIBUSDT.PS trade ideas

SHIBUSDT Shiba- Don't Miss Out! Buy Now for the Next HUGE PUMPInvestor attention is currently fixated on Shiba Inu (SHIB), and for good reason. Analysis reveals a prime opportunity for substantial gains, with an estimated 90% pump expected in the near future. Positioned within a huge area ripe for exponential growth, SHIBUSDT presents an unparalleled opportunity to potentially double your investment. The combination of market dynamics, increasing investor interest, and a surge in trading volume indicates an impending bullish rally. With the potential for such significant gains, now is the time to capitalize on this trading idea. Don't miss out on what could be a lucrative opportunity to maximize your returns with SHIBUSDT.

SHIB ANALYSIS🔮 #SHIB Analysis 💰💰
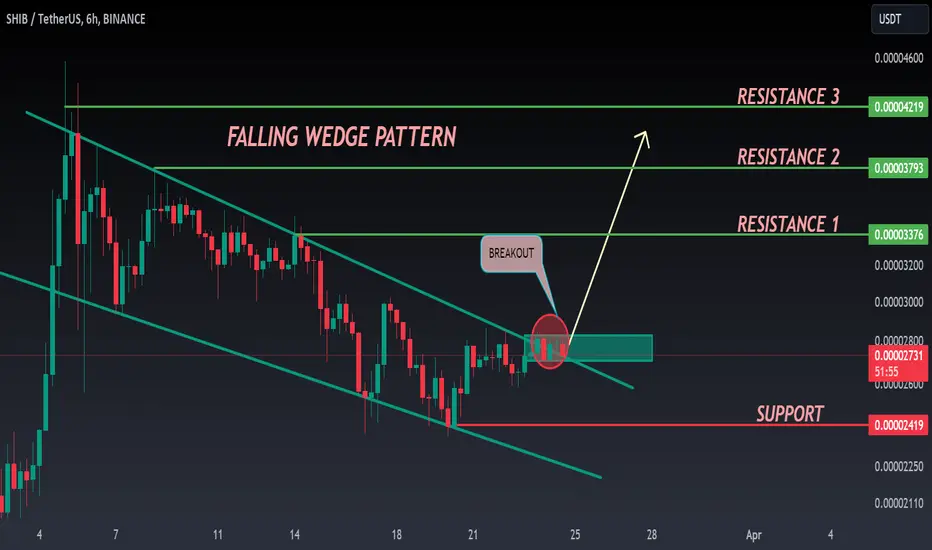
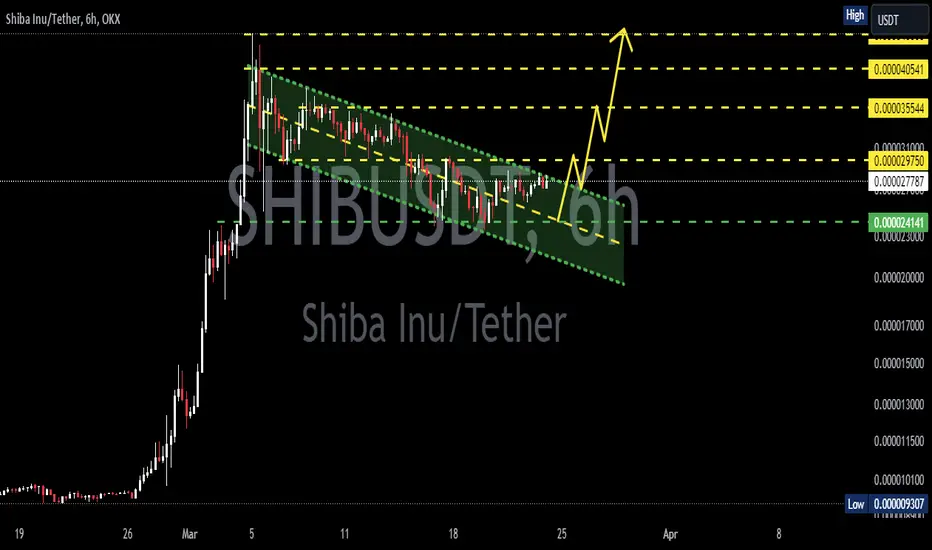
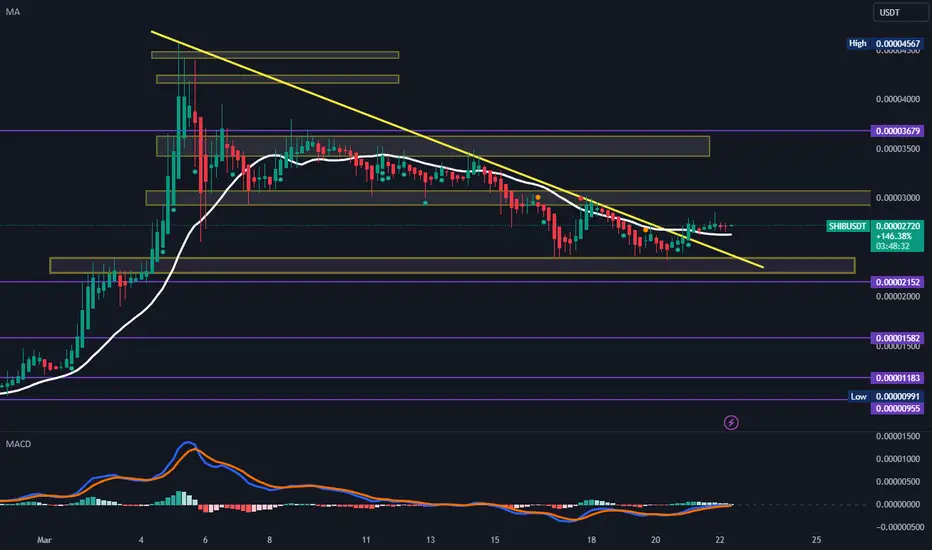
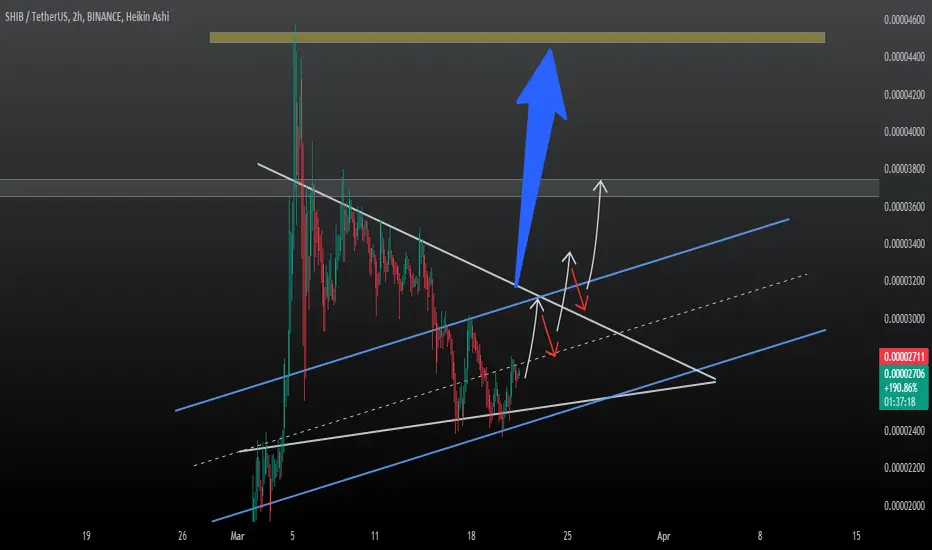
🌟🚀 As we can see that #SHIB was following Falling Wedge Pattern in 6hr time frame and gave a breakout. Currently #SHIB is trading in a parallel channel. Broken out of parallel channel could lead to a bullish rally📈📈
🔖Current Price --- $0.00002730
🎯Target Price -----$0.00003793
⁉️ What to do?
- We have marked some crucial levels in the chart. We can trade according to the chart and make some profits in #SHIB . 🚀💸
#SHIB #Cryptocurrency #DYOR
SHIBA 4h analysis ✅↗️SHIBA Make a purchase after successfully breaking this resistance line or buy after Retesting the nearest support. with a minimum target of +15%

SHIBAUSD 6HSHIB ~ 6H 📈
CRYPTOCAP:SHIB Make a purchase after successfully breaking this resistance line or buy after Retesting the nearest support. with a minimum target of 15%+
1D TF SHIB/USDT price might move higherKUCOIN:SHIBUSDT Moving average line and RSI has exited downtrend channel, at this moment it is worth of observing moment while price it self is coming close to downtrend channel border.
Note: It is not a financial advice.

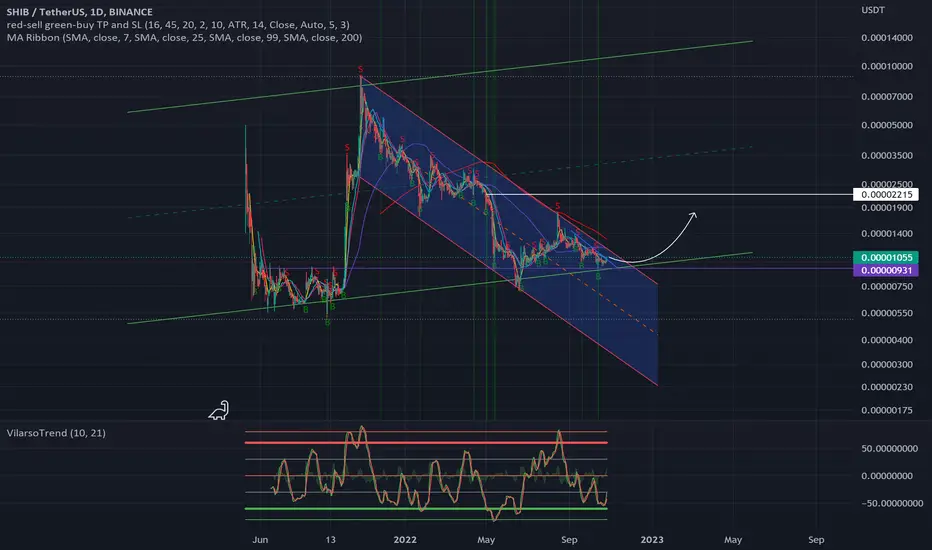
SHIBUSDT long ideaBINANCE:SHIBUSDT has broken local downtrend line and heading forward global downtrend channel's upper border.
In general, Shib is almost at the bottom of the global channel.
For study purpose only.
SHIBA INU Very early right now for big pumpsSHIB/USDT
2W chart looking like its about to form a bullish divergence shortly in the RSI (bottom)
Shiba has already retested the previous broken support and got rejected so we ccan confirm its a valid resistance.

The possibility of growth for this currencyThis currency is located in a triangle and the possibility of its growth is high
Support and resistance ranges are clear in the chart
You can enter it with capital management
SHIB Monthly Close Above $0.000027 Key to Potential GainsShiba Inu (SHIB) is showing signs of life on the monthly charts. I am closely watching the price action, with a potential breakout hinging on the upcoming monthly close.
Crucial Level: $0.000027
A monthly close above $0.000027 could be a bullish catalyst for SHIB. If this level is breached, I project a price surge towards a range of $0.000037 to $0.000045. This represents a potential upside of 37% to 67% from current levels around $0.000024.
Downside Risks Remain
However, caution is advised. A monthly close below $0.000025 could trigger a sell-off, pushing SHIB down to the $0.000018 support level. This translates to a potential decline of 25% from current prices.
I recommend DYOR before trading and investing it.


SHIBUSDT new support zones nowWe are looking for range market or even short-term fall for a while but soon after that from major supports mentioned on the chart we can expect rise and pump like previous time.
DISCLAIMER: ((trade based on your own decision))
<
SHIB look bearishConsidering the lower L's, it seems that SHIB intends to move towards the specified demand
By maintaining the supply range, it can drop the demand side.
Closing a daily candle above the invalidation level will violate this analysis
Note that the financial market is risky, so:
Do not enter any position without confirmation and trigger.
Do not enter a position without setting a stop.
Do not enter a position without capital management.
When we reach the first TP, save some profit and try to move the stop continuously in the direction of your profit.
If you have any comments please post them, comments will help us improve our performance
Thanks

Look Like Shib is ready to goLook Like Shib is ready to go because shib break his trend line and now look like shib prepare to boost now .
lets see if you see this post suites you then hit the follow and boost button
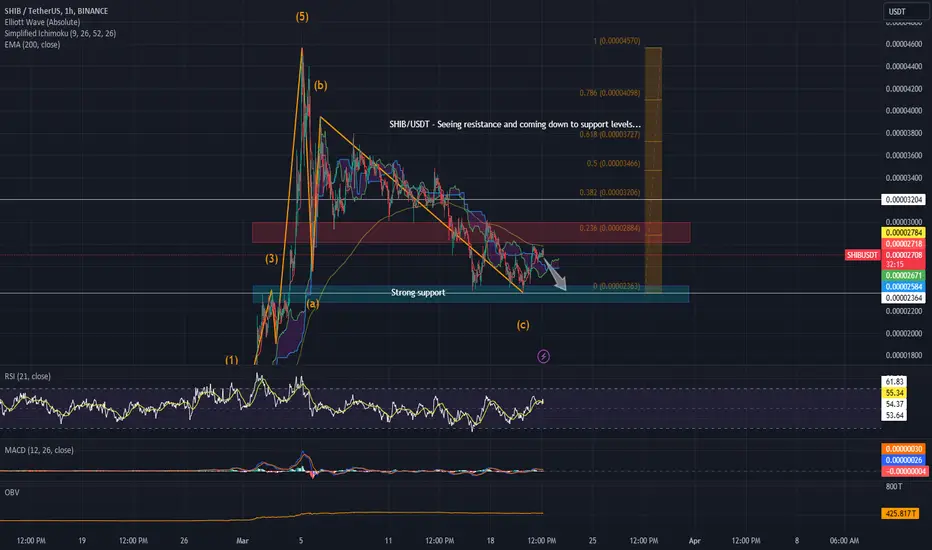
SHIB/USDTSHIB/USDT Looking Bearish? Coming back down to support?
Waiting to Confirm Entry Levels.
200 EMA
Elliot wave
Ichimoku Kinko Hyo
OBV
MACD
RSI
Many Time frames.
Happy Trading.
T.
Please Comment and follow
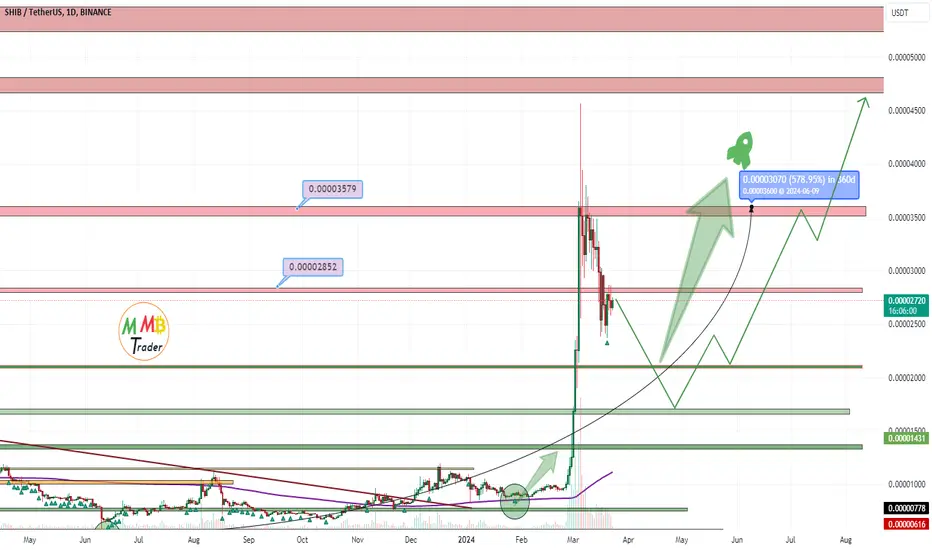
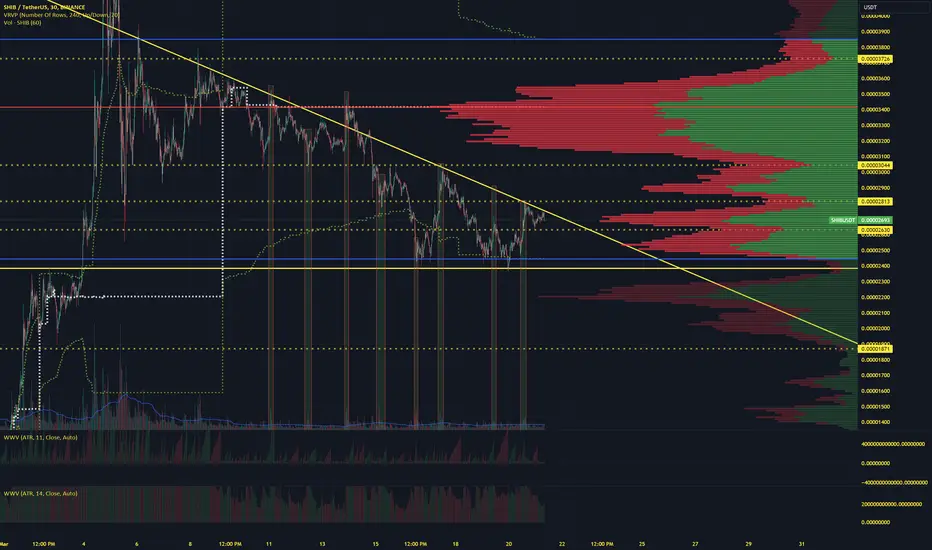
SHIB Accumulation UpdateThe volume surges observed significantly impact the asset's behavior, with each spike occurring at key support levels, often resulting in a bullish reversal hammer candlestick pattern on larger timeframes or contributing to upward momentum. Conversely, periods of bearish trends are characterized by lower volume, suggesting an accumulation phase. Breaking above the .00003044 mark could potentially position us in and above the all-time high (ATH) range, indicating that the current retracements are a healthy part of the asset's price action. With the halving event approaching, there is a strong belief in the asset's potential to achieve at least a 400% increase in the short term, in my opinion.
For continued upward movement, it's crucial for the price to align with my predefined horizontal levels, sustain volume, and avoid being rejected. This scenario would indicate that aggressive buyers are effectively absorbing the available limit orders and liquidity. With sufficient testing of these levels, we anticipate breaking into higher price ranges and beyond.
We should see is trade in a new higher range sometimes before the 27th, if not we can still accumulate at these levels a little longer.
Good Luck!
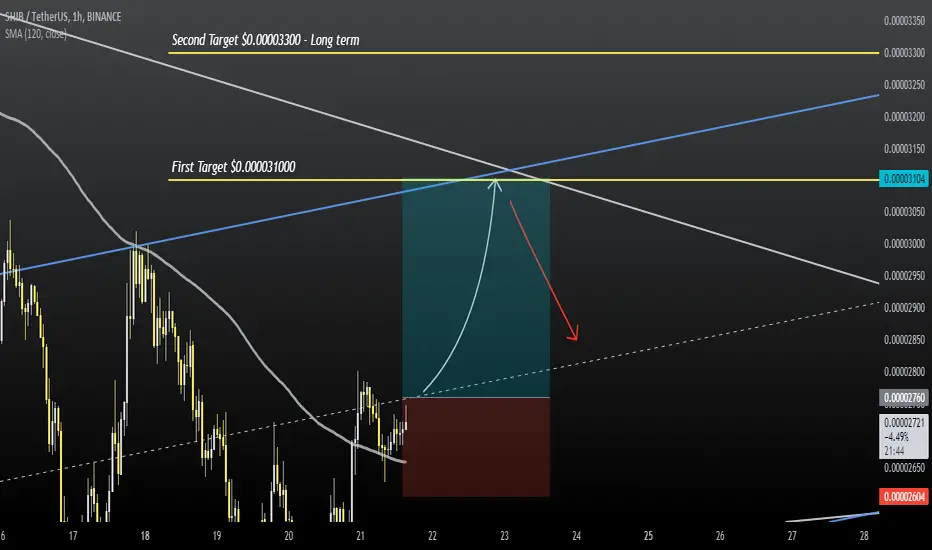
SHIBUSDT Idea - UPDATENo comment!
In continuation of the previous Shiba post, the good position for the Long Trade.
Shiba Inu (SHIBUSDT): Potential Bounce Back After Correction?Shiba Inu ( BINANCE:SHIBUSDT ) has reached a confluence of support levels after a recent price correction. This includes the support and resistance zone, daily and weekly pivot points, and potentially multiple micro, mini, and macro chart channels.
Positive Influences:
Support Levels: Reaching these support zones often indicates a buying opportunity for bulls.
Bitcoin's Rise: Historically, strong performance by Bitcoin can sometimes lead to positive movements in altcoins like SHIB.
Increased Trading Activity: Rising transaction volume in SHIB/USDT suggests growing interest from buyers.
What to Waiting For?
Channel Breakout: A decisive break above the upper channel line could signal a stronger upward trend.
Liquidity Rise: Increased trading volume (liquidity) often accompanies significant price movements.
Important:
This analysis is for informational purposes only and not financial advice.
Past performance is not necessarily indicative of future results.
Do your own research before making any investment decisions.
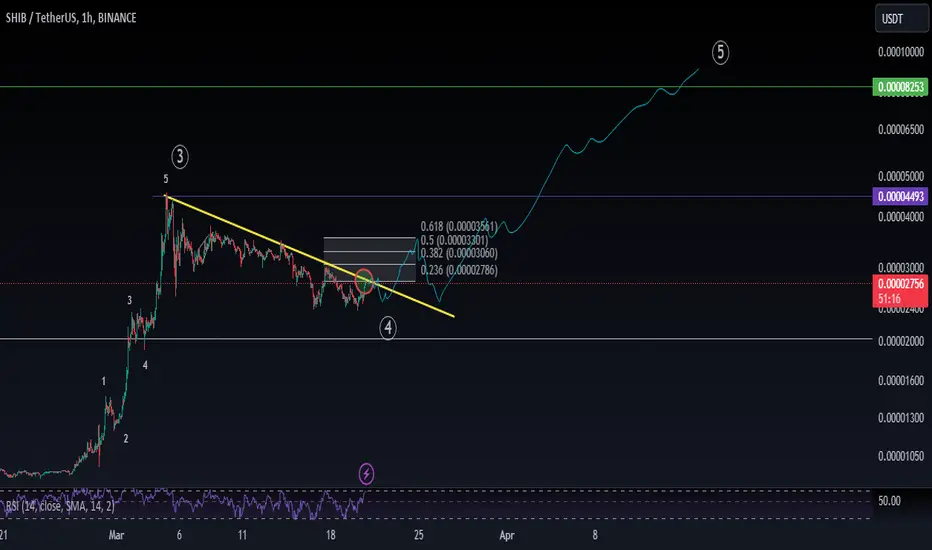
shibaSoon after finishing the correction of wave 4... wave 5 with target 8 is available .
If our analysis is useful for you, please click the boost button.
Thank you
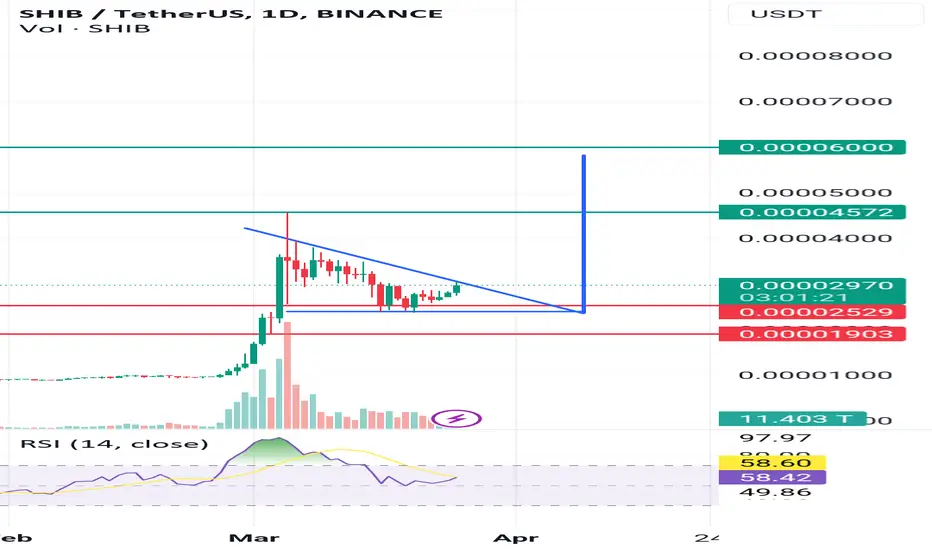
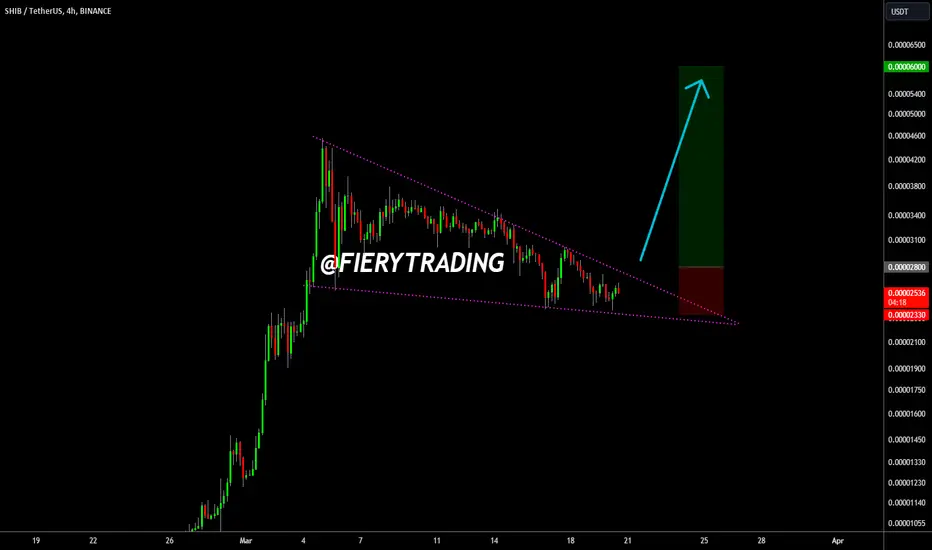
🔥 SHIBA Falling Wedge: Bull-Run Break Out!SHIB has seen an incredible run-up in February, but has been consilidating for a couple of weeks now. This signal assumes that SHIB will remain inside the falling wedge and will break out at some point.
Be patient for the break out through the top resistance of the wedge. Signal will be invalidated if the price falls through support.
Stop below the recent swing low, target at 6000 points.
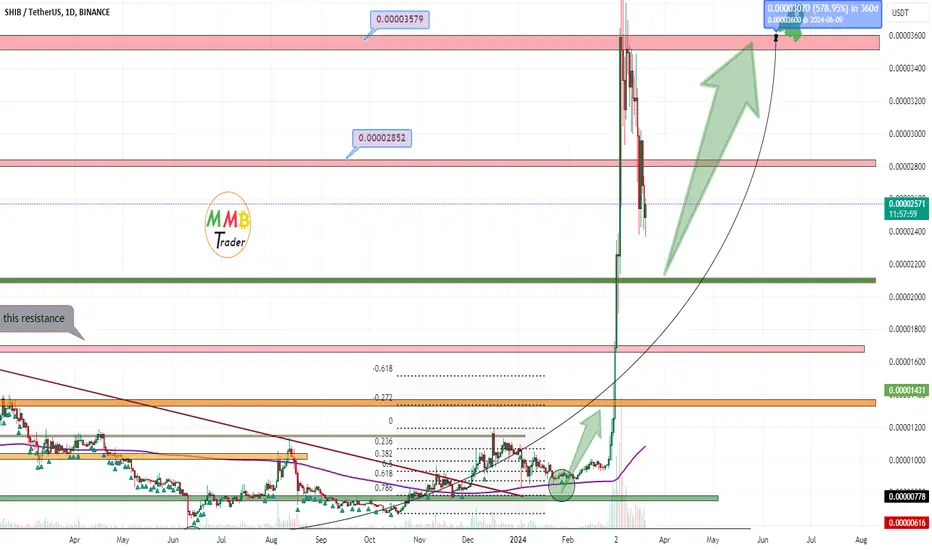
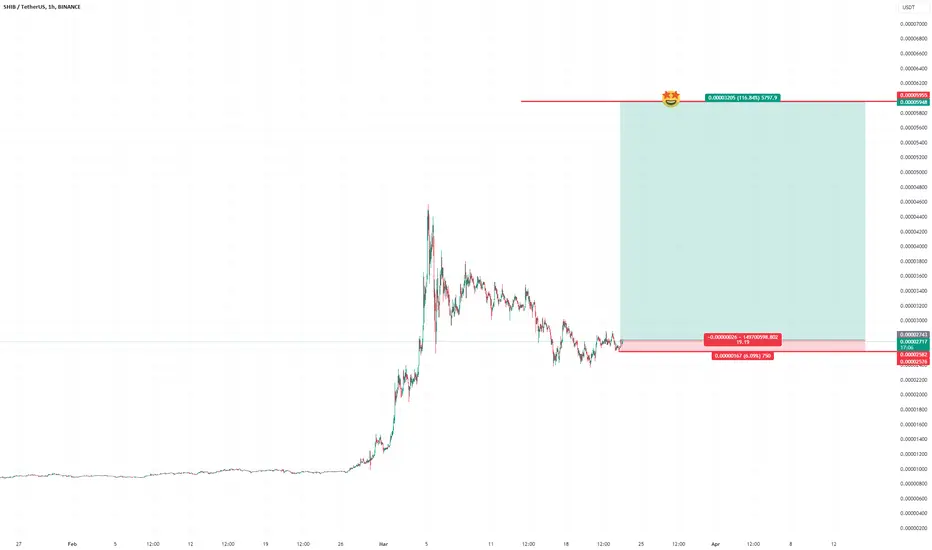
SHIBUSDT after range and short-term fall wait for more pumpAs we can see and we said a lot we were looking for a huge pump here and now all targets hit and we can expect more pump and rise here like the green arrows on chart.
our long with +500% profit:
DISCLAIMER: ((trade based on your own decision))
<