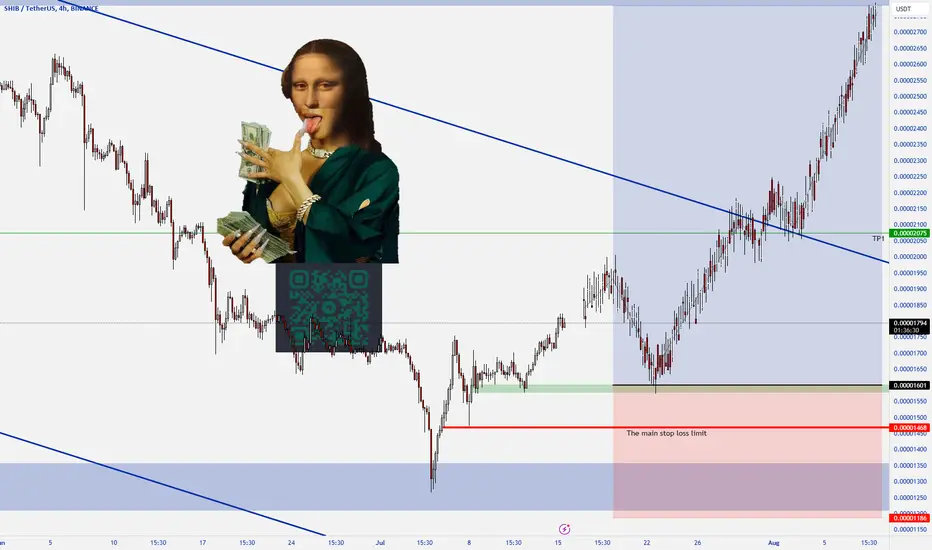
shib → the best price for getting a long hello guys...
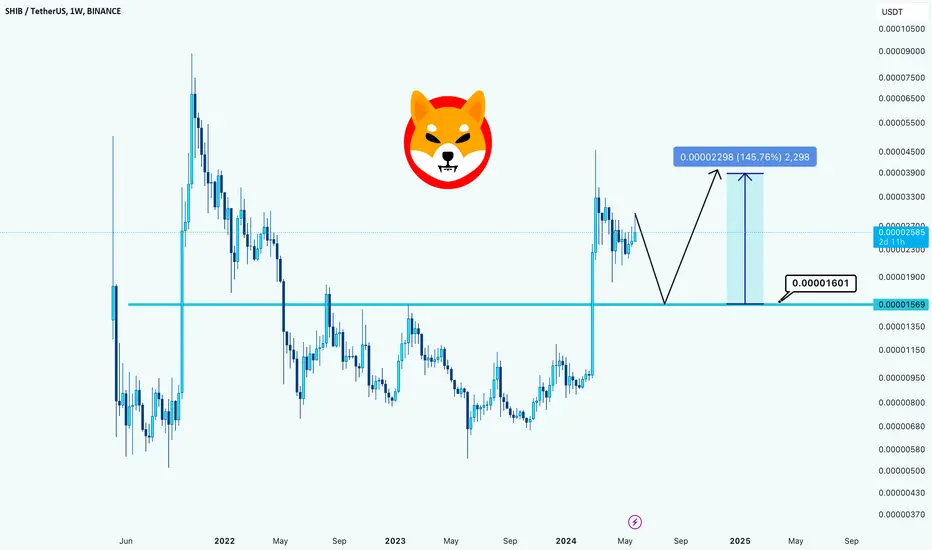
I believe the 0.000160 is the best area to get a long position!
the target will be $0.00038!
let's see!
___________________________
✓✓✓ always do your research.
❒❒❒ If you have any questions, you can write them in the comments below, and I will answer them.
❤︎ ❤︎ ❤︎And please don't forget to support this idea with your likes and comment
SHIBUSDT trade ideas
THE GOLDEN RETURN OF SHIBADepending on the low time frame the first activation for SHIB/USDT
We expect that there is a good chance of an increase in volume.
in the coming time, we will follow SHIBAUSDT
The top NO 1 USDT whale holds the most SHIBA.
90% of the unexpected volume is around 30%, there is a good chance it can do with time 60% and up.
Shiba is a value coin that is doing an unexpected increase over time.
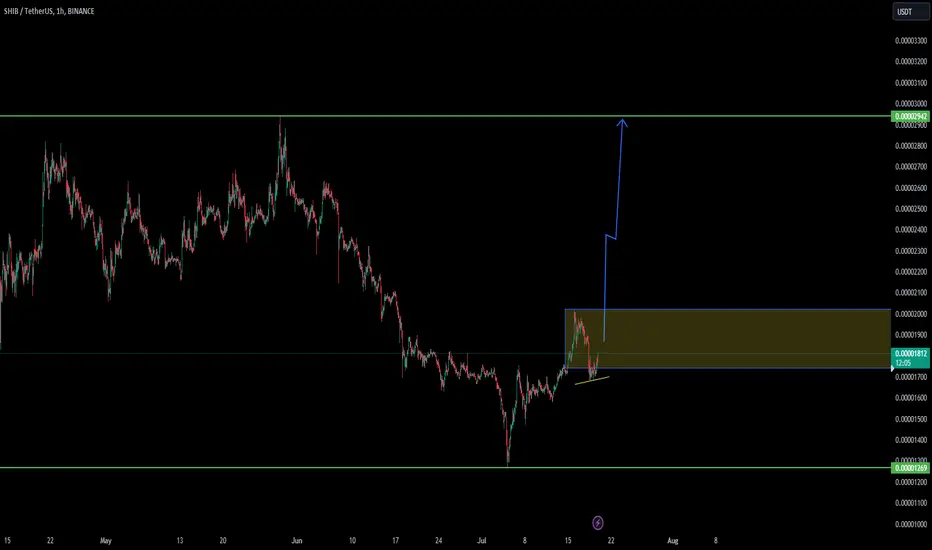
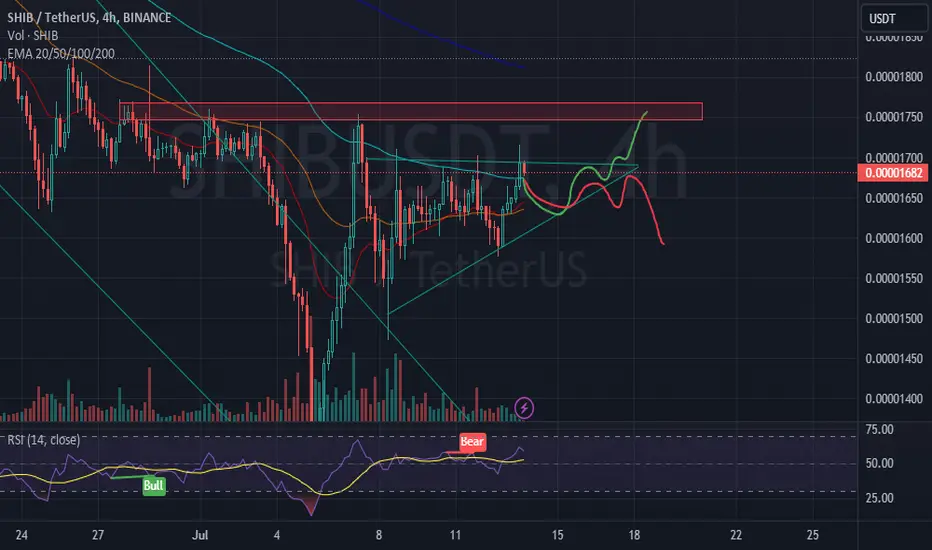
SHIB Breakout incoming?SHIB Breakout incoming to test liquidity levels from 21 if we see positive price action.
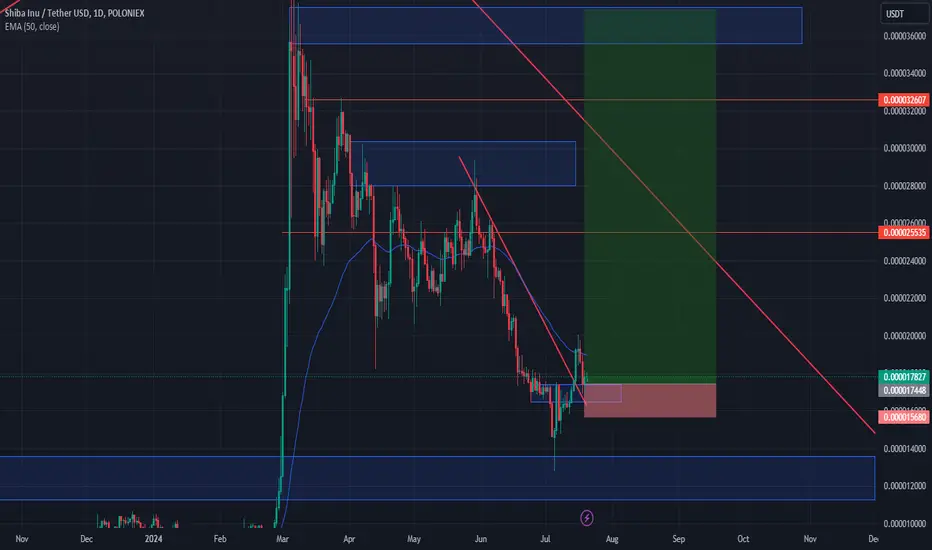
Buyers are in control.On the daily timeframe, the 50-day moving average has been broken and prices have stabilized above it. This indicates that buyers are poised to push prices to higher levels, as shown in the chart.
Personally, I will be accumulating purchases in these areas.
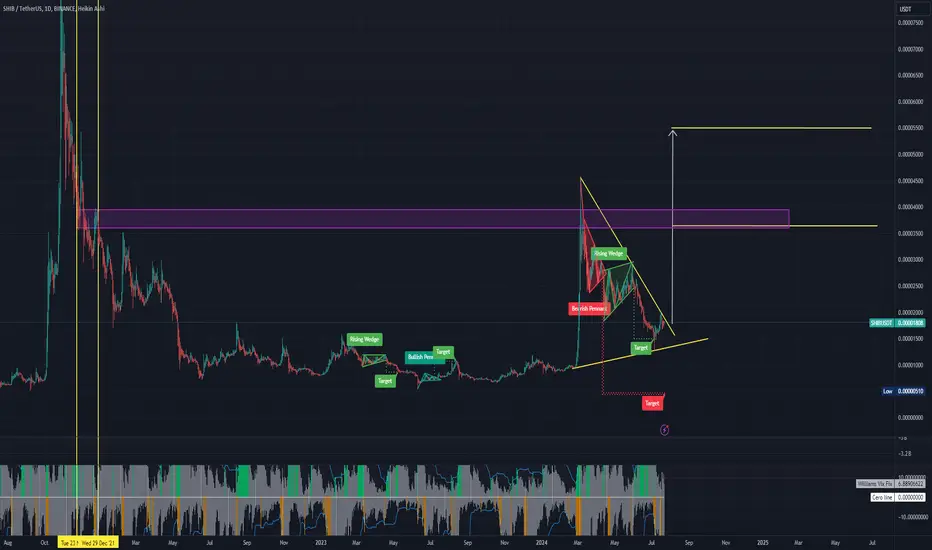
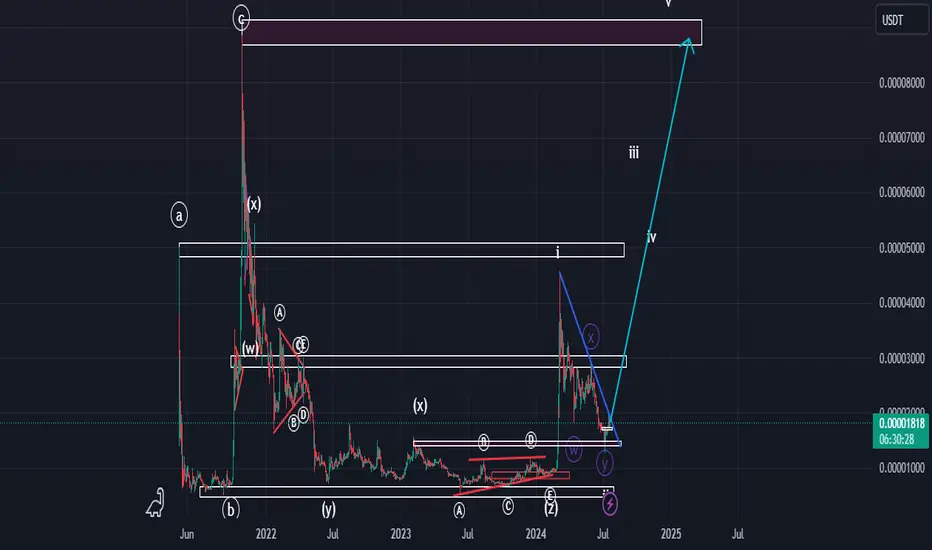
shibashiba technical analysis basically on elliott waves principles
shiba can be make new high as a wave 3
wait and watch
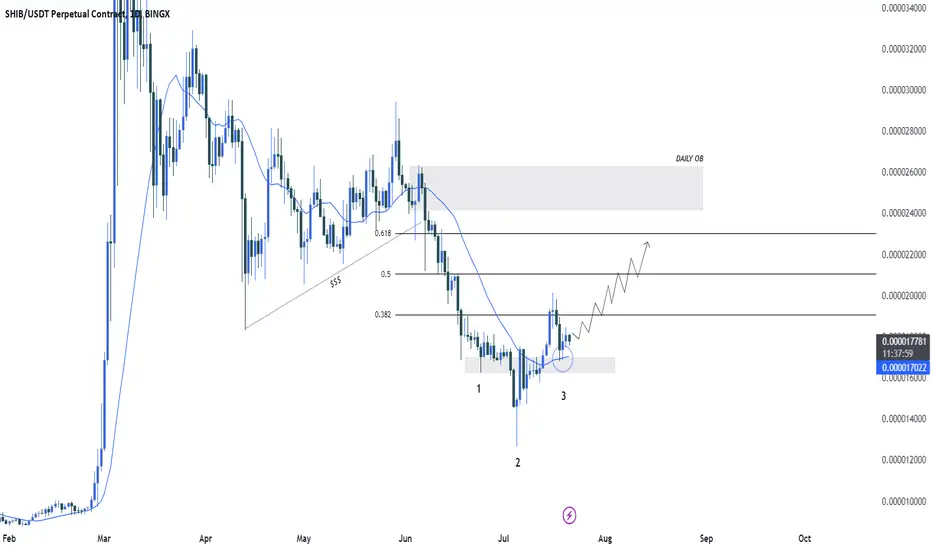
shibusdt very good opportunity pump incomingsaw shib is good prospect and for tho investment long term due alt season this year
SHIBUSDT BUY TRADE!Shiba Inu presents a good buying oppurtunity, after coming back, it is trying to form a swing high
Follow me for other trades....

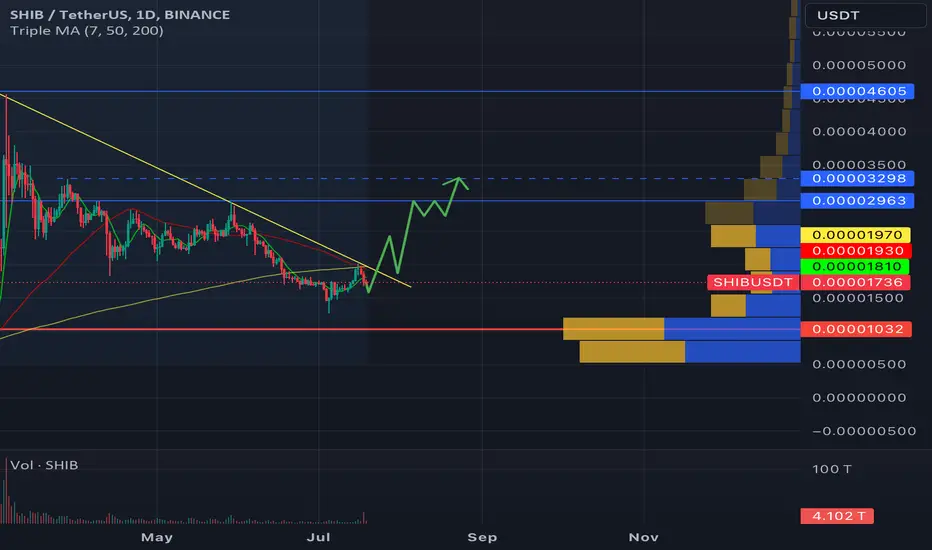
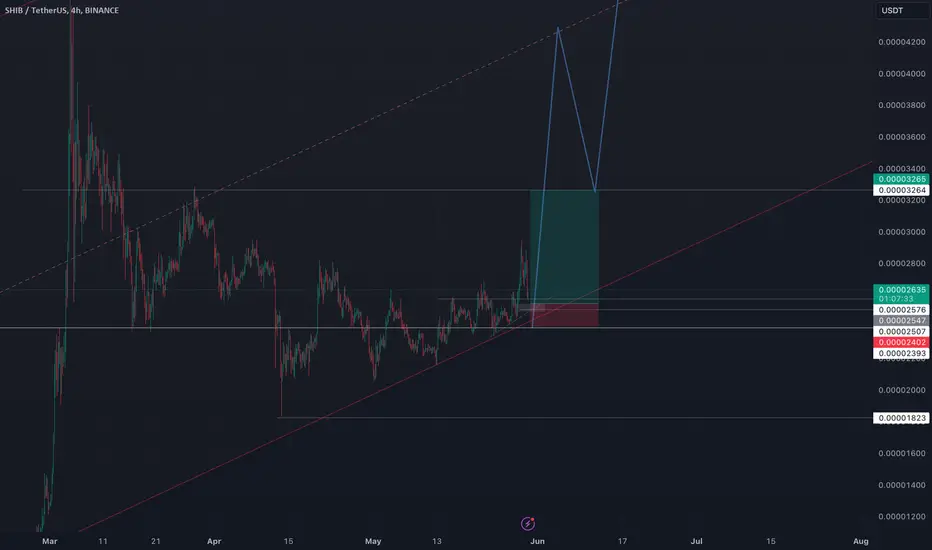
SHIB/USDT Trading ScenarioAmid the overall negativity in the cryptocurrency market, SHIB has significantly dropped in price, falling from a local high of $0.00004605 to $0.00001272. This decline amounts to more than 70%. The asset's price has nearly reached a range of global interest among participants, as confirmed by the volume profile. Currently, there is an attempt to recover the price and consolidate below the downward-sloping resistance level.
We can anticipate a breakout of the downward-sloping resistance level, followed by consolidation above it and further price growth. The resistance level may be at $0.00002963.
However, the possibility of continued price decline should not be ruled out, with a potential drop to the Point of Control (POC) at $0.00001032 and a subsequent bounce from that level.
Bearish Pattern Noticed in Shib Inu Coin We are assuming that we would take short trade on shiba Inu because as per dow theory is heading towards short momentum.

SHIB/USDTShifted my radar to SHIB and going long, chart looks great and with a nice break out on pattern.
trade with caution.

Shiba Inu (SHIB) price predictionShiba Inu (SHIB) managed to climb past a short-term range and has gained 15% since the low it posted on Friday the 12th of July.
In doing so, it has outperformed Pepe (PEPE) in the short-term, and its on-chain metricssignaled that more gains were likely.
The week’s trend sometimes gets established on Mondays. What is the SHIB price prediction, and should traders anticipate a strong bullish run soon?
The recent report highlighted the short-term bullish metrics of SHIB and how they generated a buy signal. On the 12-hour chart, a session close above the range highs at $0.000017 has occurred.
The Awesome Oscillator also noted a bullish crossover and was rising higher to reflect the growing upward momentum. The CMF has been above +0.04 over the past week, a sign that buying pressure was consistent.
This concerted effort has begun to pay dividends. To the north, the $0.00002-$0.000021 supply zone was the immediate bullish target.
The higher timeframe charts such as daily and weekly showed that the memecoin has not bucked the gradual downtrend it has been on since April.
The liquidations chart showed short positions liquidated in the late hours of Sunday, which should fuel further price hikes.
Overall, the wider market disbelief might be turned into FOMO if Shiba Inu continues to climb.

SHIBA/USDTTechnical Analysis: SHIBA/USDT
{{ Shiba is just a memecoin, so don't gamble with your capital }}
A long term deal
Attention!!!
The digital currency market has a smaller volume than forex
So consider crypto only as holding and not trading.
Before using this signal and analysis, be sure to check your analysis chart.
Attention!!!
In these analyses, only technical analysis is considered
So be sure to check the initial news before entering.
Attention!!!
100% does not exist in financial markets
So don't enter this signal hoping for a definite profit
SHIBA INU HOT UPDATEI'm short now on shiba, MY target is on first zone, cause this gathering of support needs alot of attention, be carefull, this area is very important, the price may reject, or skip this area with high momentum, to skip every one of them, we should get some confirmation to reach SSL to have touch the liquidity zone.

SHIBA/USDTTechnical Analysis: SHIBA/USDT
A short term transaction
Attention!!!
The digital currency market has a smaller volume than forex
So consider crypto only as holding and not trading.
Before using this signal and analysis, be sure to check your analysis chart.
Attention!!!
In these analyses, only technical analysis is considered
So be sure to check the basic news before entering.
Attention!!!
100% does not exist in financial markets
So don't enter this signal hoping for a definite profit

SHIB Possible ActionsPatience is your asset here, nothing crazy happening but SHIB need to cross 2 resistance to go bullish otherwise lower lows will manifest
You might need THIS!SHIB might is in the bul at the moment and might be at the long run. as there are lot of Buy side liquidity however there is only 1 Sell Side Liquidity to be taken then we shoot up.
Expecting a sharp run of liquidity down then we move to the the Buy side liquidity.
Time will tell.
DYOR pls
Shytoshi Kusama Shares Crucial Update on Long-Term Shiba Inu PlaU.Today has prepared the top three news stories over the past day.
Shiba Inu lead shares crucial update on SHIB's long-term plans
In a recent X post, Shytoshi Kusama, pseudonymous lead of the Shiba Inu project, revealed long-term plans for the dog-themed meme token and its ecosystem. Kusama hinted at the core use case for TREAT, the upcoming unreleased token. According to the lead, by using TREAT, Shiba Inu members will be able to access all the ecosystem's advanced features. Additionally, Kusama wrote that the SHIB team is currently finalizing partnerships to "grant full power" to the system they have created. The lead also reminded SHIB enthusiasts that he would eventually have to step away from the project's limelight, as Shiba Inu is approaching the completion of Ryoshi's plan for a decentralized system with no leader. Last but not least in Kusama's X post was the announcement of SHIBACON 2024, the project's own conference that will take place in Bangkok, Thailand, around the same time as DevCon.

SHIBA INU | Short term outlookAfter liquidation, shiba is now on correction trend same as major crypto drivers.

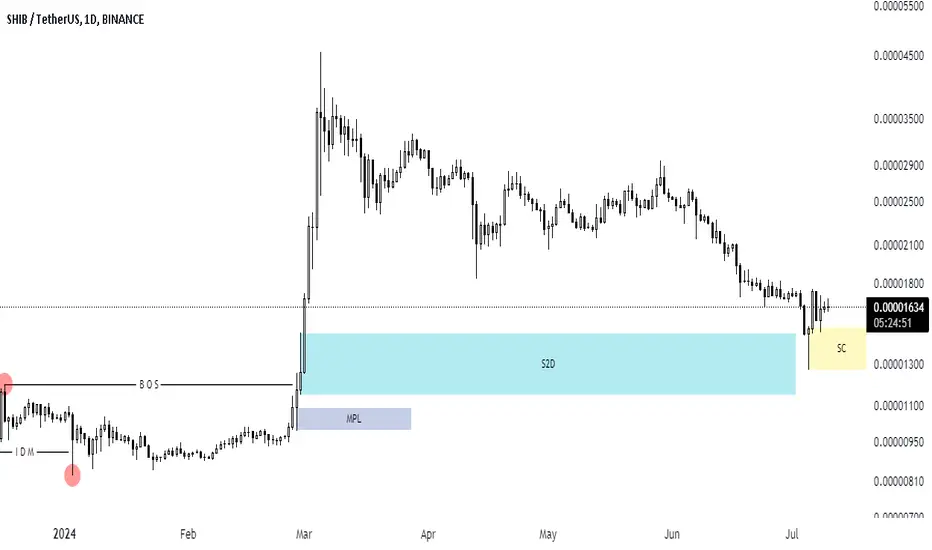
SHIB is ready for PUMP!#SHIB in dayli timeframe is in a bullish structure and recently touched its S2D flip zone and made a SCOB confirmation.
So it can go up from here , specially because of its upside momentum and last downside momentum .
Its not a financial advice ,DYOR.
SHIB looks bearishFrom where we placed the red arrow on the chart, SHIB has entered correction.
Considering the time of the waves and the price range, the correction seems to be a diametric.
The price is expected to reject downwards from the red range.
The targets are clear on the chart.
Closing a daily candle above the invalidation level will violate the analysis
For risk management, please don't forget stop loss and capital management
When we reach the first target, save some profit and then change the stop to entry
Comment if you have any questions
Thank You

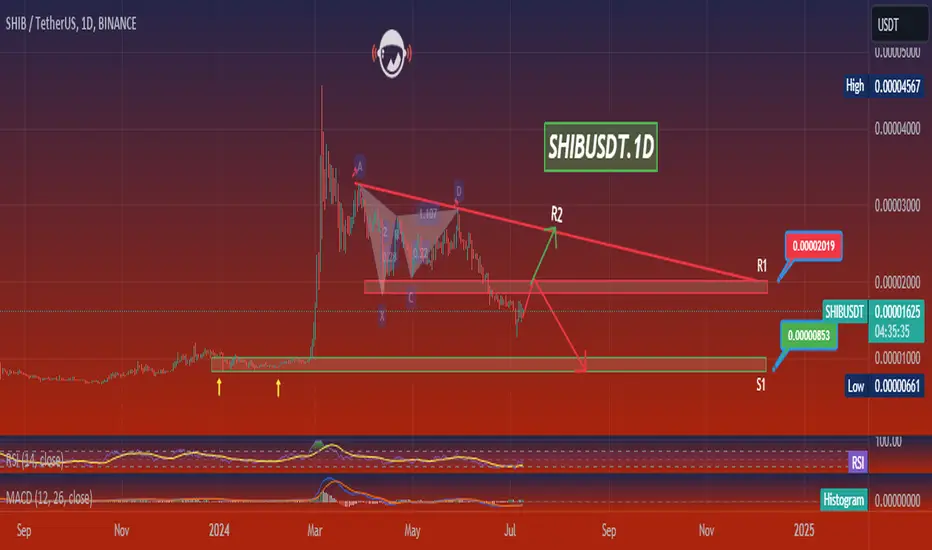
SHIBUSDT.1DIn my technical analysis of the SHIB/USDT daily chart on Binance, I focus on the trend behaviors and key indicators that could provide insights into future price actions.
The chart reveals a volatile journey for SHIB/USDT, particularly noticeable in the sharp spike and subsequent fall during early 2024, characterized by point A on the chart. This volatility has since tapered into a descending triangle pattern, indicating a potential continuation or reversal could be forthcoming.
Firstly, let's consider the support (S1) and resistance levels (R1, R2). Currently, the price has stabilized near a critical support level (S1) at approximately $0.00000853. This level is crucial as it has historically acted as both support and resistance, suggesting a strong psychological price point for traders.
Resistance levels are identified at $0.00002019 for R1 and higher at $0.00004567 for R2. Overcoming these levels would require significant bullish momentum, likely driven by broader market trends or specific catalysts affecting SHIB.
The Relative Strength Index (RSI) is near the 50 mark, indicating neither overbought nor oversold conditions. This neutrality suggests a potential for either movement direction, depending heavily on market sentiment and upcoming news or events that could sway investor behavior.
The MACD, while currently below the signal line, shows signs of converging. A crossover above the signal line could be a bullish indicator, suggesting an increase in upward momentum. However, the histogram reflects minimal momentum in either direction, reinforcing the current market uncertainty.
Given this analysis, the immediate strategy would be to watch for a decisive break either above R1 or below S1. A break above R1 could suggest a potential trend reversal, targeting further resistance at R2. Conversely, a fall below S1 could confirm the continuation of the bearish trend, potentially leading to new lows.
In conclusion, my focus will remain on these critical thresholds (S1 and R1), monitoring for significant price movements that could indicate a larger trend change. The balance between observing technical signals and staying informed on market-wide influences will be essential in navigating SHIB/USDT’s future movements effectively.
shibashiba inu technical analysis basically on elliott waves principles
shiba can be make a new high
wait and watch

Shib - Monthly RecoveryShib is another meme coin that has showed recent strength.
On the monthly timeframe it has perfectly retested the 21MA as new support and should be ready for continued upside.
