SHIB/USDT: Shiba Inu Setting Up for a Bullish Reversal?Shiba Inu (SHIB) is currently trading around $0.00001208, showing signs of stabilizing near a key support zone after a recent pullback. The market appears to be forming a rounded double bottom pattern, which could evolve into a strong W-shaped bullish reversal if confirmed with volume and breakout a
Related pairs
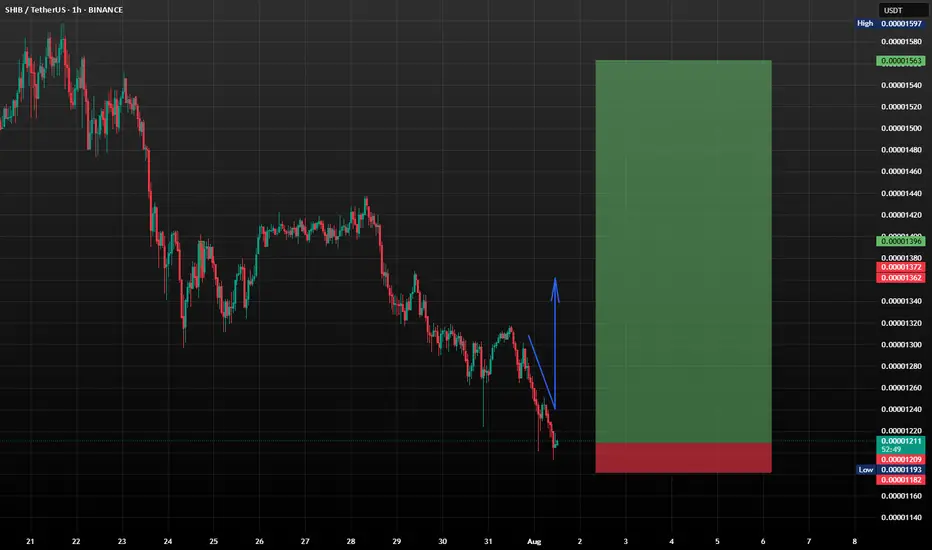
Shiba Inu (SHIB): Might Bounce From Here | Looking For PumpShiba is showing some signs of recovery, where we are seeing the buyers taking back the control near the local support zone, which would then lead to a 10% movement to upper zones (if not more).
So we look for more clarity and dominance from buyers here and once we see it, we are going to go long.
DeGRAM | SHIBUSD fell below the support line📊 Technical Analysis
● A classic Head and Shoulders pattern has formed below resistance at 0.00001411, confirming a bearish reversal with neckline break.
● Price is descending inside a bearish flag and is testing prior support at 0.00001270, with the next major level near 0.00001088.
💡 Fundament

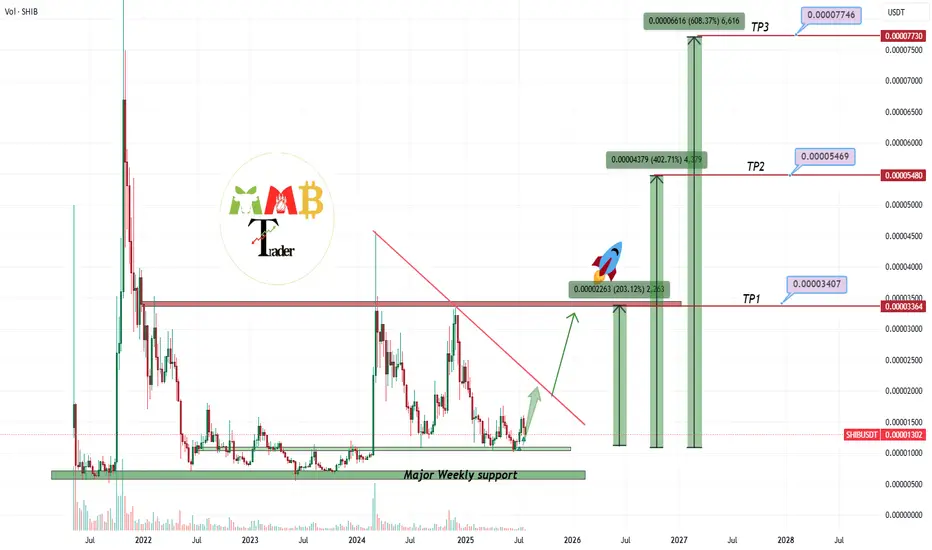
SHIBUSDT major weekly support of 0.000010$ is strong!!Two weekly supports which are 0.000010$ & 0.000007$ are strong enough to hold price like past years and i think soon those weekly +100% candles will surprise us here on BINANCE:SHIBUSDT too.
all major supports and resistances are all also mentioned on the chart too.
DISCLAIMER: ((trade based on
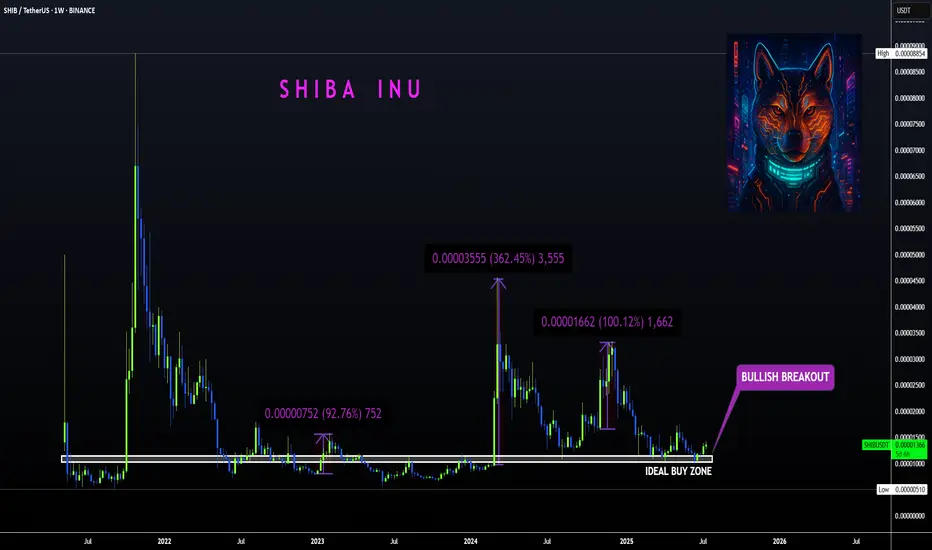
SHIBA | Bullish Breakout ABOVE Ideal Buy ZoneBINANCE:SHIBUSDT
Shiba is know to make big increases in short periods of time... that's why we love it!
The tricky thing about SHIBA is that the pumps can be unpredictable so the best way to ensure a position is to buy as low as possible to the ideal buy zone.
In the weekly timeframe, the tec
SHIB Bullish DivergenceBINANCE:SHIBUSDT
Trade Setup:
Target 1: 0.00001335 (0.786 Fibonnaci Golden Zone).
Target 2: 0.00001391 (0.618 Fibonnaci Golden Zone).
Target 3: 0.00001430 (0.5 Fibonnaci Golden Zone).
Target 4: 0.00001597 (0 Fibonnaci).
Stop Loss: 0.00001172 (1.272 Fibonnaci).
RSI Analysis: The RSI is showing a

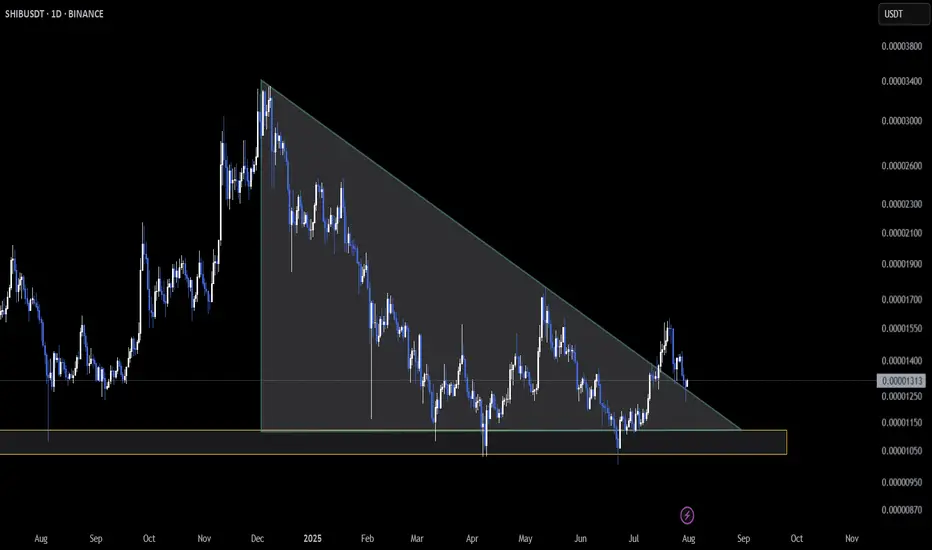
SHIB Retests Triangle Support as Pressure Mounts🔥 CRYPTOCAP:SHIB is locked into a key zone on the daily chart — price is retesting the base of a descending triangle structure 🛡️
So far, support is holding, but the range is tightening. A strong bounce here could kick off a recovery move 📈
⚠️ On the flip side, a breakdown would confirm bearish c
SHIB Still Faces Pressure Below Parabolic SAR ResistanceSHIB continues to struggle beneath its Parabolic SAR, which has established dynamic resistance above its current price at $0.00001382. This persistent downward positioning below the SAR dots suggests that sellers remain in control, limiting bullish momentum and keeping the asset under pressure in th

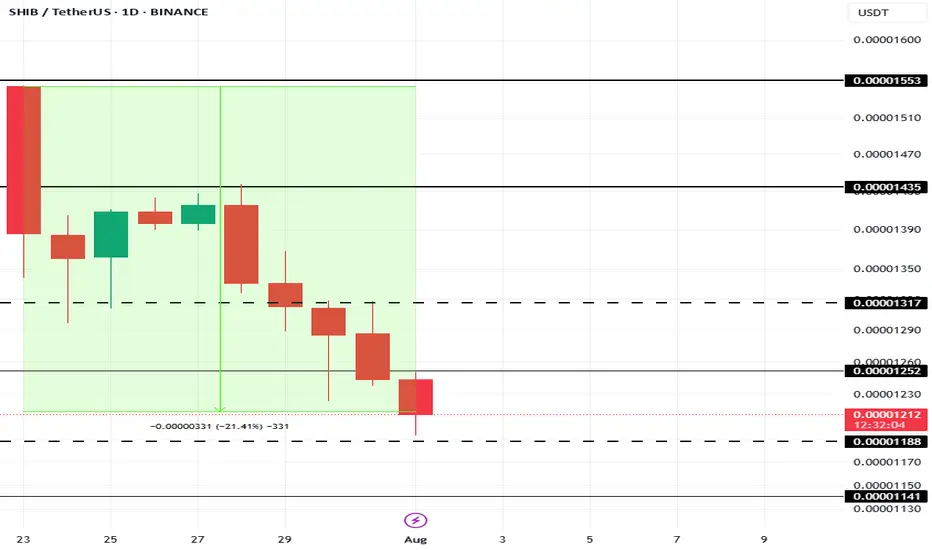
This Is The Cause Of Shiba Inu Price’s 21% Fall In 10 DaysAt present, BINANCE:SHIBUSDT price is sitting at $0.00001210, down 21% over the last 10 days . The drop in Shiba Inu's price can be traced to a sharp decline in the number of new addresses interacting with the token.
In the last 10 days, the number of new addresses has decreased by nearly 40%
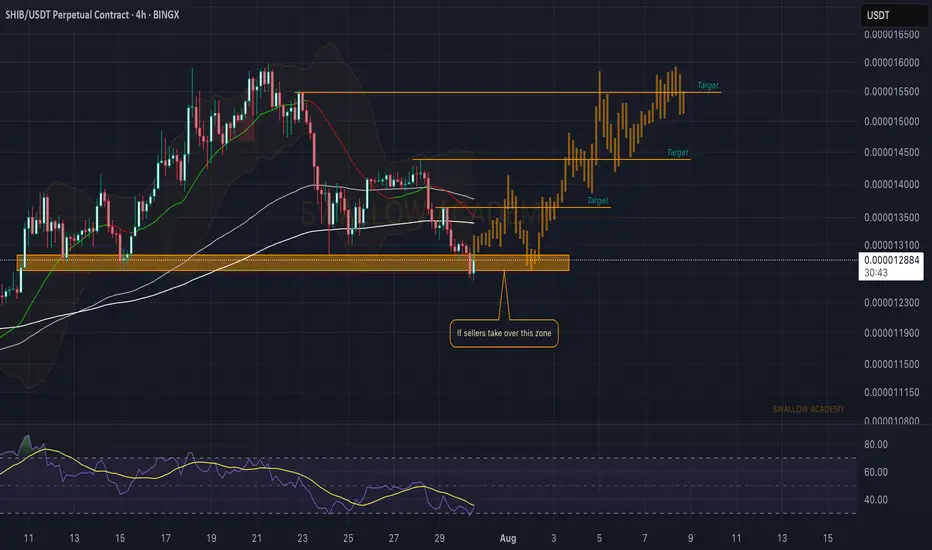
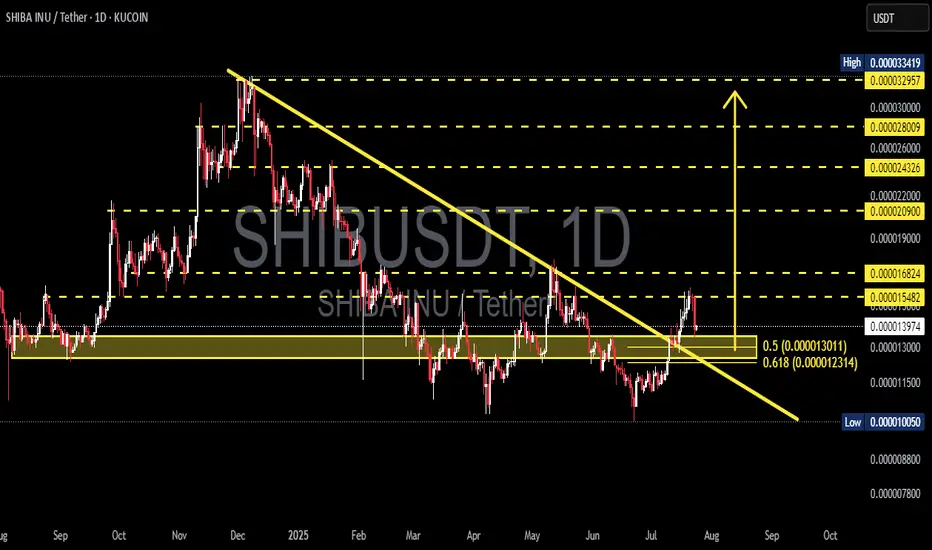
SHIBUSDT | Explosive Breakout from Long-Term Downtrend!📊 Overview:
After months of being trapped in a major downtrend, SHIBA INU (SHIBUSDT) has finally broken out of a multi-month descending trendline that has been capping price action since late 2024. But this isn’t just a minor breakout — this could mark a macro trend reversal, with bullish momentum
See all ideas
Summarizing what the indicators are suggesting.
Oscillators
Neutral
SellBuy
Strong sellStrong buy
Strong sellSellNeutralBuyStrong buy
Oscillators
Neutral
SellBuy
Strong sellStrong buy
Strong sellSellNeutralBuyStrong buy
Summary
Neutral
SellBuy
Strong sellStrong buy
Strong sellSellNeutralBuyStrong buy
Summary
Neutral
SellBuy
Strong sellStrong buy
Strong sellSellNeutralBuyStrong buy
Summary
Neutral
SellBuy
Strong sellStrong buy
Strong sellSellNeutralBuyStrong buy
Moving Averages
Neutral
SellBuy
Strong sellStrong buy
Strong sellSellNeutralBuyStrong buy
Moving Averages
Neutral
SellBuy
Strong sellStrong buy
Strong sellSellNeutralBuyStrong buy
Displays a symbol's price movements over previous years to identify recurring trends.
Frequently Asked Questions
The current price of SHIB / UST (SHIB) is 0.00001204 USDT — it has fallen −4.49% in the past 24 hours. Try placing this info into the context by checking out what coins are also gaining and losing at the moment and seeing SHIB price chart.
SHIB / UST price has fallen by −10.99% over the last week, its month performance shows a 4.29% increase, and as for the last year, SHIB / UST has decreased by −9.75%. See more dynamics on SHIB price chart.
Keep track of coins' changes with our Crypto Coins Heatmap.
Keep track of coins' changes with our Crypto Coins Heatmap.
SHIB / UST (SHIB) reached its highest price on Oct 28, 2021 — it amounted to 0.00008246 USDT. Find more insights on the SHIB price chart.
See the list of crypto gainers and choose what best fits your strategy.
See the list of crypto gainers and choose what best fits your strategy.
SHIB / UST (SHIB) reached the lowest price of 0.00000546 USDT on Jun 10, 2023. View more SHIB / UST dynamics on the price chart.
See the list of crypto losers to find unexpected opportunities.
See the list of crypto losers to find unexpected opportunities.
The safest choice when buying SHIB is to go to a well-known crypto exchange. Some of the popular names are Binance, Coinbase, Kraken. But you'll have to find a reliable broker and create an account first. You can trade SHIB right from TradingView charts — just choose a broker and connect to your account.
Crypto markets are famous for their volatility, so one should study all the available stats before adding crypto assets to their portfolio. Very often it's technical analysis that comes in handy. We prepared technical ratings for SHIB / UST (SHIB): today its technical analysis shows the sell signal, and according to the 1 week rating SHIB shows the sell signal. And you'd better dig deeper and study 1 month rating too — it's sell. Find inspiration in SHIB / UST trading ideas and keep track of what's moving crypto markets with our crypto news feed.
SHIB / UST (SHIB) is just as reliable as any other crypto asset — this corner of the world market is highly volatile. Today, for instance, SHIB / UST is estimated as 4.49% volatile. The only thing it means is that you must prepare and examine all available information before making a decision. And if you're not sure about SHIB / UST, you can find more inspiration in our curated watchlists.
You can discuss SHIB / UST (SHIB) with other users in our public chats, Minds or in the comments to Ideas.