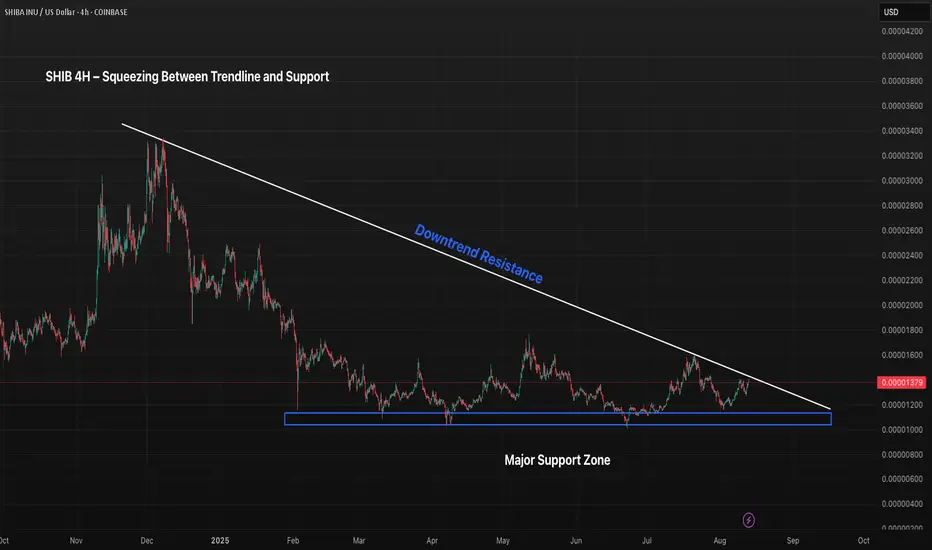
SHIB 4H – Approaching Apex Between Resistance and SupportSHIB is trading in a tightening range between its long-term descending trendline and the $0.0000100–$0.0000108 support zone. Price is nearing the apex, which could trigger a decisive move in the coming days. Momentum is neutral on the Stoch RSI, leaving both breakout and breakdown scenarios in play.
Key stats
Trading activity
Transactions 201
BuysSells
10497
Volume 77.84 KUSD
Buys volumeSells volume
31.27 K46.58 K
Traders 178
BuyersSellers
8692
About SHIBWETH_811BEE.USD
Related DEX pairs
SHIB 8H – Double Bottom at Support, Breakout Structure Loading?HIB has just completed a clean double bottom off a major demand zone on the 8H timeframe, following a textbook impulse → correction → potential reversal sequence. Price structure shows clear symmetry, and the recent bounce aligns with a Stoch RSI reversal from oversold — building a strong case for b

Trendline**SHIBA INU Price Action: Analyzing Support, Resistance, Trendlines & Moving Averages**
The chart for SHIBA INU/US Dollar reveals a fascinating technical landscape, packed with actionable insights for both short-term traders and longer-term followers of the meme token. Let’s break down the key take

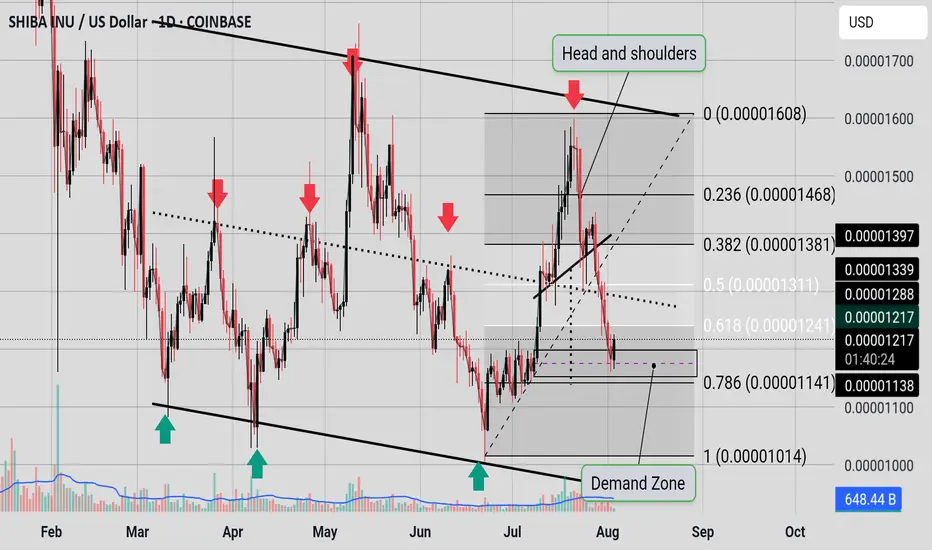
Demand ZoneSHIB needs to break out of the downward parallel channel but right now it is below the midpoint of the channel and could be heading to the support of the channel; however the good news it has paused at a Demand Zone. The Bulls need SHIB to clear 0.00001241 and then 0.00001311(which is the midpoint o
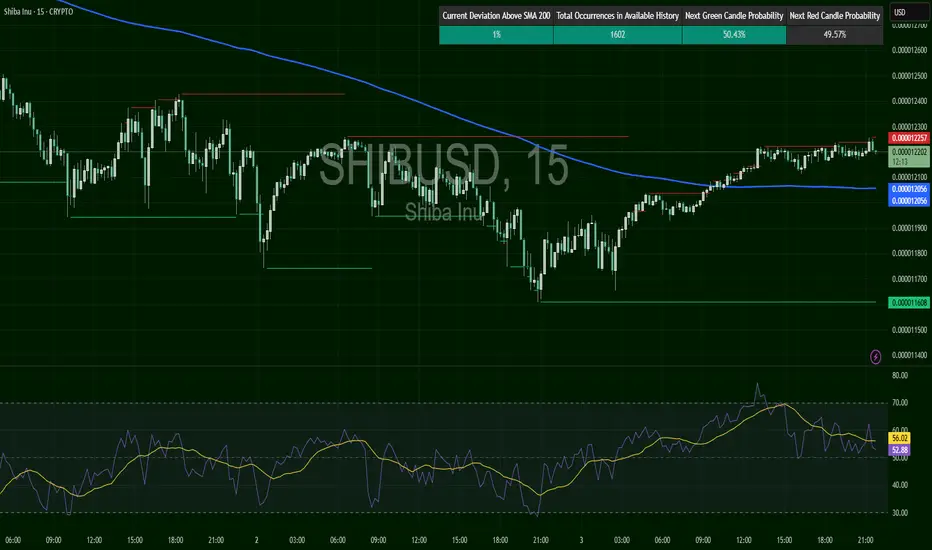
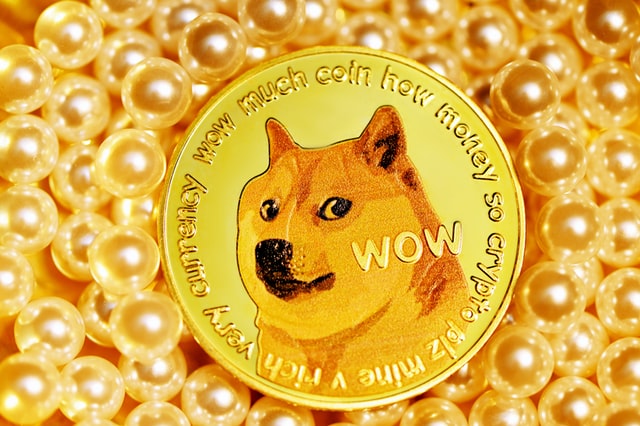
SHIBUSD – Sneaky ReclaimerSHIB is mirroring DOGE, now breaking slightly above the 200 SMA at $0.000012056. RSI is above 56 and climbing — strength is building, though not explosive. Key test ahead at prior resistance levels.
The cloud with the help of the Tenkan we will rise!!Shit is about to get real.
I was telling folk to look at BTC @ $19....
This could be the time.
NOT FINANCIAL ADVICE

SHIB 8H – Retesting the Golden Pocket with a Familiar SetupSHIB just tapped the 0.618 Fibonacci retracement after a strong breakout leg — and the structure looks strikingly familiar.
We’ve seen this exact move before:
A rally → pullback to golden pocket → explosive extension
Now we’ve got:
✅ Price testing the same Fib zone
✅ Stoch RSI reset and curling u

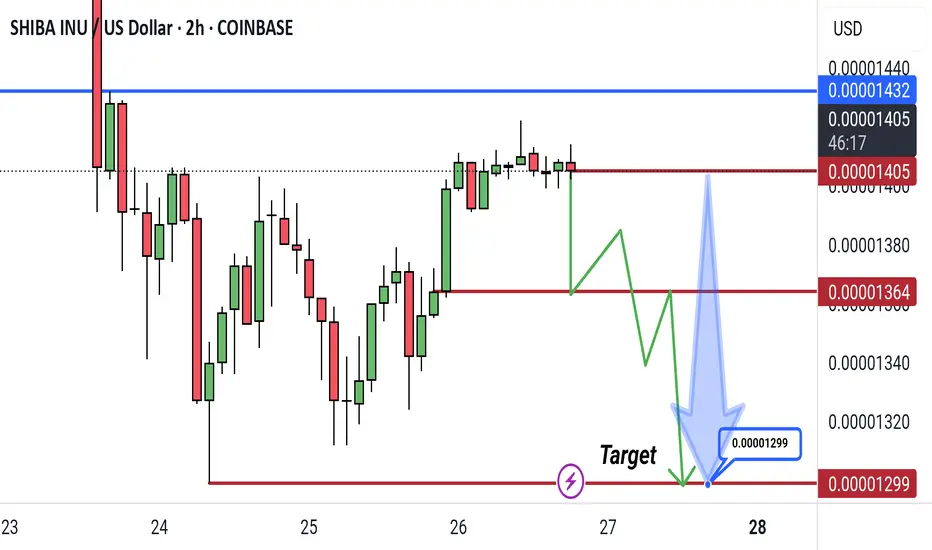
SHIBA INU Bearish Reversal Setup – Targeting 0.00001299SHIBA INU 2H Chart Analysis:
Price is consolidating near resistance at 0.00001402. A potential bearish scenario is outlined, suggesting a drop after a minor bounce, targeting 0.00001299 support. Key resistance levels are 0.00001405 and 0.00001432.
SHIB/USDT: A Fight for Recovery?SHIB/USDT is currently trading around $0.00001363, marking an approximately 11.5% drop over the past 24 hours. However, it's crucial to note that the price is successfully holding above the key support level of $0.00001373.
Recently, we've witnessed a significant increase in the activity of so-call

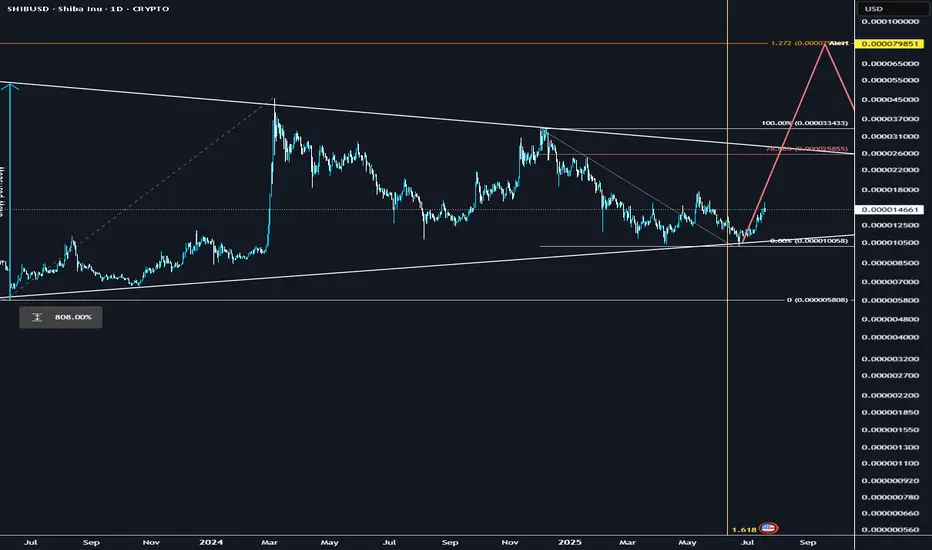
SHIB could explode soon.Multi year accumulation, crossing a significant fib-time pivot, similar set up to XRP.. could follow DOGE once it takes the lead as a catch up trade and rip..
Technical breakout: Above 200-day MA + golden cross formation
Volume surge: Social + trading volume spiking, driving demand
Ecosystem cata
See all ideas
Summarizing what the indicators are suggesting.
Oscillators
Neutral
SellBuy
Strong sellStrong buy
Strong sellSellNeutralBuyStrong buy
Oscillators
Neutral
SellBuy
Strong sellStrong buy
Strong sellSellNeutralBuyStrong buy
Summary
Neutral
SellBuy
Strong sellStrong buy
Strong sellSellNeutralBuyStrong buy
Summary
Neutral
SellBuy
Strong sellStrong buy
Strong sellSellNeutralBuyStrong buy
Summary
Neutral
SellBuy
Strong sellStrong buy
Strong sellSellNeutralBuyStrong buy
Moving Averages
Neutral
SellBuy
Strong sellStrong buy
Strong sellSellNeutralBuyStrong buy
Moving Averages
Neutral
SellBuy
Strong sellStrong buy
Strong sellSellNeutralBuyStrong buy
Curated watchlists where SHIBWETH_811BEE.USD is featured.
Crypto tokens: Chips and dips
24 No. of Symbols
ETH-based crypto: Find your utility
38 No. of Symbols
Memecoins: Top meme tokens
10 No. of Symbols
See all sparks