Consolidation SHIB is consolidating in a triangle, still in an upward trend. CCI levels are positive. RSI levels are positive, MACD could be possibly have a bullish cross over in the future. But be very careful and watch out for breakouts and possible retest, and it is a descending triangle.
SHIBWETH_811BEE.USD trade ideas

PatternsThank you for your time.
Chart patterns are very subjective, but do you see a bull flag pattern and a inverted head and shoulder pattern inside of it forming? We need a confirmed break out from the parallel structure and the resistance line combine with good RSI readings and SRSI readings to confirmed theory. Candle is still printing

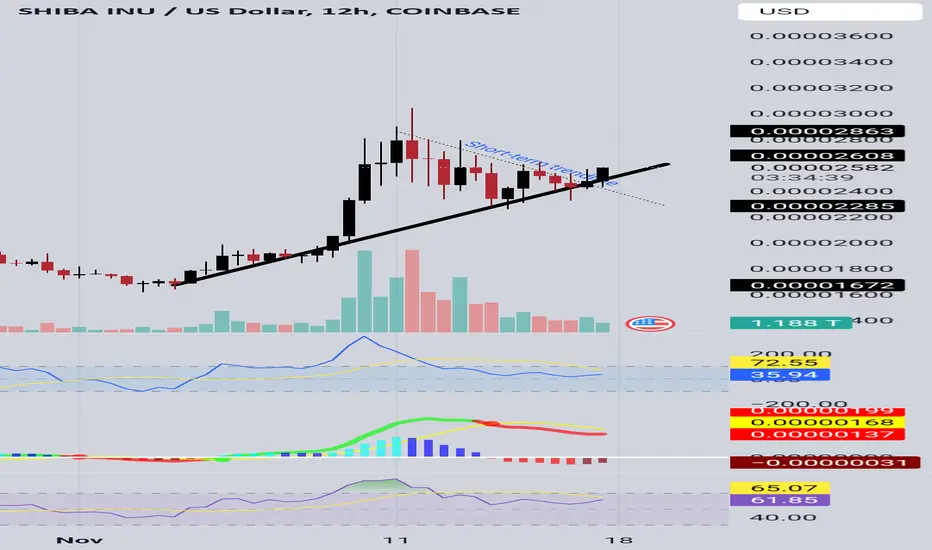
Short term trend line 12 TFGreetings. Thank you for your time.
SHIB is currently on a trendline, and it has positive CCI levels and the MACD is alluding to bullish crossover, RSI levels are healthy. Let us wait for the candle to print and hope for a positive breakout on the short term trend-line.
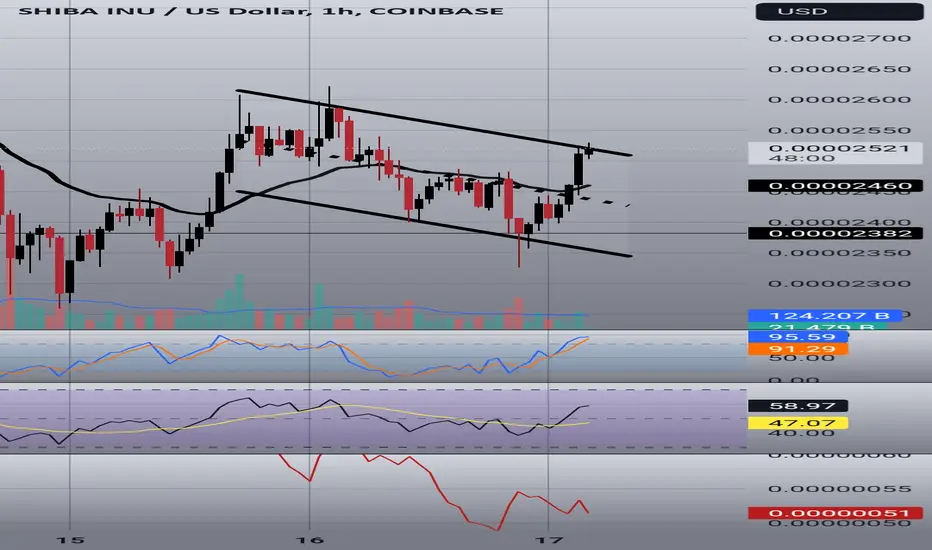
Breakout needed SHIB needs to break out this parallel channel. At this time it is making lower lows and lower highs. RSI is within acceptable ranges.
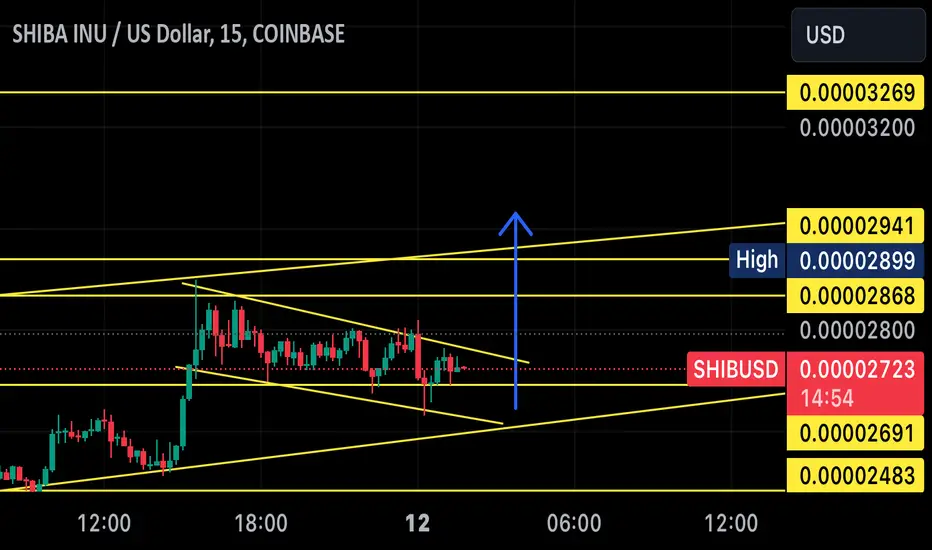
My Goals for shibusdtAll details are drawn on the chart
Breaking the support area doesn’t mean that it’s a good chance to buy although I don’t think that it will
So waiting till the end of this year to reach my Goals

SHIBA still in the fightPositives- the signal for the bottom CM Williams Fix Vix indicator is flashing green, hypothesizing that the bottom is in or forming
-price forming above the 21 EMA
-RSI is healthy but not spectacular
-CCI is positive but not high
-price forming around 50% Fib Level
Negatives
-no bullish candle printed yet
-still in downward parallel channel
- no bullish activity yet on the SRSI
Be very careful and keep an eye on the negatives check timeframes and wait for the candle to print.

Will it continuePossible reversal long wick candle forming on 12 hr Time Frame with SRSI approaching oversold levels. SHIB may possibly but not certain look like it could be making new trendline. Keep and eye if SHIB can break out of channel

Shiba INU ready to fall ... Hello you all would have seen the bull run I had predicted long time back ... Beware I am expecting a fall in crypto currency all, Are forming negative patterns at the top ... stay away from the trap
Gautam Khanna
GK trade Manthan

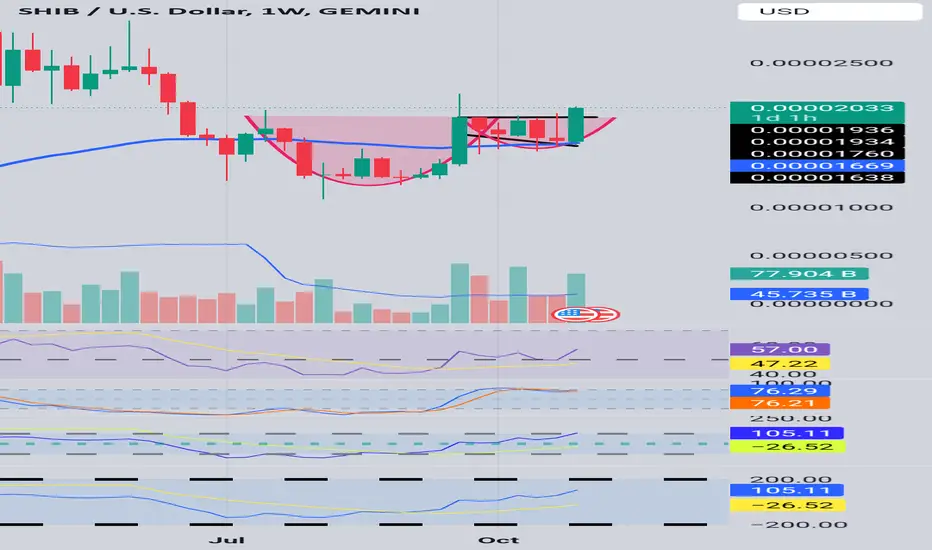
SHIBIDY BIBIDYnot yet confirmed but could be a massive cup and handle formation on the weekly chart.
i'm highly skeptical this plays out but just wanted to point out the formation.
not trading advice and have patience
TJG

Friendly ReminderJust a friendly notification, to check resistance levels and Oversold/overbought indicators and watch out for candles and wait for the candle to print. SHIB is lingering around a resistance level and RSI and SRSI and CCI levels indicate caution overbought territory. Have a bless day.


Next leg up coming soon! She can’t wait to fly! Not financial advice ! Just hold for the ride! Shiba Inu is primed after
bitcoin’s monstrous growth! And dogecoin following suit. Elon x Trump conversion.
SHIB IS PRIMED FOR A MASSIVE 123% MOVE HIGHERCRYPTOCAP:SHIB
SHIB IS BREAKING OUT AND IT'S A BUY RIGHT NOW!
ITS A #HIGHFIVESETUP MEANING THE FOLLOWING:
1.) BULLISH uptrend on MACD (blue over orange
2.) BULLISH uptrend on RSI (higher lows)
3.) BULLISH uptrend on Stoch (red over yellow)
4.) We have a volume shelf with a volume gap
5.) Breakout on the symmetrical triangle pattern
Price Targets for this Weekly chart:
PT1: 0.000029584
PT2: 0.000044097

Shiba Inu breaking upward from channel; over halfway to targetSheba is blasting off so quick by the time I got around to posting a chart about it t’s already 3/4ths of the way to the breakout target. *not financial advice*

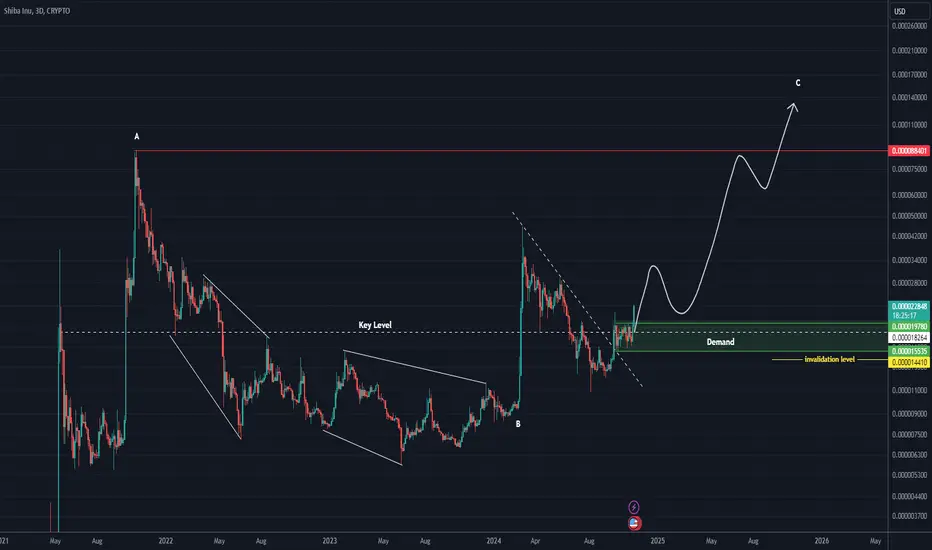
SHIB Looks BullishShiba appears to be entering a bullish wave C.
By maintaining the green range that overlaps with the KEY level, it can go to the ATH.
You should not have an emotional entry, you must have a set position to enter.
Shiba's market cap is 13B, which is a bit heavy, and you shouldn't expect big profits from this coin.
The target is above ATH
Closing a daily candle below the invalidation level will violate this analysis
For risk management, please don't forget stop loss and capital management
When we reach the first target, save some profit and then change the stop to entry
Comment if you have any questions
Thank You

Is it tea time?There appears to be a cup and handle forming on SHIB weekly chart. Not too sure, these patterns could be subjective. Also, at this time there is a bullish green candle forming on the 50 EMA. CCI indicator is looking good. Monday game time. God bless us all
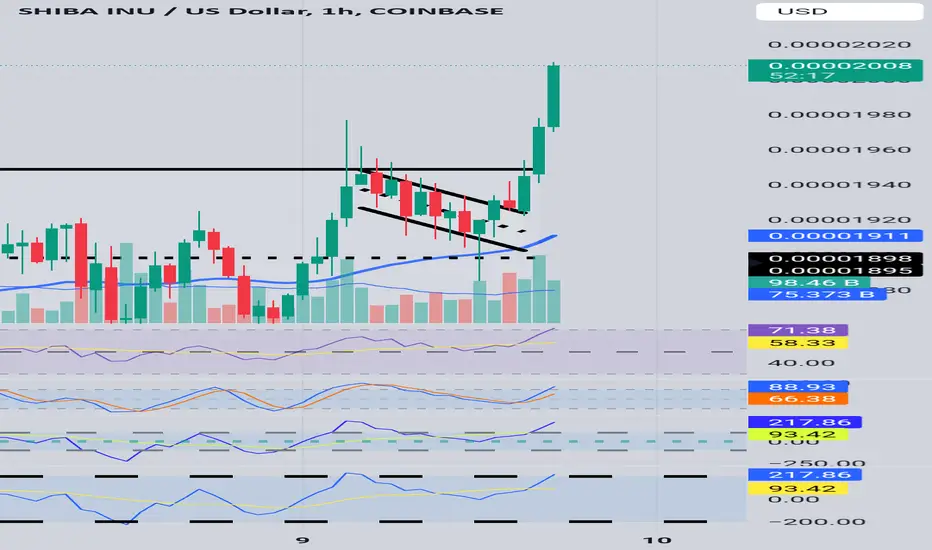
SHIB minipump?Is SHIB going to do something spectacular like it's big brother BTC. In the hour chart in the sideway parallel channel. SHIB has closed above it, with a bullish engulfing candle and with healthy CSI and RSI and SRSI readings.
Please be careful and grab the popcorn.
ShibUSD...all setup on Daily & Weekly charts. Plz see.
I don't hold this particular Crypto and I am not taking this trade as such as I have enough that could go wrong already.
But this one has a Daily head n shoulders pattern which will be a rocket upwards, bullish macd and rsi momentum and the weekly chart lines up in a similar vein.
Hmmm, I think this one has an awful spread on the buy, but i'm not certain.
Oh, what I also like about this trade is that the 200ema (white thicker line) is situated right below price on the daily.

Critical Moment for SHIB, AccumulationCritical moment, will SHIB break out of the parallel structure or will it cycle back down.
SHIB is currently forming a bullish candle on the 50 EMA. We must wait until the weekly candle prints.

SHIB/USD daily chart analysisFor a bullish bias to remain intact, SHIB/USD should stay above the ascending trendline, ideally with support from the 50-day SMA and increasing Stochastic RSI.
For breakout confirmation, look for a close above the 200-day SMA, a breach of recent swing highs, and strong trading volume, all of which would reinforce the probability of an extended upward move.

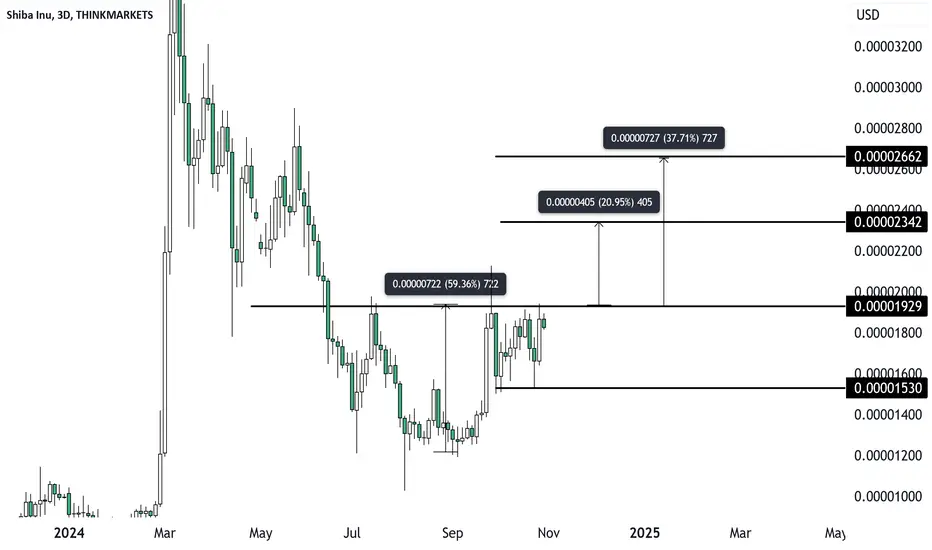
Shiba Ready to Explode? Two Patterns Point to Massive VolatilityAltcoins like Shiba Inu are gaining momentum as Bitcoin edges closer to a new all-time high.
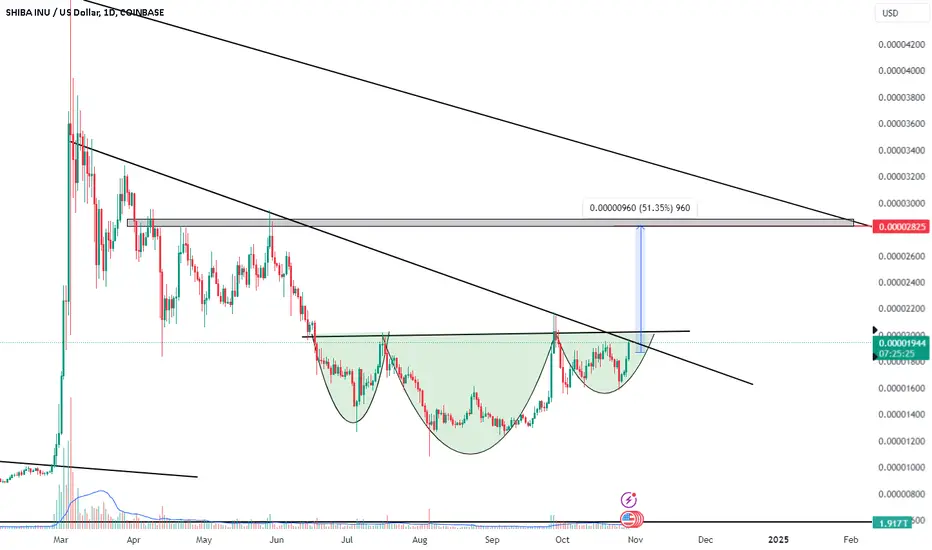
For Shiba, the last 135 days of price action on the 3-day chart reveal two significant patterns. First, an inverse head and shoulders pattern suggests that a breakout above the October 18 high could drive Shiba Inu up by 37.71%, reaching the upper level indicated on the chart. Additionally, over the last 30 days, Shiba Inu appears to be in a smaller rectangle-like pattern that would also trigger on a move above the October 18 high, signaling a potential 20.95% gain. Ideally, the market would trade sideways for the next 48 hours just below this key level, setting up an excellent risk-to-reward ratio for a breakout opportunity.
What’s your take on Shiba Inu’s potential?
This content is not directed to residents of the EU or UK. Any opinions, news, research, analyses, prices or other information contained on this website is provided as general market commentary and does not constitute investment advice. ThinkMarkets will not accept liability for any loss or damage including, without limitation, to any loss of profit which may arise directly or indirectly from use of or reliance on such information.
Shiba INU ... 54% return expected in short terShiba INU is forming right shoulder and almost on verge of giving breakout any movement from here will get 54% return on investment
Enjoy the ride Targets are mentioned in the chart.
Gk
GK trade Manthan
Stock Analyst by Passion