CAN SILVER RETURN TO ITS HISTORIC HIGH OF $50?In the world of precious metals, gold has already broken its all-time high in recent months, supported by solid fundamentals. Another precious metal is now catching up: silver. Unlike platinum and palladium, silver today combines all the necessary ingredients to revisit its historic peak. Its bullish potential stems from a unique blend of market volume, correlation with gold, supportive fundamentals, and favorable technical conditions. Silver isn’t just "gold’s little brother": it is currently the only precious metal with both the technical and structural setup to aim once again for the mythical $50 mark, last reached in 2011.
1) After GOLD, silver is the most liquid precious metal and has the highest positive correlation
The first key factor is liquidity. On the precious metals market, gold remains the clear leader, with hundreds of billions of dollars traded daily. Silver comes second, far ahead of platinum and palladium, with around $5 billion in daily volume. This level of activity is crucial—adequate liquidity allows speculative and institutional flows to fully express themselves. Conversely, the low volumes of platinum and palladium limit their upside, as their markets are too narrow to support the kind of momentum seen in gold or silver.
The second strength of silver lies in its natural correlation with gold. Historically, the two metals move in sync. This behavioral alignment is reflected in a correlation coefficient close to 1. Platinum and palladium, by contrast, respond to industrial demand, particularly from the auto sector and emissions technology. Silver, however, blends industrial uses (jewelry, electronics, solar panels, etc.) with a monetary and financial role similar to gold. This dual nature makes silver a hybrid asset, with both ETF-driven financial demand and jewelry-like industrial demand.
2) Technically, the SILVER/GOLD ratio remains in a short-term uptrend from a long-term support
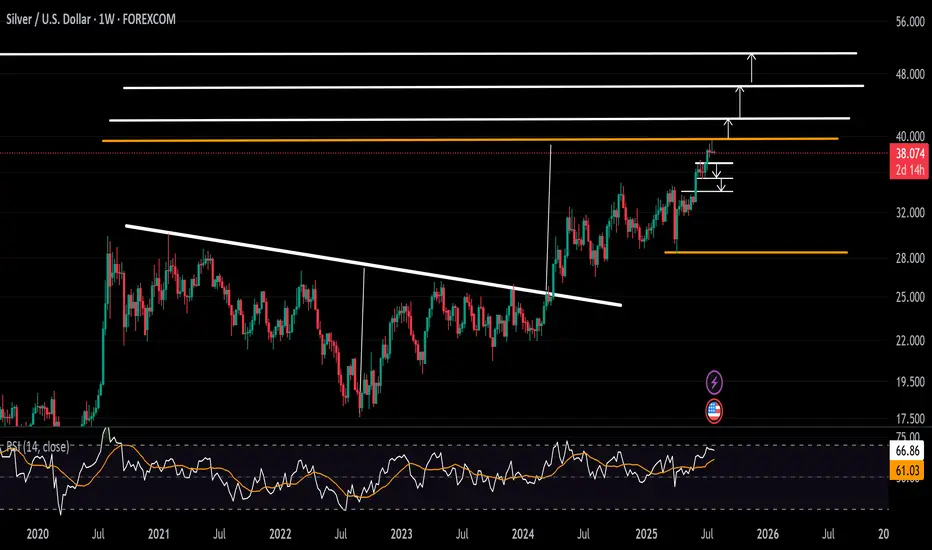
Technical analysis reinforces this fundamental outlook. While gold appears to be losing steam after hitting $3,500, silver still shows a medium-term bullish setup—even though short-term corrections are always possible. The gold/silver ratio, historically useful to detect when silver outperforms gold, also suggests that silver is poised for further gains. Silver’s long-term trend remains bullish as long as the $34–$35 support zone holds. The $50 mark is the natural technical target of this trend.
The following chart shows the gold/silver ratio and indicates that silver is likely to outperform gold through year-end:
And here is the monthly candlestick chart of spot silver:
DISCLAIMER:
This content is intended for individuals who are familiar with financial markets and instruments and is for information purposes only. The presented idea (including market commentary, market data and observations) is not a work product of any research department of Swissquote or its affiliates. This material is intended to highlight market action and does not constitute investment, legal or tax advice. If you are a retail investor or lack experience in trading complex financial products, it is advisable to seek professional advice from licensed advisor before making any financial decisions.
This content is not intended to manipulate the market or encourage any specific financial behavior.
Swissquote makes no representation or warranty as to the quality, completeness, accuracy, comprehensiveness or non-infringement of such content. The views expressed are those of the consultant and are provided for educational purposes only. Any information provided relating to a product or market should not be construed as recommending an investment strategy or transaction. Past performance is not a guarantee of future results.
Swissquote and its employees and representatives shall in no event be held liable for any damages or losses arising directly or indirectly from decisions made on the basis of this content.
The use of any third-party brands or trademarks is for information only and does not imply endorsement by Swissquote, or that the trademark owner has authorised Swissquote to promote its products or services.
Swissquote is the marketing brand for the activities of Swissquote Bank Ltd (Switzerland) regulated by FINMA, Swissquote Capital Markets Limited regulated by CySEC (Cyprus), Swissquote Bank Europe SA (Luxembourg) regulated by the CSSF, Swissquote Ltd (UK) regulated by the FCA, Swissquote Financial Services (Malta) Ltd regulated by the Malta Financial Services Authority, Swissquote MEA Ltd. (UAE) regulated by the Dubai Financial Services Authority, Swissquote Pte Ltd (Singapore) regulated by the Monetary Authority of Singapore, Swissquote Asia Limited (Hong Kong) licensed by the Hong Kong Securities and Futures Commission (SFC) and Swissquote South Africa (Pty) Ltd supervised by the FSCA.
Products and services of Swissquote are only intended for those permitted to receive them under local law.
All investments carry a degree of risk. The risk of loss in trading or holding financial instruments can be substantial. The value of financial instruments, including but not limited to stocks, bonds, cryptocurrencies, and other assets, can fluctuate both upwards and downwards. There is a significant risk of financial loss when buying, selling, holding, staking, or investing in these instruments. SQBE makes no recommendations regarding any specific investment, transaction, or the use of any particular investment strategy.
CFDs are complex instruments and come with a high risk of losing money rapidly due to leverage. The vast majority of retail client accounts suffer capital losses when trading in CFDs. You should consider whether you understand how CFDs work and whether you can afford to take the high risk of losing your money.
Digital Assets are unregulated in most countries and consumer protection rules may not apply. As highly volatile speculative investments, Digital Assets are not suitable for investors without a high-risk tolerance. Make sure you understand each Digital Asset before you trade.
Cryptocurrencies are not considered legal tender in some jurisdictions and are subject to regulatory uncertainties.
The use of Internet-based systems can involve high risks, including, but not limited to, fraud, cyber-attacks, network and communication failures, as well as identity theft and phishing attacks related to crypto-assets.
SILVER trade ideas

Wait SIlverLook at the RSI to form something like this in combine with the last 2 waves down. Then hopefully that power move to the 600?? Macro on the monthly its forming a cup and handle. If plays out silver will be super pricy
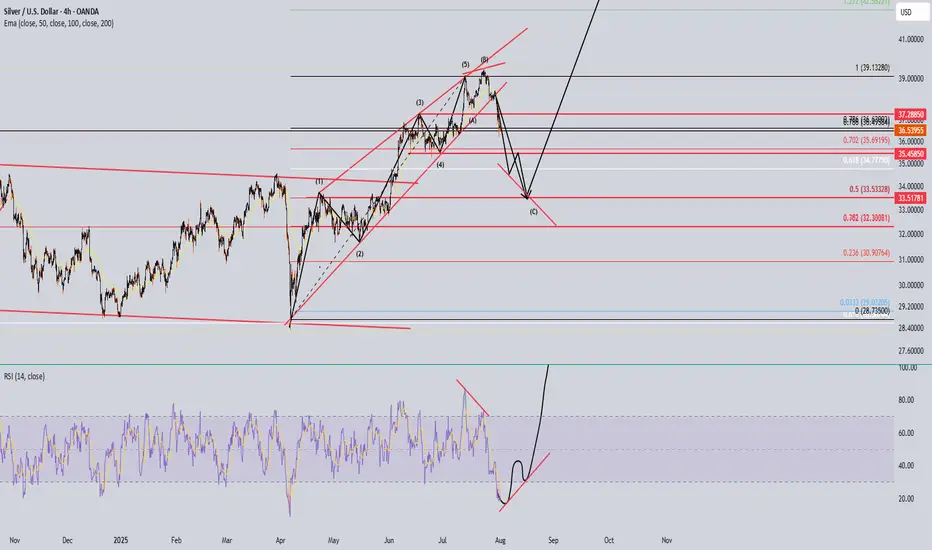
Not time to dismount yet!!!Dont get shaken off the horse...yet. There is more to come imo...this is to shake the weak hands...

SILVER XAGUSD ON 3OTH we are expecting a strong fundamental data .
ADP Non-Farm Employment Change forecast 82K previous -33K
Advance GDP q/q forecast 2.4% previous -0.5% Advance GDP Price Index q/q forecast 2.3% previous 3.8%
Pending Home Sales m/m0.3% 1.8%
7:00pm
USD
Federal Funds Rate
4.50% 4.50%
USD
FOMC Statement
7:30pm
USD
FOMC Press Conference.
we will be watching the data outlook for clear directional bias.

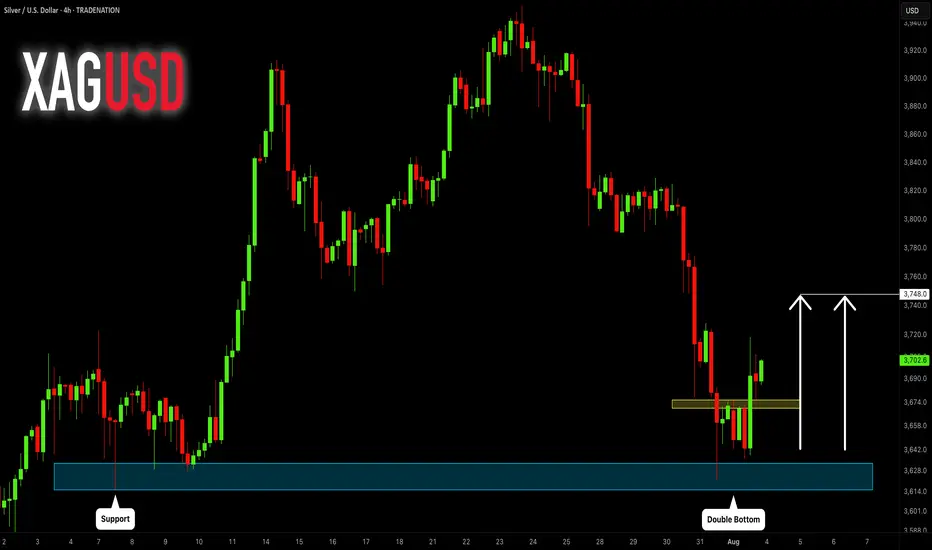
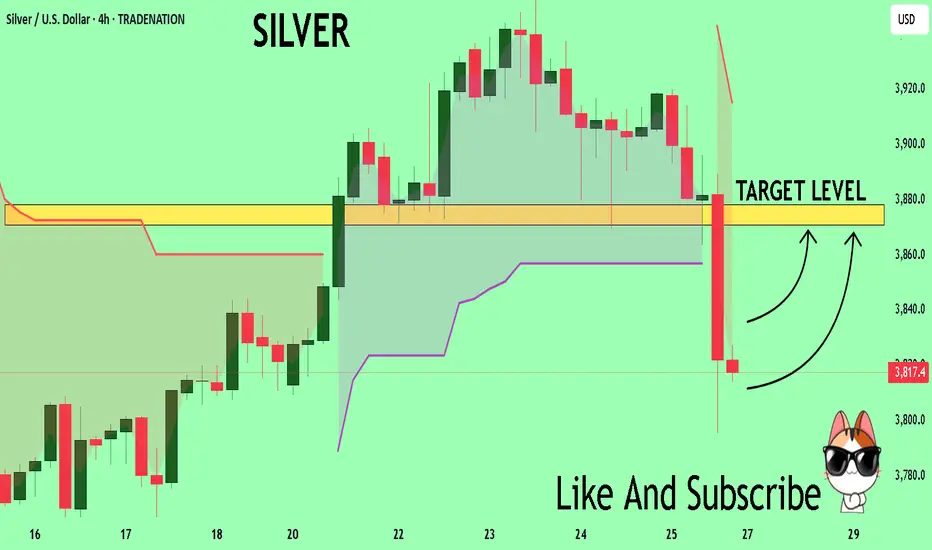
SILVER (XAGUSD): More Growth Ahead
It looks like Silver is going to continue growing next week,
following a strong bullish reaction to a key daily horizontal support.
The next strong resistance is 3748.
It will be the next goal for the buyers.
❤️Please, support my work with like, thank you!❤️
I am part of Trade Nation's Influencer program and receive a monthly fee for using their TradingView charts in my analysis.
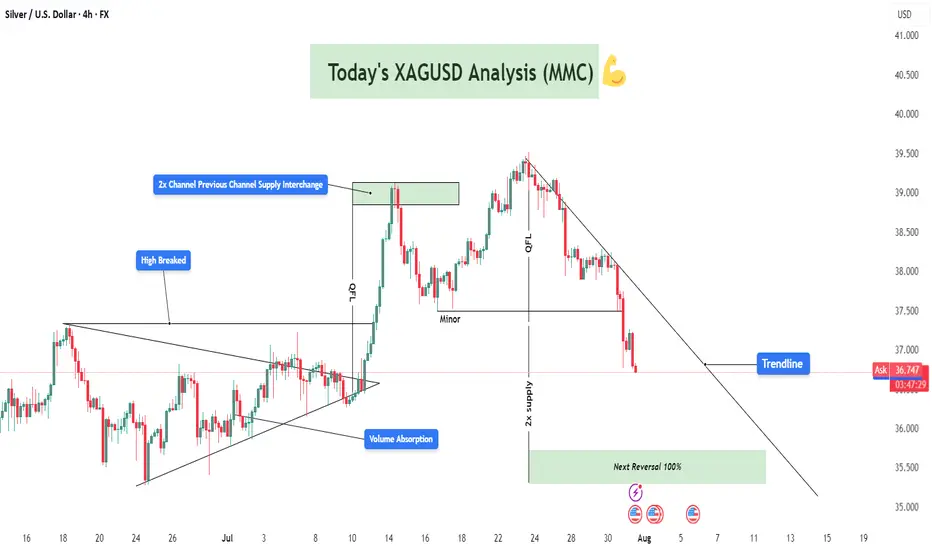
XAGUSD Analysis : Bearish Setup 2x Supply to Next Reversal Zone🔍 Market Context & Technical Overview
Silver (XAGUSD) has recently gone through a sharp corrective phase after breaking above a key structural high and retesting previous resistance. The current price action reflects a clean MMC-patterned behavior, including volume absorption, QFL trap, and interaction with a descending trendline that has now become critical for further directional bias.
🧠 Key Observations Based on MMC Principles
🔵 1. Volume Absorption at the Triangle Breakout
After a prolonged consolidation phase inside a triangle pattern, volume absorption took place—indicating hidden accumulation.
A breakout above the structure was confirmed with momentum (also breaking a previously established “High Breaked” level).
This breakout led to a vertical move towards the 2x Channel Supply Interchange Zone, where price reversed sharply.
🟥 2. Supply Interchange Zone (2x Confirmed)
Price encountered resistance at the green supply block, which acted as a 2x supply zone—a critical confluence where previous sellers re-engaged.
This area had previously served as the channel boundary, creating a supply interchange effect.
⚠️ 3. QFL Zone Trap (Fake Momentum)
The price printed a QFL structure, where it created a flat base, faked a move up, and quickly reversed.
The QFL base acted as a trap for late buyers, which aligned with the start of a bearish phase that is still ongoing.
📉 4. Downtrend & Trendline Respect
Price has respected a strong descending trendline since the reversal at supply.
Each retest has resulted in a lower high, confirming the bearish structure is intact for now.
Currently, the price is trading below this trendline, reinforcing short-term bearish sentiment.
📦 Key Levels to Watch
Zone/Level Type Role
38.70 – 39.20 2x Supply Zone Strong resistance, reversal origin
37.40 – 37.60 Minor Level Short-term support turned resistance
36.00 – 35.40 Next Reversal Zone ✅ High-probability long area, MMC expects reaction
Trendline Dynamic Structure control, needs break for bullish shift
🔁 Scenarios Based on Structure
📈 Scenario 1: Bullish Reversal from Green Demand Block
Price is approaching the next MMC reversal zone (green box below 36.00).
MMC logic suggests a 100% probability of bullish reaction based on:
Volume cycle completion
Downward exhaustion
Proximity to previous institutional accumulation zones
Expected move: bounce toward trendline retest and minor resistance at ~37.50.
📉 Scenario 2: Break Below Green Zone = Panic Sell
If the green zone fails to hold:
A panic drop toward 34.80–35.00 is possible.
However, based on MMC mapping, this is less likely without a major macro catalyst.
💡 Strategic Thoughts (MMC Traders’ Lens)
We’re observing a classic MMC Phase 3 correction following Phase 2 expansion.
The current cycle favors reaccumulation, especially if a wick or engulfing candle forms inside the green zone.
Price action traders should wait for confirmation (e.g., break of trendline, bullish structure on 1H) before entering.
📌 Educational Trade Plan (Not Financial Advice)
Setup Entry Zone Stop Loss Target 1 Target 2
Reversal Long 35.80 – 36.20 35.40 37.50 38.70
Trendline Break Long Above 37.10 36.40 38.00 39.00
Bearish Continuation Below 35.40 36.10 34.80 33.90
🧾 Conclusion & Final Note
Silver is trading at a make-or-break point as it approaches a high-probability reversal zone, identified through MMC methodology. Watch the price action near 36.00 closely—it holds the key to whether we begin a new bullish phase or extend this bearish cycle.
✅ MMC traders will stay reactive, not predictive, and align with structure.
🚨 Patience is key—let the market show its hand before commitment.
(XAGUSD) Volume Absorption to Bullish Continuation To Target🧱 1. Market Structure Breakdown:
The 4H chart of Silver (XAGUSD) reveals a well-structured price action sequence, beginning with a compression breakout, a strong bullish impulse, and a current retracement phase into a key reversal zone.
🔺 Symmetrical Triangle & Volume Absorption (Early July):
The market was forming higher lows and lower highs, indicative of consolidation inside a symmetrical triangle.
During this phase, a volume absorption event occurred—indicating smart money was accumulating before a breakout.
This was followed by a strong bullish breakout, confirming upside strength and clearing previous highs.
📈 2x Channel Supply Zone — Now Demand:
After breaking above the triangle, the price surged into a key supply zone, created from a prior channel top.
This zone was tested, absorbed, and flipped into a new demand zone, as buyers overwhelmed sellers.
This supply-demand interchange confirmed a structural change in market sentiment.
🚀 2. Momentum Confirmation — High Breakout:
The "High Breaked" level, marked clearly on the chart, acted as a bullish breakout trigger.
This breakout not only breached the prior resistance but established a new bullish leg—providing strong confirmation of trend continuation.
🔁 3. QFL Zone & Controlled Pullback:
After the surge, the price began to correct from the QFL (Quick Flip Level).
This level usually represents an area where short-term distribution or profit-taking occurs.
The pullback from this zone was controlled but sharp, which is natural after such a strong move up.
🟩 4. Next Reversal Zone — The Critical Demand Block:
Price is now entering a high-probability reversal zone, marked around $37.5–$36.8.
This area is critical due to:
Confluence with previous structure and minor support.
Potential bullish absorption area.
Last base before the impulse up.
If bullish price action (like bullish engulfing, pin bar, or volume spike) is seen here, it could signal the start of the next leg up.
🧨 5. Key Warning: "If it crosses, this will be Supply Double"
If this zone fails to hold, the demand will flip into double supply, likely accelerating bearish momentum.
In such case, Silver may revisit Major Support near the $36.0–$35.5 zone.
🧭 Potential Trading Scenarios:
✅ Bullish Path (Primary Expectation):
Price reacts from the reversal zone with bullish momentum.
Breaks back into the Central Zone (~$38.5).
Forms a higher low → continuation toward $39.5–$41.0.
Breakout above the recent swing high confirms the continuation pattern.
Trade Idea:
Long entries near $37.2–$37.5 with SL below $36.8.
Target zones: $38.8 (short-term), $39.8–$41.0 (swing).
❌ Bearish Continuation (Alternative Plan):
Reversal zone fails to hold.
Price breaks and closes below $36.8.
Previous support becomes resistance — bearish retest.
Continuation toward $36.0–$35.5 zone.
Trade Idea:
Short on break and retest of $36.8.
SL above the reversal zone.
TP near $35.5 or based on volume exhaustion.
🧠 Market Psychology Insight:
This setup shows a clear institutional playbook:
Accumulation → Breakout → Profit-taking → Retest → Continuation.
If smart money is active, expect defense of the reversal zone followed by a strong bounce.

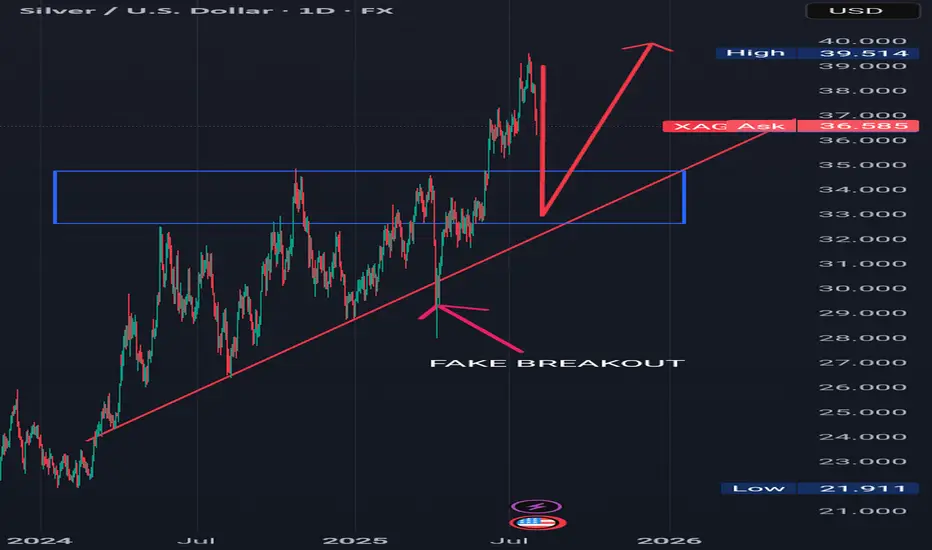
XAGUSD - Silver - Important levels for the next few years!!These are important levels for the next few years.
I expect a new ATH for Silver. Better know where you buy and where you should sell.
Several CUP & Handle show how much silver is bullish.
After Gold, it's Silver's turn..

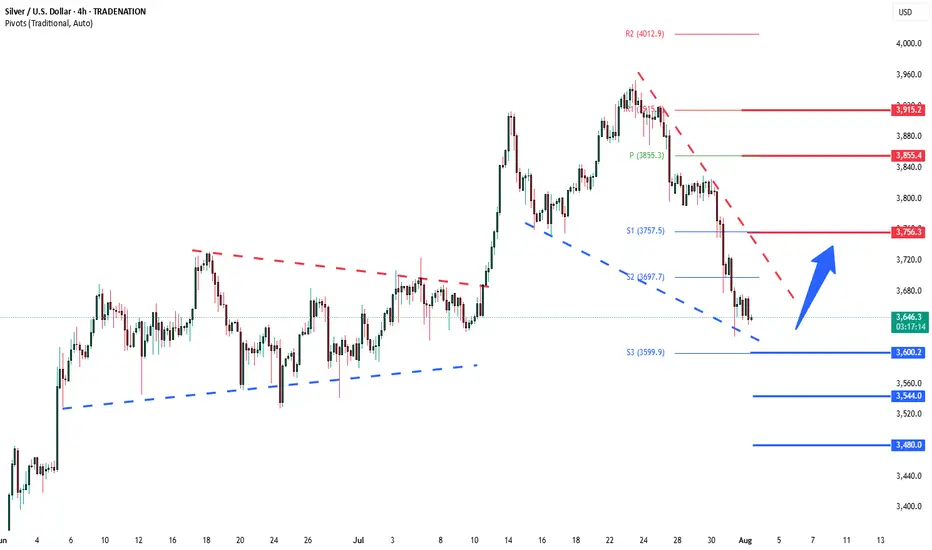
Silver coiling price action support at 3600The Silver remains in a bullish trend, with recent price action showing signs of a continuation breakout within the broader uptrend.
Support Zone: 3600 – a key level from the previous consolidation. Price is currently testing or approaching this level.
A bullish rebound from 3600 would confirm ongoing upside momentum, with potential targets at:
3756 – initial resistance
3855 – psychological and structural level
3915 – extended resistance on the longer-term chart
Bearish Scenario:
A confirmed break and daily close below 3600 would weaken the bullish outlook and suggest deeper downside risk toward:
3544 – minor support
3480 – stronger support and potential demand zone
Outlook:
Bullish bias remains intact while the Silver holds above 3600. A sustained break below this level could shift momentum to the downside in the short term.
This communication is for informational purposes only and should not be viewed as any form of recommendation as to a particular course of action or as investment advice. It is not intended as an offer or solicitation for the purchase or sale of any financial instrument or as an official confirmation of any transaction. Opinions, estimates and assumptions expressed herein are made as of the date of this communication and are subject to change without notice. This communication has been prepared based upon information, including market prices, data and other information, believed to be reliable; however, Trade Nation does not warrant its completeness or accuracy. All market prices and market data contained in or attached to this communication are indicative and subject to change without notice.
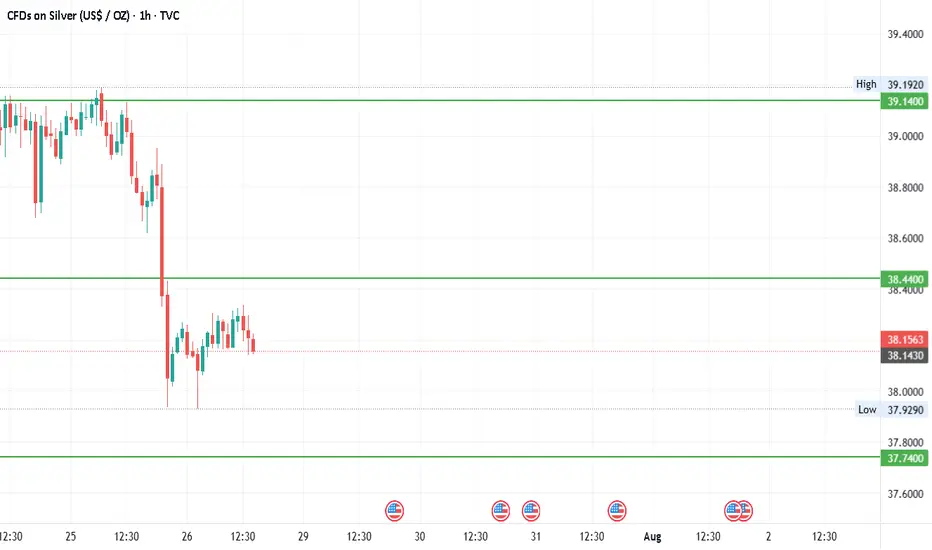
XAGUSD | Silver Rebounds from 37.50 After 39.50 RejectionSilver pulled back sharply after failing at the 39.50 resistance zone. Price is currently consolidating just above the 37.50 support area, which has held firm on the initial retest.
Support at: 37.50 / 37.00 🔽
Resistance at: 39.50 🔼
🔎 Bias:
🔼 Bullish: A clean breakout above 39.50 could resume the uptrend.
🔽 Bearish: A break below 37.50 opens room toward 37.00 and 36.00.
📛 Disclaimer: This is not financial advice. Trade at your own risk.

Market Stuck in Limbo? XAGUSD Update & Likely Range AheadLet’s talk silver.
The market's clearly undecided — no real momentum, just hesitation.
We’re approaching overextended RSI levels, so don’t expect fireworks just yet.
Im Skeptic from Skeptic Lab and In this quick update, I’ll show you what I’m watching for both long and short triggers …
and why a range might dominate the next few days.
👉 Watch till the end to avoid getting trapped by fake breakouts.

XAGUSD Technical Outlook – July 27, 2025
Silver appears to be losing momentum at the top, and for the first time in a while, we’ve seen a strong bearish daily candle, suggesting that sellers may be stepping in more seriously.
🌀 Previous pullbacks mostly looked like profit-taking, but this drop seems to be accompanied by actual selling pressure.
Despite breaking the previous high over the past two weeks, silver has failed to extend gains meaningfully — a potential sign of exhaustion.
🎯 A low-risk short opportunity may be forming around the $38–$39 range.
⚠️ For more patient and risk-tolerant traders, a daily close below $37 could open the door for a broader correction toward the $33–$35 zone — levels that have remained untested.
Stay sharp — momentum shifts often start quietly.

#SILVER - $3 Swing? 42 or 34.87?Date: 28-07-2205
#silver
Current Price: 38.15
Pivot Point: 38.440 Support: 37.740 Resistance: 39.145
Upside Targets:
Target 1: 39.812
Target 2: 40.480
Target 3: 41.245
Target 4: 42.010
Downside Targets:
Target 1: 37.070
Target 2: 36.400
Target 3: 35.635
Target 4: 34.870
#TradingView #Stocks #Equities #StockMarket #Investing #Trading #silver
#TechnicalAnalysis #StockCharts #Finance
#Gold #Bitcoin #Silver #TradingView #PivotPoints #SupportResistance
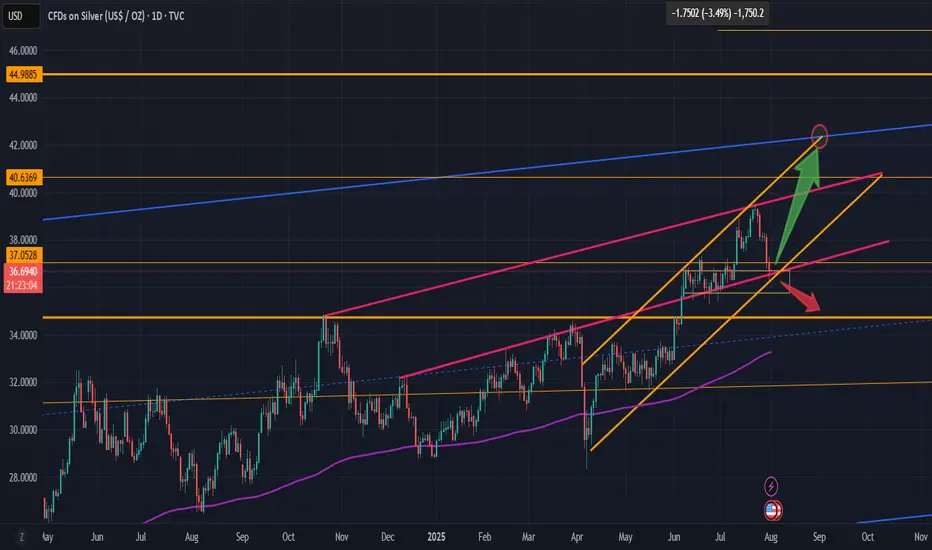
Silver short term potential correction within a bull marketSilver short term potential correction within a bull market. Either way...
Don't leverage. Buy ETF or physical, and hold.
BUY AFTER THE PULLBACK Analyzing the daily time frame of silver, we can see that silver is in a bullish uptrend.
The price of silver is respecting a rising trend line which is acting as support in the past, only for some few times in the past did it exhibit a fake breakout which is indicated with an arrow.
I see the price of silver from its current price actions selling to our required point of interest and looking for buy liquidity to buy at our confluence which is both previous resistance which was broken to the upside which I indicated with a blue rectangle and a rising trend line.
Please look for buys at the previous broken resistance which is indicated with a blue rectangle in confluence with a rising trendline.
.............,...........................................
Please kindly share your thoughts on silver
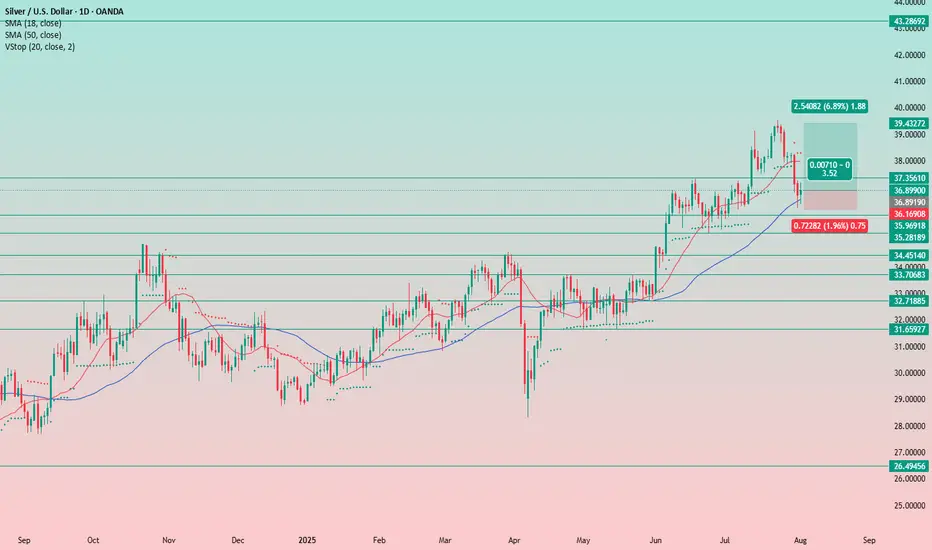
Silver Remains a Buy on DipsIt seems the precious metals market didn’t mourn the Fed’s decision and subsequent press release for long.
The uptrend remains intact, and the previously supportive factors are still in play.
Even amid the negative news, there was no sharp sell-off — everything stayed within the trend. This clearly signals that rate cuts are on the horizon, and metals are likely to continue their upward move.
We only trade from the long side — nothing has changed.
At the moment, we've seen a pullback, and it feels strange not to take advantage of it and add more silver to the portfolio.
Stop-loss is set below yesterday’s candle low at 36.15.
We’ll see how the position develops. For now, the idea is to hold as long as the stop-loss holds. The long-term target is 48. Obviously, we won't reach it quickly, so I’ll trail the stop as the trade progresses — first to breakeven, and eventually into profit.
Uptrend Intact: Price Pullback Offers New Long Entry OpportunityThe upward structure of the chart remains intact, and I believe the growth will likely continue in the near future.
At the moment, we’re seeing a price pullback, which provides new opportunities to enter a long position.
I will place a wide stop at the 37.35 level.

Silver Signals Pullback Risks From $40 BarrierFrom a fundamental standpoint, the strength seen in both tech and silver markets in 2025 may be supported by the structural integration of AI and innovation into global economic agendas. As AI and technology increasingly become the backbone of global infrastructure and development, demand is likely to remain strong.
Silver is currently retreating from the $40 psychological zone, the 39.50 high, which aligns with the target of an inverted head and shoulders pattern formed between August 2020 and March 2024.
• Pullback Scenario: In line with weekly overbought momentum as per the RSI indicator, a retracement may target support levels at $37, $36.20, and $35.20 before resuming its broader bullish trend.
• Breakout Scenario: A confirmed close above $40 may open the door to $42, $46, and potentially a move beyond $50.
Written by Razan Hilal, CMT
SILVER Trading Opportunity! BUY!
My dear friends,
Please, find my technical outlook for SILVER below:
The price is coiling around a solid key level - 38.174
Bias - Bearish
Technical Indicators: Pivot Points High anticipates a potential price reversal.
Super trend shows a clear sell, giving a perfect indicators' convergence.
Goal - 38.708
About Used Indicators:
The pivot point itself is simply the average of the high, low and closing prices from the previous trading day.
Disclosure: I am part of Trade Nation's Influencer program and receive a monthly fee for using their TradingView charts in my analysis.
———————————
WISH YOU ALL LUCK
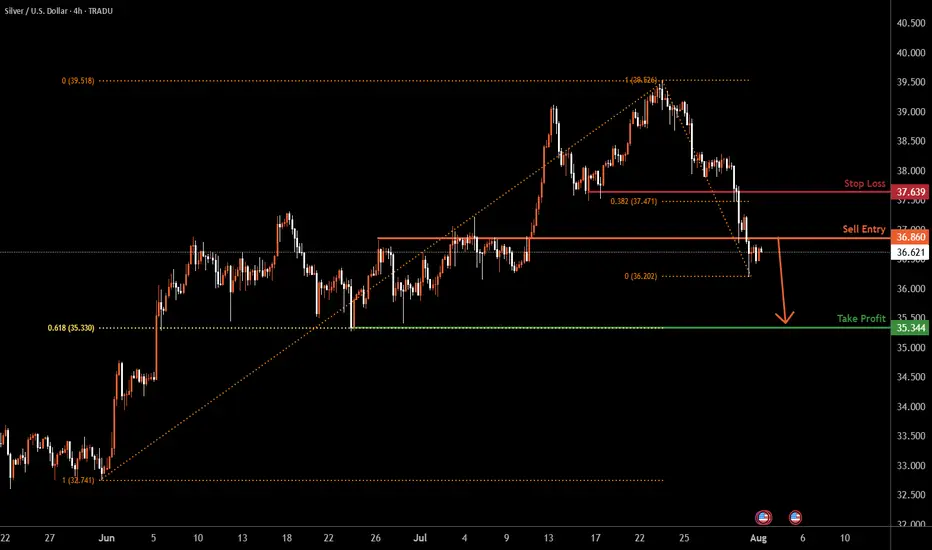
Silver H4 | Potential bearish dropBased on the H4 chart analysis, we could see the price reverse from the sell entry at 3.86, and could drop from this level to the downside.
Stop loss is at 37.63, which is a pullback resistance that is slightly above the 38.2% Fibonacci retracement.
Take profit is at 35.34, which is a swing low support that lines up with th e 61.8% Fibonacci retraecment.
High Risk Investment Warning
Trading Forex/CFDs on margin carries a high level of risk and may not be suitable for all investors. Leverage can work against you.
Stratos Markets Limited (tradu.com ):
CFDs are complex instruments and come with a high risk of losing money rapidly due to leverage. 65% of retail investor accounts lose money when trading CFDs with this provider. You should consider whether you understand how CFDs work and whether you can afford to take the high risk of losing your money.
Stratos Europe Ltd (tradu.com ):
CFDs are complex instruments and come with a high risk of losing money rapidly due to leverage. 66% of retail investor accounts lose money when trading CFDs with this provider. You should consider whether you understand how CFDs work and whether you can afford to take the high risk of losing your money.
Stratos Global LLC (tradu.com ):
Losses can exceed deposits.
Please be advised that the information presented on TradingView is provided to Tradu (‘Company’, ‘we’) by a third-party provider (‘TFA Global Pte Ltd’). Please be reminded that you are solely responsible for the trading decisions on your account. There is a very high degree of risk involved in trading. Any information and/or content is intended entirely for research, educational and informational purposes only and does not constitute investment or consultation advice or investment strategy. The information is not tailored to the investment needs of any specific person and therefore does not involve a consideration of any of the investment objectives, financial situation or needs of any viewer that may receive it. Kindly also note that past performance is not a reliable indicator of future results. Actual results may differ materially from those anticipated in forward-looking or past performance statements. We assume no liability as to the accuracy or completeness of any of the information and/or content provided herein and the Company cannot be held responsible for any omission, mistake nor for any loss or damage including without limitation to any loss of profit which may arise from reliance on any information supplied by TFA Global Pte Ltd.
The speaker(s) is neither an employee, agent nor representative of Tradu and is therefore acting independently. The opinions given are their own, constitute general market commentary, and do not constitute the opinion or advice of Tradu or any form of personal or investment advice. Tradu neither endorses nor guarantees offerings of third-party speakers, nor is Tradu responsible for the content, veracity or opinions of third-party speakers, presenters or participants.
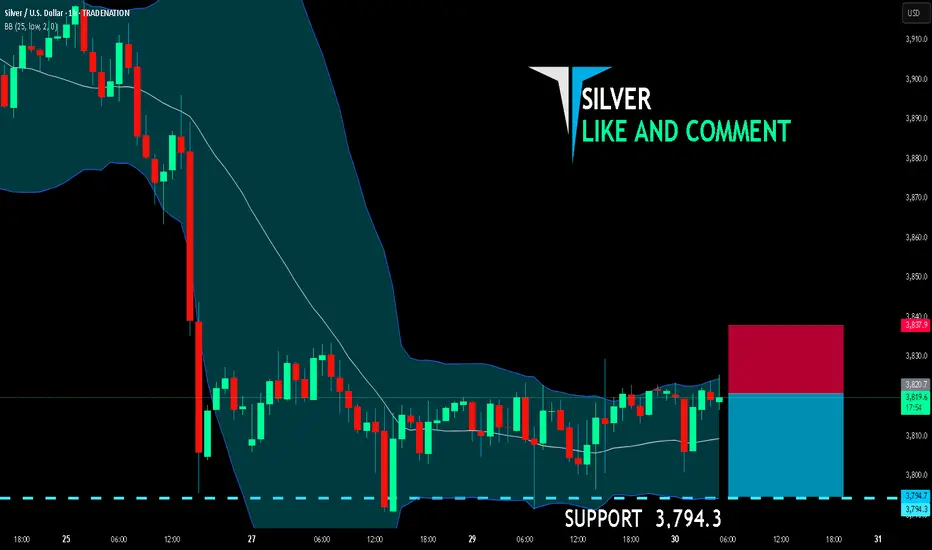
SILVER SENDS CLEAR BEARISH SIGNALS|SHORT
SILVER SIGNAL
Trade Direction: short
Entry Level: 3,820.7
Target Level: 3,794.3
Stop Loss: 3,837.9
RISK PROFILE
Risk level: medium
Suggested risk: 1%
Timeframe: 1h
Disclosure: I am part of Trade Nation's Influencer program and receive a monthly fee for using their TradingView charts in my analysis.
✅LIKE AND COMMENT MY IDEAS✅
Silver on the path of growth and developmentAs I mentioned in the previous article, silver is moving towards the desired target, which is around $40 per ounce of silver. As you can see, this three-month chart and the uptrend drawn and reproduced shows the desired price target near the top of the channel.
If there is a change and an update is needed, I will definitely check and publish it again.
Good luck.
MJ .REZAEI

Trading balanceTrading balance The price of the asset has rebounded from the balance zone. With the prospect of growth into the resistance zone.
