XAGUSD--SHORT--rejecting from upper side of channel
--potential downward movement towards horiantal line labeled as TP on the chart
SILVER trade ideas

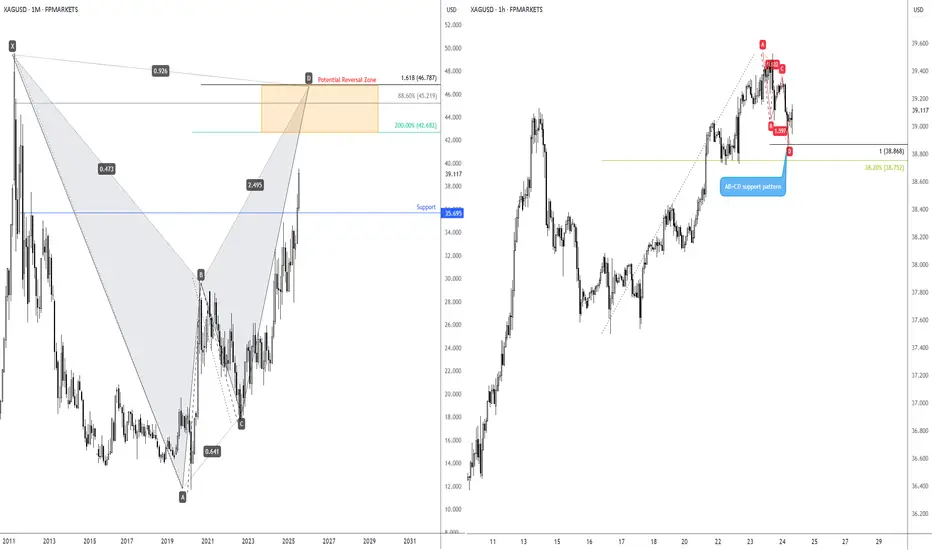
Long-term bullish action on Silver?I touched on the longer-term price action of Spot Silver (XAG/USD) last week, showing that the unit is on track to shake hands with a Potential Reversal Zone (PRZ) of a monthly harmonic bat pattern between US$46.79 and US$42.68.
Keeping things aligned with the harmonic landscape, you will note that H1 price action recently printed an AB=CD bullish pattern at US$38.87 (100% projection ratio), set just north of a 38.2% Fibonacci retracement ratio of US$38.75. While the H1 chart is generally considered short-term in nature, you may find that given we have longer-term flow suggesting scope for additional outperformance, short-term dip-buyers may consider holding a portion of their long positions open in an attempt to catch some of the possible longer-term upside.
LONG SILVERDirection: Bullish
Moving Average: Red above Blue
Pattern Impulse: Impulse correction
Fib Retracement: 38.2
MACD > 0
1st Target = 39.11
2nd Target = 39.87
RISK: Silver already making new highs

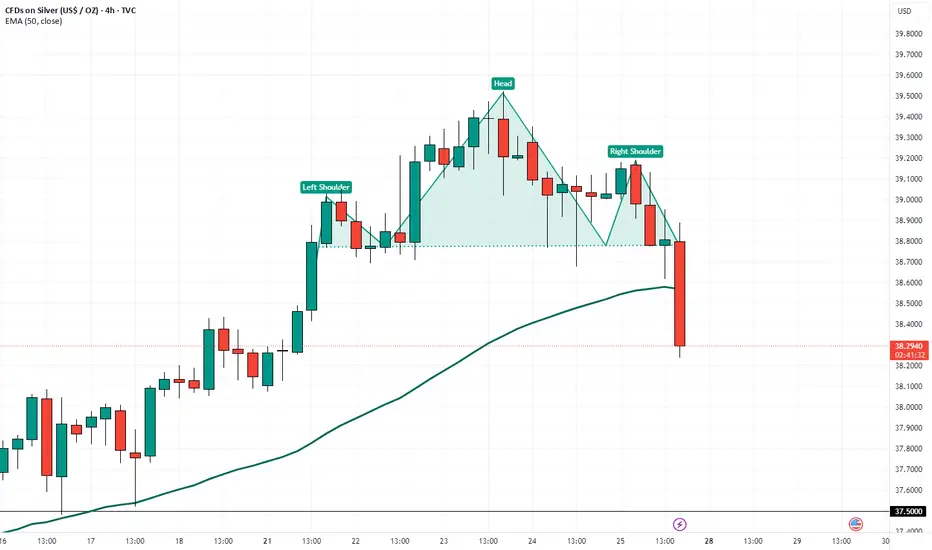
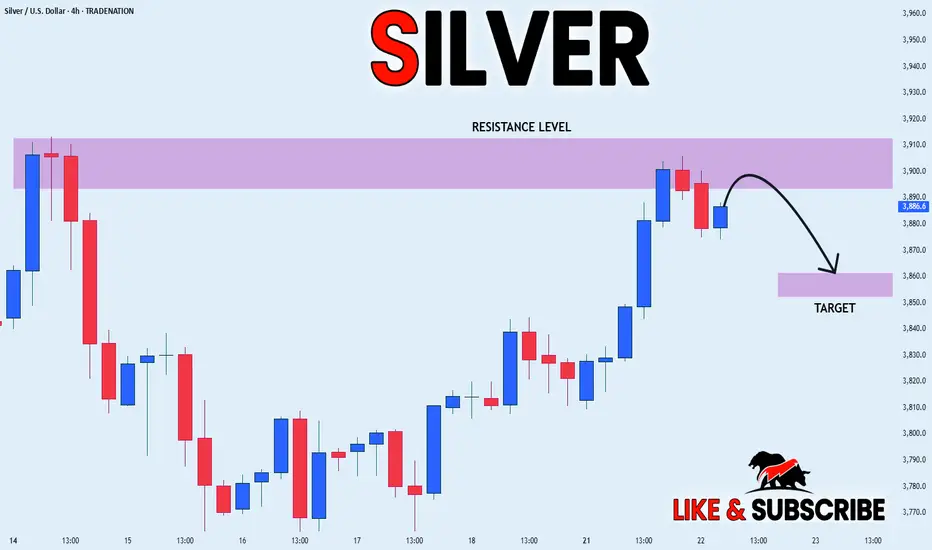
Head & Shoulders Pattern Confirmed bearish sign A clear Head and Shoulders pattern has formed on the 4H timeframe, and confirmation is in place after a decisive break below the neckline around $39.00.
🔍 Technical Breakdown:
Left Shoulder: Formed around July 11–15
Head: July 19–23 peak
Right Shoulder: Developing through July 24–25
Neckline: ~$39.00 zone (now broken)
Current Price: ~$38.30
Target: ~$38.00 – $37.80 (based on pattern projection)
The break below the 50 EMA adds bearish confirmation. Caution is advised unless price reclaims the neckline level.
SILVER Retest of Cup and Handle Neckline📈 XAGUSD Trade Idea – July 25, 2025
Timeframe: 4H
Instrument: Silver / USD (XAGUSD)
Direction: Bullish continuation
Entry Zone: $39.00 - $39.10
Current Price: $39.103
🔍 Technical Analysis:
Cup & Handle Pattern: A clean cup formation is visible from July 15–21, followed by a bullish breakout and minor handle-like retracement.
Retest in Progress: Price is retesting the breakout zone around $39.00, showing consolidation above a strong support structure.
Dynamic Support Confluence: Multiple EMAs (green/orange/red cloud) are acting as support, with recent bullish candles bouncing off the mid-band area.
TD Sequential: A new "7" count signals potential continuation of the trend if support holds.
Volume Gap Below: Clean inefficiency (thin volume) below $38.40–$38.00 which may act as a magnet in case of invalidation, but is also untested demand.
📌 Trade Setup:
Entry: Around $39.00–$39.10 on confirmed support hold
Stop Loss: Below $38.50 (beneath EMA and recent higher low)
Take Profit Zones:
TP1: $39.80 (recent swing high)
TP2: $40.60 (measured move from cup breakout)
TP3: $41.00 psychological round number

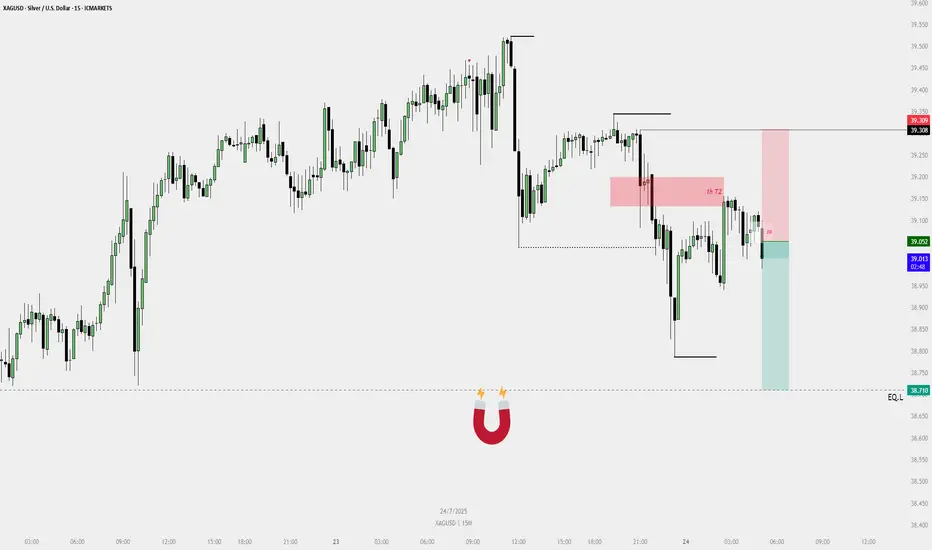
Sell Plan – XAGUSD (15M)🟥 Sell Plan – XAGUSD (15M)
Context:
Price swept liquidity from the previous swing high near the red FVG zone.
Reacted from H1 T2 bearish FVG.
Dealing Range (DR) confirmed in the 15M timeframe.
Bearish FVG formed, followed by a break of internal structure to the downside.
🔻 Trade Narrative:
After sweeping the short-term high, price tapped into the 1H T2 bearish FVG. A bearish fair value gap formed on the 15M chart, leading to the creation of a valid dealing range. Price respected this DR and showed rejection, signaling bearish intent.
⚙️ Confluences:
HTF Bearish FVG tapped (H1 T2).
Internal structure broken after the FVG.
DR formed within HTF POI.
Entry taken below DR after rejection candle.
Liquidity magnet (🧲 icon) marked below, aligning with bearish direction.
🎯 Target:
EQL (Equal Lows) marked at 38.710 – acting as liquidity target.
demand and supply strategiesprice has failed to hold demand, turning demand to supply
now, i plan to sell from supply to major demand, and hoping to goes to plan so for now we wait for confirmation.
if you have an ulterior analysis please drop...


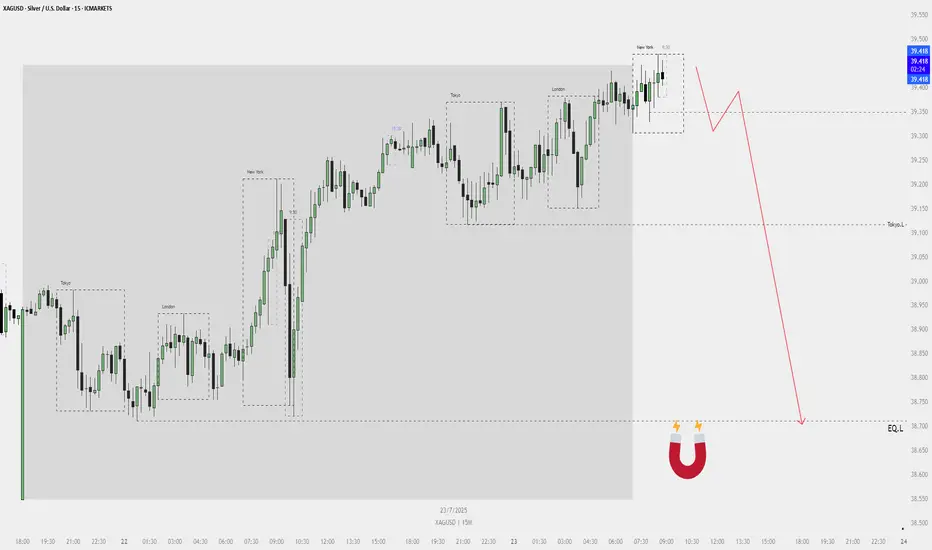
XAGUSD Sell Plan – 15M📉 XAGUSD Sell Plan – 15M
Bias: Bearish
Timeframe: 15-Minute
Date: July 23, 2025
🧠 Reasoning
Liquidity Grab: Price is sweeping short-term highs during New York open.
No More FVGs Above: Price seems to be exhausting upward momentum.
Magnet Below:
Equal lows (EQ_L) acting as a liquidity pool.
Tokyo low also lies below current price — another liquidity target.
High Probability Setup: Clean structure with a likely rejection from current premium zone.
🔴 Sell Strategy (Conceptual)
Wait for a minor liquidity grab or rejection wick to trap buyers.
Confirm a market structure shift or bearish order block.
Sell from that zone aiming for:
🎯 Target 1: Tokyo Low
🎯 Target 2: Equal Lows (Magnet zone)
⚠️ No SL/TP levels shown — trade based on structure and confirmation using your entry system (e.g., 5M DR, bearish FVG, etc.).
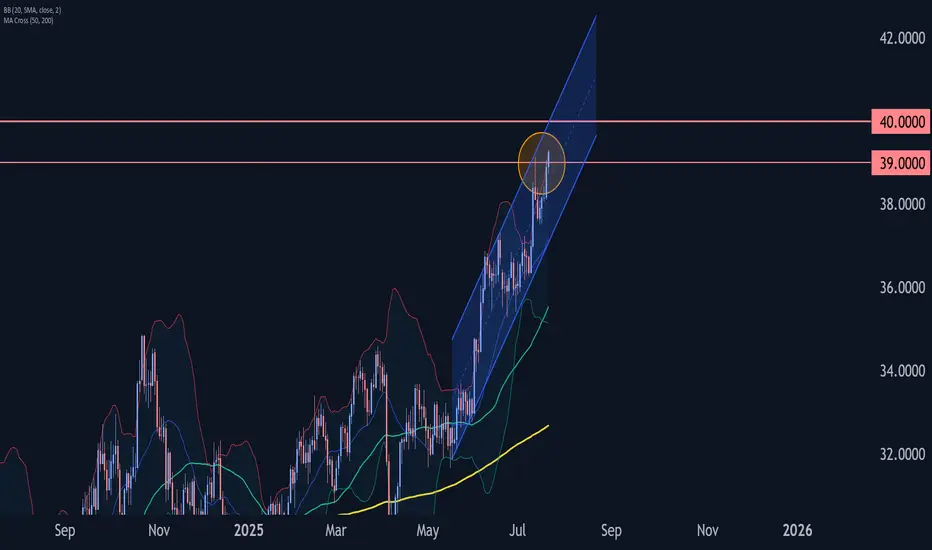
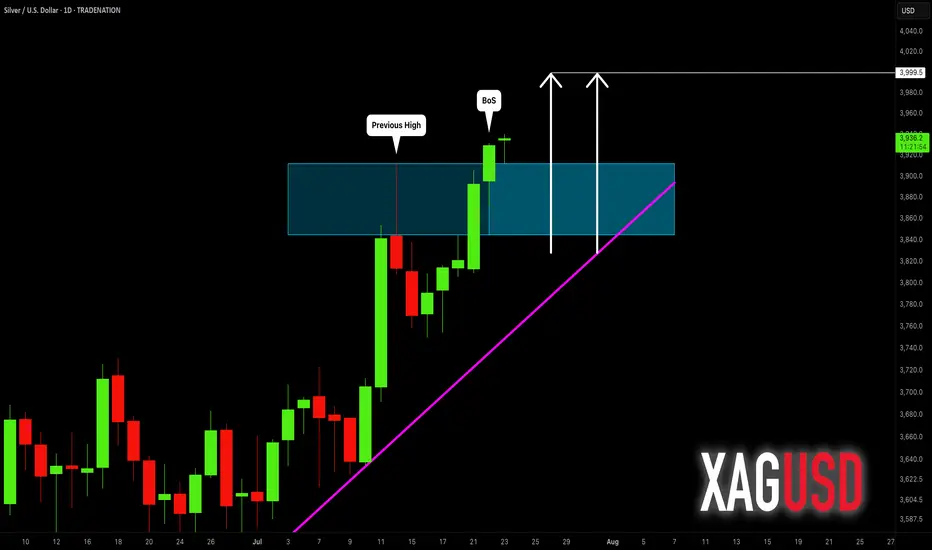
SILVER (XAGUSD): Confirmed Break of Structure
Silver updated a year's high yesterday, breaking a strong daily resistance.
With a confirmed Break of Structure BoS, we can expect that
the market will rise even more.
The next strong resistance is 40.
It is a round number based psychological level.
It can be the next goal for the buyers.
❤️Please, support my work with like, thank you!❤️
I am part of Trade Nation's Influencer program and receive a monthly fee for using their TradingView charts in my analysis
SILVER LOCAL SHORT|
✅SILVER has retested a key resistance level of 39.10$
And as the pair is already making a bearish pullback
A move down to retest the demand level below at 38.61$ is likely
SHORT🔥
✅Like and subscribe to never miss a new idea!✅
Disclosure: I am part of Trade Nation's Influencer program and receive a monthly fee for using their TradingView charts in my analysis.
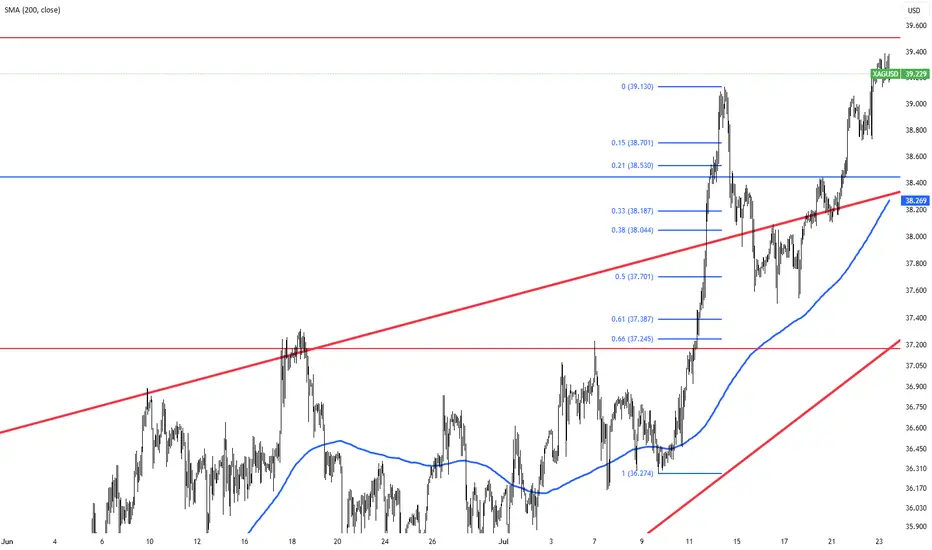
XAGUSD Outlook – 40 Remains the Next TargetIn my previous XAGUSD analysis, I argued that the trend was strongly bullish and that a move toward 40 was the next logical outcome. At the time, price was correcting, and I highlighted the 37.50 zone as a key area to look for long opportunities.
✅ Indeed, Silver respected that zone perfectly —
It retested the broken consolidation, found support, and then surged higher, marking a new multi-year high in yesterday’s session.
________________________________________
🔍 What Now?
Nothing has changed in the broader view:
• Trend: Strongly bullish
• Structure: Higher highs and higher lows remain intact
• Behavior: Dips are being bought aggressively
As long as the recent 37.50 low is not broken, the strategy remains straightforward:
Buy dips within bullish continuation
________________________________________
🎯 40 in Sight — But Don’t Be Surprised if It Goes Further
The 40 zone remains the natural next target — a major psychological level.
But based on current momentum and breakout strength, Silver could go even higher in the coming weeks and months. If buyers keep control, we might even see new ATH test by year's end (50 zone).
________________________________________
🟢 Conclusion
This breakout confirms the larger trend.
The pullback to 37.50 was bought, as expected, and now Silver is making its move.
Strategy should remain the same:
Stay long above 37.50
Buy the dips
Watch how price reacts near 40 — but keep an open mind for higher levels
Disclosure: I am part of TradeNation's Influencer program and receive a monthly fee for using their TradingView charts in my analyses and educational articles.

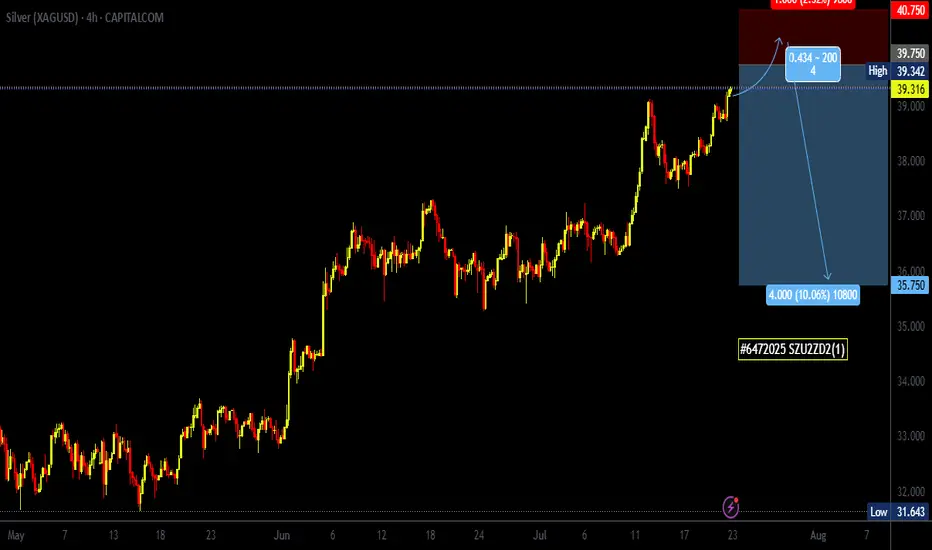
#6472025 | XAGUSD Selling opportunity 1:4XAGUSD Selling opportunity Appears in H4 Time Frame Looking Price Action for Long Term Sell
Risk and Reward Ratio is 1:4
After 50 pips Profit Set SL Entry Level
"DISCLAIMER" Trading & investing business is "Very Profitable" as well as risky, so any trading or investment decision should be made after Consultation with Certified & Regulated Investment Advisors, by Carefully Considering your Financial Situation.
XAGUSD, Elliott wave analysisOutlook for XAGUSD on 1W chart.
I think we are in sub-wave (3) of the wave (ⅲ).
Sub-wave (3) shown by Green-line will probably be an extension.
If the assumption is correct, the target for wave (3) will exceed 66.4.

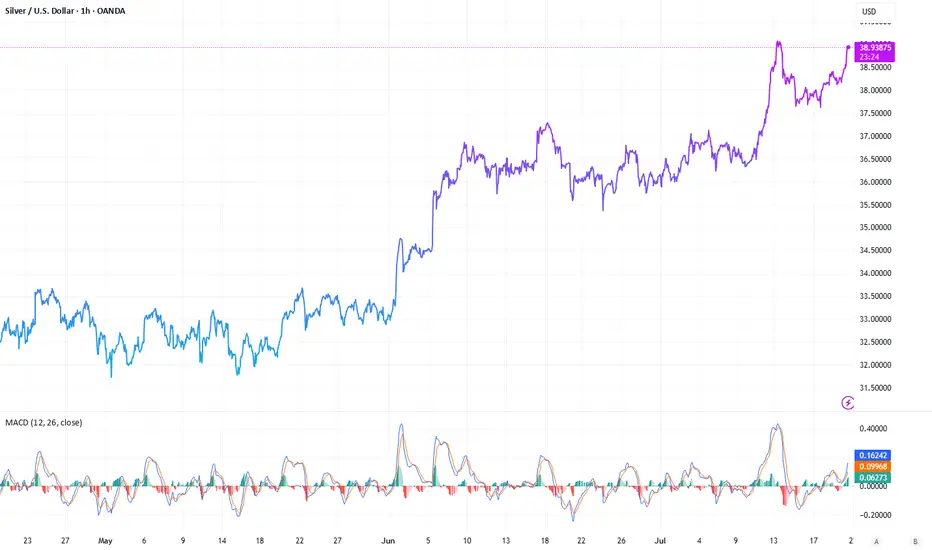
Silver Market Recap: Q2 2025 HighlightsSilver prices hit a 14-year peak in Q2 of 25 due to global uncertainties and a tight supply-demand balance. Although it shares some similar drivers with gold, silver has carved its own path, which one charged by robust industrial demand and its safe-haven appeal amid economic and geopolitical turbulence.
Silver’s Price Journey
The quarter kicked off with a dip, silver fell from $33.77 per ounce on April 2 to $29.57 by April 4. But then, it quickly regained traction, crossing $30 by April 9 and peaking at $33.63 on April 23. May brought volatility, with prices swinging between $32.05 on May 2 and $33.46 on May 23. June marked a turning point: silver surging to $36.76 by June 9 and reaching a year-to-date high of $37.12 on June 17. By the quarter’s end, prices stabilized between $36 and $37, holding strong into July.
Supply Squeeze Meets Rising Demand
Silver’s rally was underpinned by a persistent supply deficit. The Silver Institute’s World Silver Survey (April 16, 2025) reported record demand of 680.5 million ounces in 2024, driven by industries like solar energy, artificial intelligence, and electric vehicles. Meanwhile, mine production lagged, creating a 148.9-million-ounce shortfall-the fourth consecutive year of deficits. Some experts may say that we’re seeing flat supply and demand outpacing it by nearly 20%. Aboveground stockpiles have dwindled by 800 million ounces over four years-equivalent to a full year’s mine output. They call it a “perfect storm” for silver’s price trajectory.
Geopolitical and Economic Catalysts
Global tensions are having a very noticeable impact on the dynamics of silver. Escalating conflicts, including Israel’s June 12 and June 21 strikes on Iranian nuclear sites, heightened fears of disrupted trade and energy flows, just boosting this way silver’s safe-haven appeal. Meanwhile, the BRICS bloc’s push to reduce reliance on the U.S. dollar, including Russia’s proposal for a precious metals exchange, added further momentum. U.S. trade policies, particularly President Trump’s fluctuating tariffs, introduced volatility. The April 2 “Liberation Day” tariff announcement sparked fears of a recession, briefly pushing silver prices down due to its industrial exposure. I guess that any recession-driven dip would be short-lived, with silver buoyed by broader precious metals strength and a weaker U.S. dollar.
Industrial Demand in the Spotlight
Unlike gold, silver’s industrial role amplified its price movements. Its use in photovoltaics, military components, and energy infrastructure has surged, with national security priorities in the U.S. and elsewhere driving demand. Economist Dr. Nomi Prins states the following: “Silver’s industrial applications-especially in energy and defense-are outpacing supply. Geopolitical shifts are cementing its role beyond a traditional safe-haven asset.”
What’s Next for Silver?
Looking ahead, analysts remain optimistic. Some predicts, that silver will hold above $35, potentially reaching $40 by year-end, with a stronger dollar as a possible headwind. Speaking about long-term, they see the gold-silver ratio (currently 92:1, compared to a 50-year average of 60:1) narrowing to 40:1 or lower, potentially pushing silver past $100 per ounce in the next few years. Although a global recession could temper industrial demand, safe-haven buying and ongoing supply constraints are expected to provide support. Geopolitical tensions and trade disputes, particularly between the U.S. and China, are unlikely to fade, which will only increase the attractiveness of silver.
Silver's performance reflects the dynamic interplay between industrial demand, supply shortages, and global uncertainties. With favorable fundamentals and geopolitical conditions, silver is poised for continued strength in the second half of 2025, assuming recession risks remain manageable.
XAGUSD 23.07.25~+ Pressure on Powell, Waller is dovish
~+ Anticipation of the Trade deals deadline
~+ XAG didn't sell off immediately after the JP trade deal + XAUXAG downward breakout
+ Risk-on general sentiment after Japan trade deal

SILVER WILL KEEP GROWING|LONG|
✅SILVER is trading in an
Uptrend and the price made
A retest of the horizontal support
Level of 39.10$ and we are already
Seeing a bullish reaction so we
Are bullish biased and we will be
Expecting a further bullish move up
LONG🚀
✅Like and subscribe to never miss a new idea!✅
Disclosure: I am part of Trade Nation's Influencer program and receive a monthly fee for using their TradingView charts in my analysis.
Silver Stays Strong on China Growth HopesSilver remained firm around $38.90 per ounce, holding near its highest levels since 2010. A weaker dollar and lower U.S. yields underpinned the metal, while traders await Fed Chair Powell’s comments and trade updates ahead of the August 1 deadline. China’s pledge to boost industrial growth also added to silver’s positive outlook.
Resistance is at $39.50, with support at $37.40.
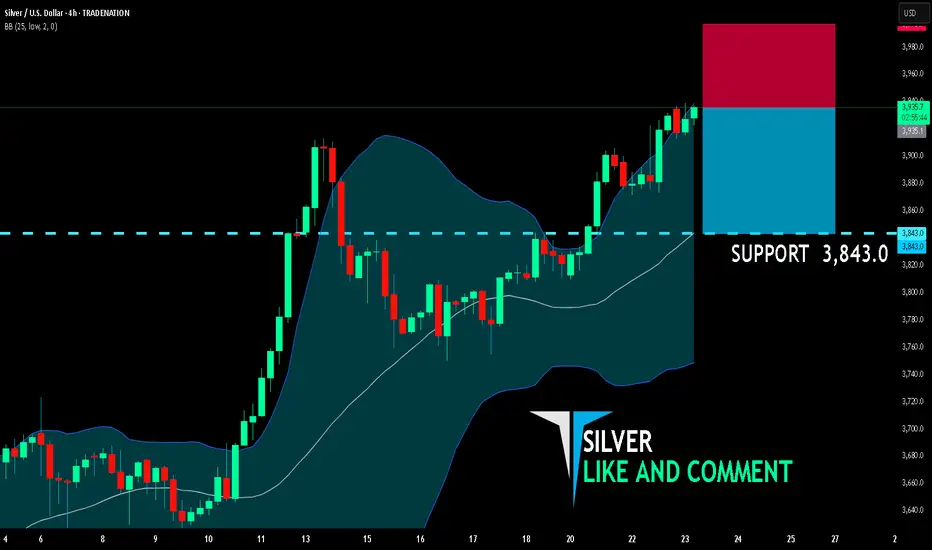
SILVER BEARS ARE GAINING STRENGTH|SHORT
SILVER SIGNAL
Trade Direction: short
Entry Level: 3,935.1
Target Level: 3,843.0
Stop Loss: 3,996.7
RISK PROFILE
Risk level: medium
Suggested risk: 1%
Timeframe: 4h
Disclosure: I am part of Trade Nation's Influencer program and receive a monthly fee for using their TradingView charts in my analysis.
✅LIKE AND COMMENT MY IDEAS✅
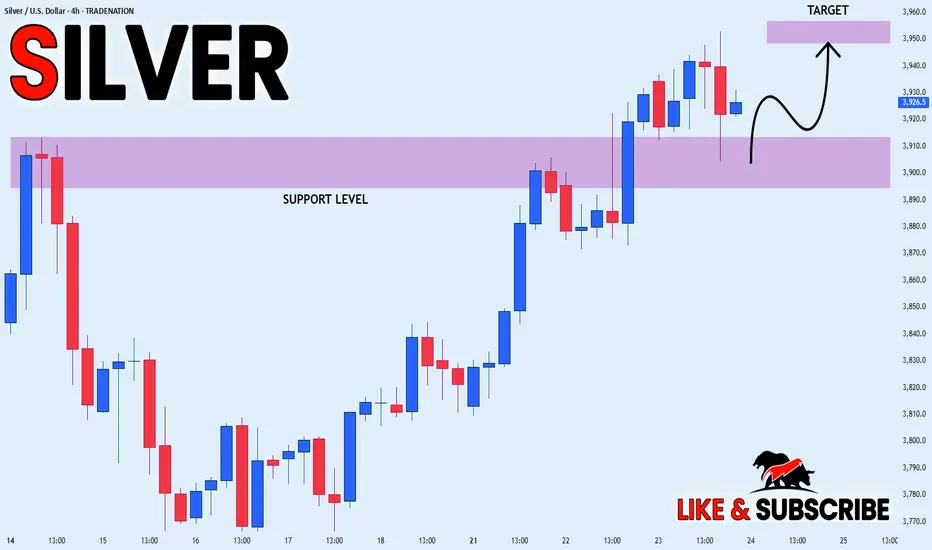
XAGUSD Holding Trendline With Support From Key Demand Zones📈 XAGUSD Holding Trendline Support, Eyes on Breakout
Silver continues to trade within a strong bullish structure, holding above a rising trendline and building pressure near recent highs. With support clearly defined and momentum intact, bulls are eyeing a potential breakout continuation. This update outlines the trend context, support zones, and fundamental backdrop.
🔍 Technical Analysis:
XAGUSD is respecting a steep ascending trendline from mid-June, holding structure despite multiple retests. Price recently bounced cleanly from trend support and is now pushing toward prior highs.
The bullish trend remains valid as long as this structure is defended. A close above recent resistance could unlock further upside potential.
🛡️ Support Zones (if pullback occurs):
🟢 Daily Support – Good Entry
Clearly respected zone labeled on your chart. Strong daily demand.
🟡 Weekly Support – Great Entry
Macro support area from prior consolidation. Viewed as a strong swing entry zone.
🔼 Resistance Zone:
🔴 Local High / Recent Resistance
No breakout yet — bulls must reclaim this zone to confirm continuation.
🧭 Outlook:
Bullish Case:
Holding the rising trendline + reclaiming highs would likely trigger further upside movement.
Bearish Case:
Break of the trendline + loss of daily support would open the door to deeper correction.
Bias:
Bullish while structure holds and daily/weekly support levels remain intact.
🌍 Fundamental Insight:
Silver is benefiting from firm industrial demand and a softening U.S. Dollar. Inflation hedging and ETF inflows also continue to support the bullish case. However, upcoming Fed commentary and CPI releases may trigger volatility, especially near resistance.
✅ Conclusion:
XAGUSD is maintaining its bullish trend, supported by well-defined daily and weekly demand zones. As long as the ascending trendline holds, the momentum favors further upside. Bears only take control if structure breaks and demand zones fail.
Not financial advice. Like & follow for more structured market updates.

Silver H4 | Falling toward a pullback supportSilver (XAG/USD) is falling towards a pullback support and could potentially bounce off this level to climb higher.
Buy entry is at 38.37 which is a pullback support that aligns with the 50% Fibonacci retracement.
Stop loss is at 37.40 which is a level that lies underneath a multi-swing-low support.
Take profit is at 40.12 which is a resistance that aligns with the 161.8% Fibonacci extension.
High Risk Investment Warning
Trading Forex/CFDs on margin carries a high level of risk and may not be suitable for all investors. Leverage can work against you.
Stratos Markets Limited (tradu.com ):
CFDs are complex instruments and come with a high risk of losing money rapidly due to leverage. 66% of retail investor accounts lose money when trading CFDs with this provider. You should consider whether you understand how CFDs work and whether you can afford to take the high risk of losing your money.
Stratos Europe Ltd (tradu.com ):
CFDs are complex instruments and come with a high risk of losing money rapidly due to leverage. 66% of retail investor accounts lose money when trading CFDs with this provider. You should consider whether you understand how CFDs work and whether you can afford to take the high risk of losing your money.
Stratos Global LLC (tradu.com ):
Losses can exceed deposits.
Please be advised that the information presented on TradingView is provided to Tradu (‘Company’, ‘we’) by a third-party provider (‘TFA Global Pte Ltd’). Please be reminded that you are solely responsible for the trading decisions on your account. There is a very high degree of risk involved in trading. Any information and/or content is intended entirely for research, educational and informational purposes only and does not constitute investment or consultation advice or investment strategy. The information is not tailored to the investment needs of any specific person and therefore does not involve a consideration of any of the investment objectives, financial situation or needs of any viewer that may receive it. Kindly also note that past performance is not a reliable indicator of future results. Actual results may differ materially from those anticipated in forward-looking or past performance statements. We assume no liability as to the accuracy or completeness of any of the information and/or content provided herein and the Company cannot be held responsible for any omission, mistake nor for any loss or damage including without limitation to any loss of profit which may arise from reliance on any information supplied by TFA Global Pte Ltd.
The speaker(s) is neither an employee, agent nor representative of Tradu and is therefore acting independently. The opinions given are their own, constitute general market commentary, and do not constitute the opinion or advice of Tradu or any form of personal or investment advice. Tradu neither endorses nor guarantees offerings of third-party speakers, nor is Tradu responsible for the content, veracity or opinions of third-party speakers, presenters or participants.

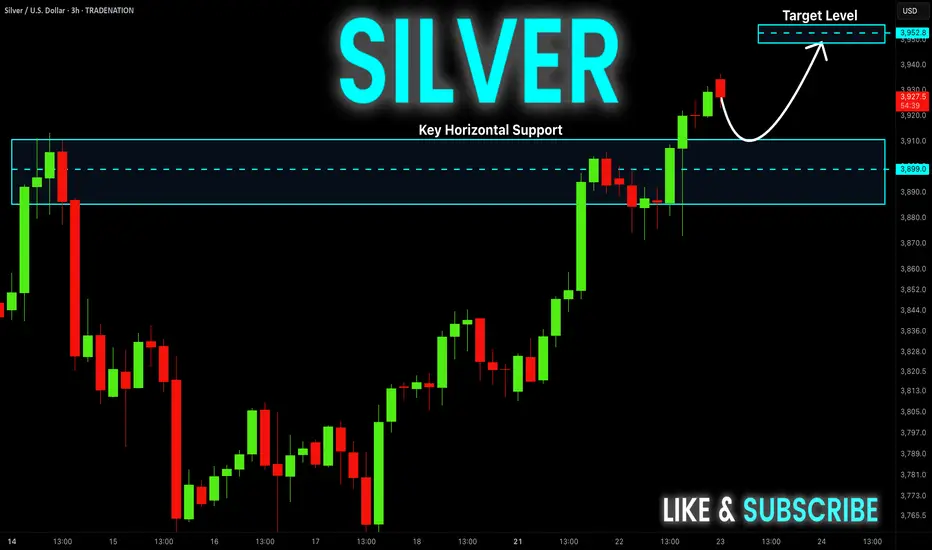
SILVER Bullish Breakout! Buy!
Hello,Traders!
SILVER is trading in a strong
Uptrend and the price made a
Bullish breakout of the key
Horizontal level of 39.10$
So we are bullish biased
And we will be expecting a
Further bullish move up
Buy!
Comment and subscribe to help us grow!
Check out other forecasts below too!
Disclosure: I am part of Trade Nation's Influencer program and receive a monthly fee for using their TradingView charts in my analysis.
Silver Wave Analysis – 22 July 2025
- Silver broke resistance level 39.00
- Likely to rise to resistance level 40.00
Silver recently broke the resistance level 39.00, which stopped the previous impulse wave i earlier this month, as can be seen from the daily Silver chart below.
The breakout of the resistance level 39.00 should accelerate the active impulse waves 5 and (C).
Given the clear daily uptrend, Silver can be expected to rise to the next resistance level 40.00, target price for the completion of the active impulse wave iii.