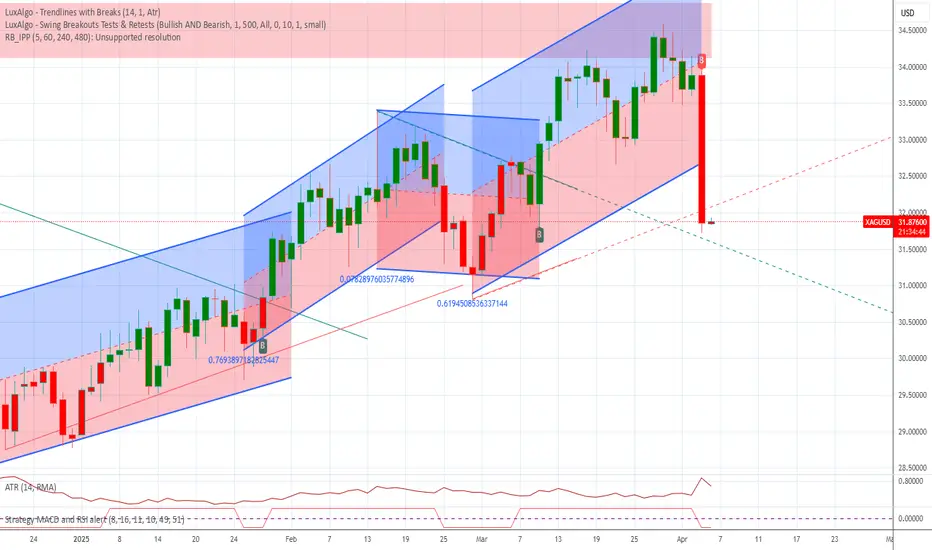
XAG USD SHORT RESULT After price missed my previous setup, I then decided to reenter at my Resistance zone a feq hours before the news and price moved even better than I anticipated the breakdown of the falling channel on Silver.
_THE_KLASSIC_TRADER_.
SILVER trade ideas
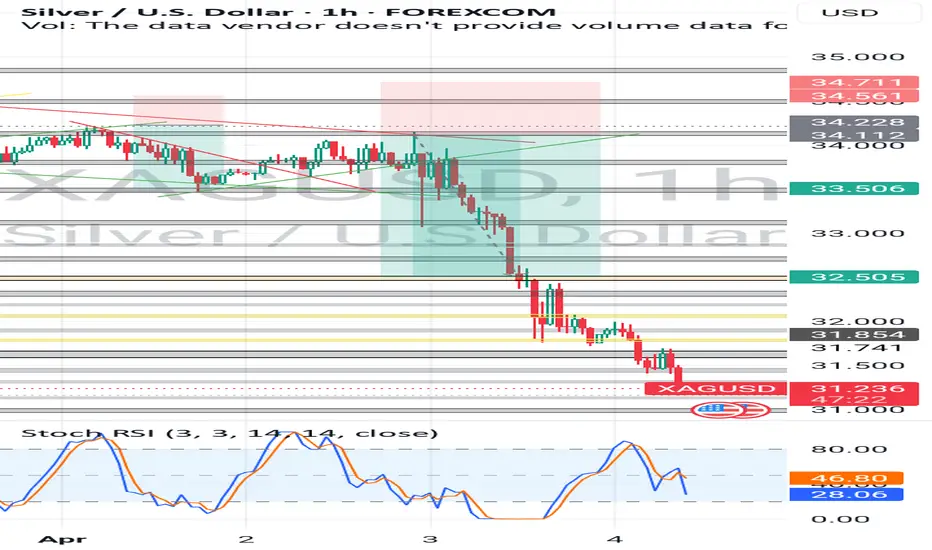
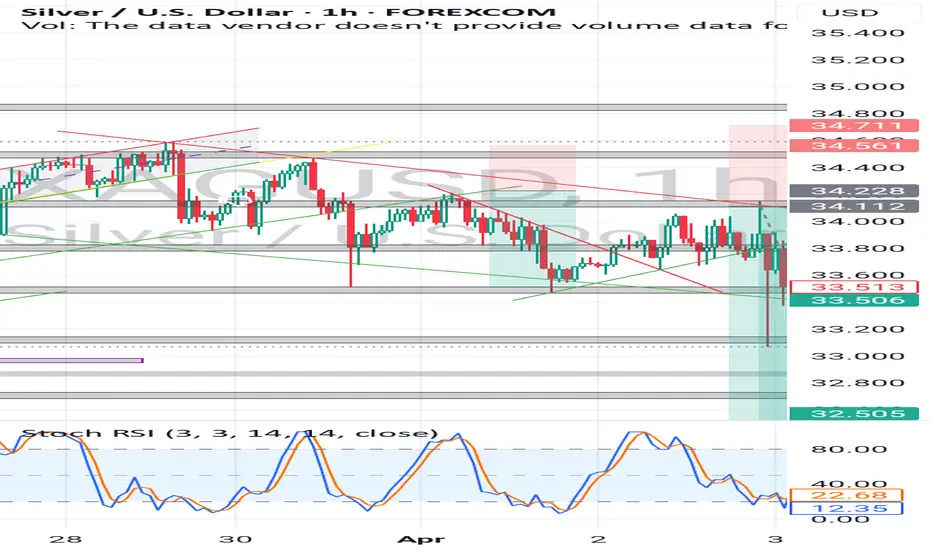
XAG USD SHORT Silver price was trading inside a falling channel before the major dump after the trump Tarrifs news.
Which I set a short from the wicks of the previous zone, though price moved down as expected, it missed my entry price
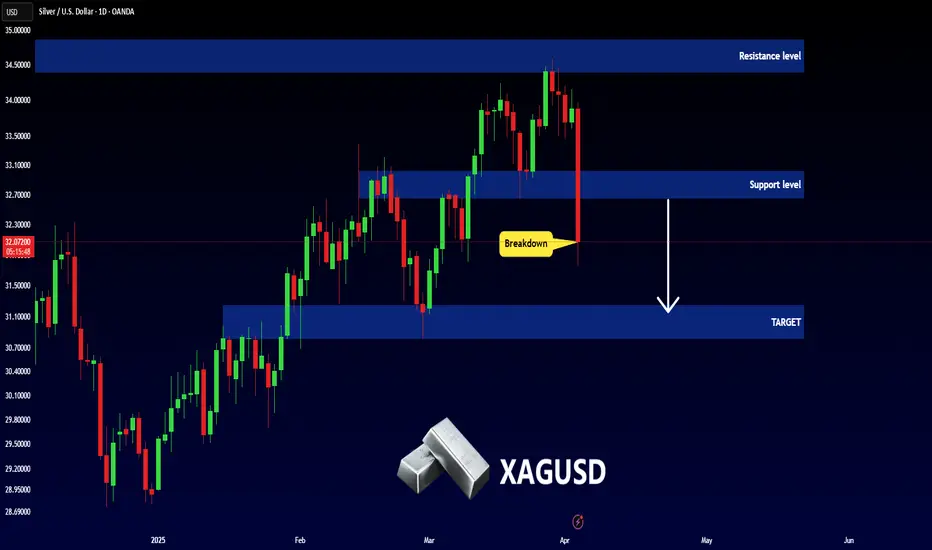
SILVER - Important BreakdownHello Traders !
On Thursday 27 Mar, The Silver reached the resistance level (34.40000 - 34.86000).
Currently, The support level (32.65 - 33.0) is broken !
So, I expect a bearish move📉
________________
TARGET: 31.24000
Previous Analysis:
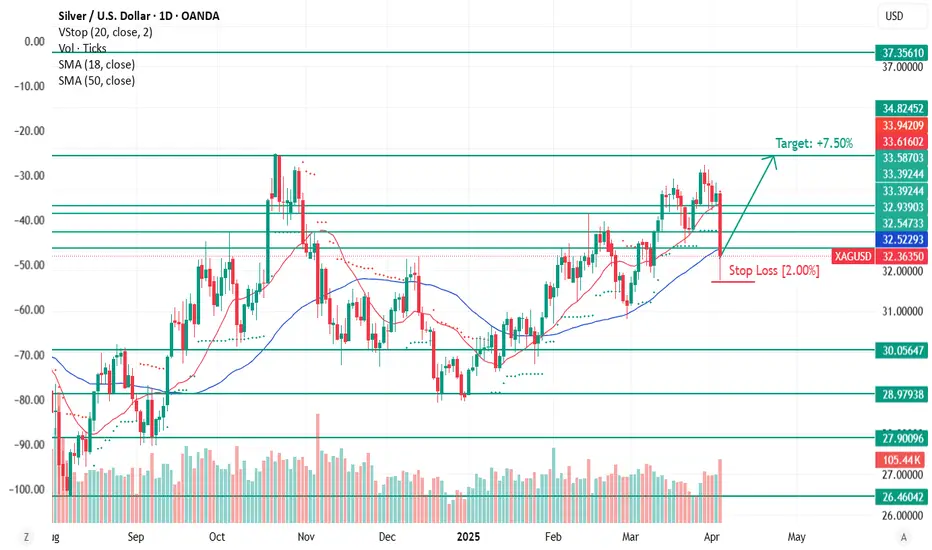
Buy SilverAs long as there is no break in the uptrend on the daily chart, a long position can be attempted from the current level with a target of the previous highs at 34.80-35.00
Since the trade is taking place during a period of high volatility and the entry is not the most stable, it is better to trade with a stop-loss, adjusting it throughout the day as the price moves up.
The first stop is at 31.70. Then, if 32.50 is broken, move it to 32.10, and so on.
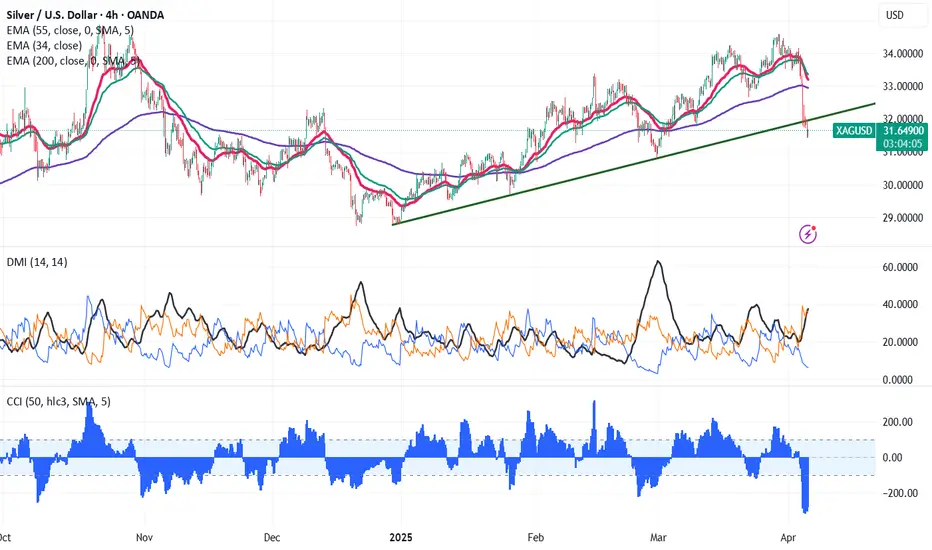
Silver- sell on rallies (breaks major trend line support)
Trend line support- $31.95 (trend line joining $28.79 and $30.81)
Silver crashed more than 7% after Tariff announcement. It hit a intraday low of $31.40 and is currently trading around $31.65.
The gold/silver ratio climbed to 95.50, reflecting silver's relative weakness compared to gold.
Trading Strategy and Key Levels for Silver
The commodity is trading below short term (34 and 55 EMA) and long-term moving average (200- EMA) in the 4-hour chart. The near-term support is around $31.25 and any violation below will drag the commodity to $30.75/$30/$29.60/$29/$28.40. The immediate resistance is at $32.60 any breach above targets $33/$35/$36.
It is good to sell on rallies around $32 with a stop-loss at $32.60 for a TP of $30/$28.40.
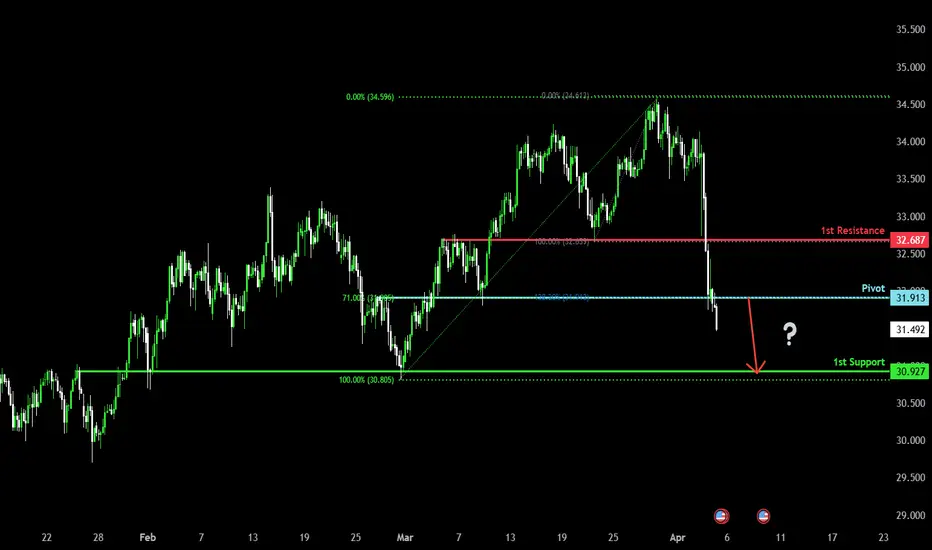
Bearish drop?The Silver (XAG/USD) has reacted off the pivot and could drop to the 1st support.
Pivot: 31.91
1st Support: 30.92
1st Resistance: 32.68
Risk Warning:
Trading Forex and CFDs carries a high level of risk to your capital and you should only trade with money you can afford to lose. Trading Forex and CFDs may not be suitable for all investors, so please ensure that you fully understand the risks involved and seek independent advice if necessary.
Disclaimer:
The above opinions given constitute general market commentary, and do not constitute the opinion or advice of IC Markets or any form of personal or investment advice.
Any opinions, news, research, analyses, prices, other information, or links to third-party sites contained on this website are provided on an "as-is" basis, are intended only to be informative, is not an advice nor a recommendation, nor research, or a record of our trading prices, or an offer of, or solicitation for a transaction in any financial instrument and thus should not be treated as such. The information provided does not involve any specific investment objectives, financial situation and needs of any specific person who may receive it. Please be aware, that past performance is not a reliable indicator of future performance and/or results. Past Performance or Forward-looking scenarios based upon the reasonable beliefs of the third-party provider are not a guarantee of future performance. Actual results may differ materially from those anticipated in forward-looking or past performance statements. IC Markets makes no representation or warranty and assumes no liability as to the accuracy or completeness of the information provided, nor any loss arising from any investment based on a recommendation, forecast or any information supplied by any third-party.
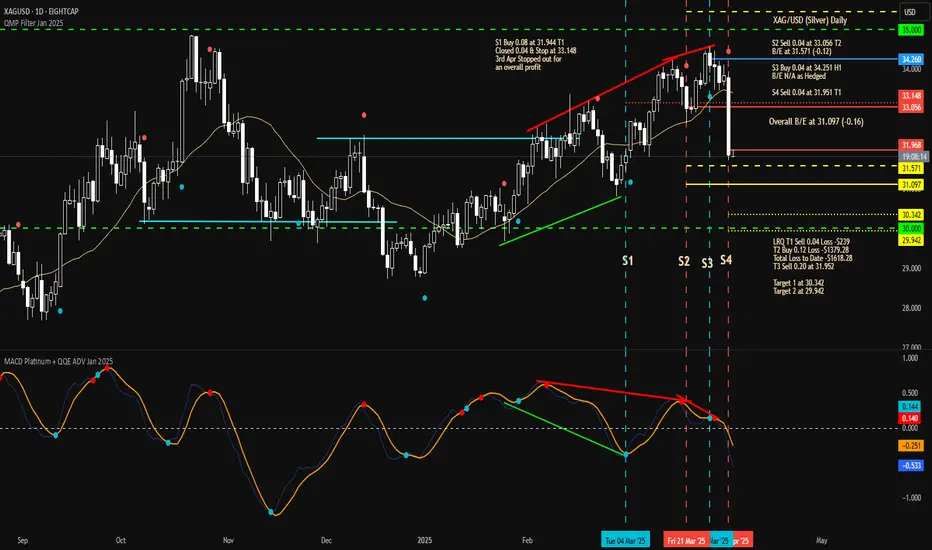
Fri 4th Apr 2025 XAG/USD Daily Forex Chart Sell SetupGood morning fellow traders. On my Daily Forex charts using the High Probability & Divergence trading methods from my books, I have identified a new trade setup this morning. As usual, you can read my notes on the chart for my thoughts on this setup. The trade being a XAG/USD Sell. Enjoy the day all. Cheers. Jim
Silver ShortSilver is now net Short on the regression break.
Roll short on Silver is 0.4% per a month.
I am not taking this trade.
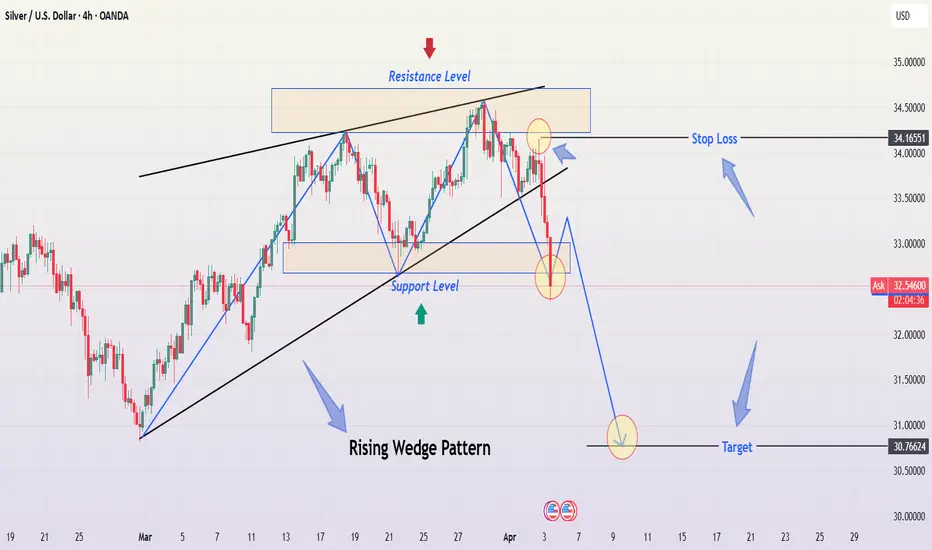
Silver Breakdown: Rising Wedge Bearish Move Towards Target1. Chart Overview
This 4-hour (H4) chart of Silver (XAG/USD) shows a clear Rising Wedge Pattern, a bearish technical formation. The price action recently broke below the lower support trendline, confirming a downside move. Several key levels, indicators, and trading strategies can be derived from this setup.
2. Identified Chart Pattern: Rising Wedge (Bearish Reversal)
A Rising Wedge is a pattern that forms when price consolidates between two upward-sloping trendlines, with the support line rising at a steeper angle than the resistance line. This pattern is considered bearish because it signals weakening buying pressure and an impending breakdown.
Uptrend Formation: The price had been moving within a wedge, forming higher highs and higher lows.
Volume Considerations: A wedge breakout is often accompanied by increasing volume, further confirming the trend shift.
Breakout Confirmation: The price has decisively broken below the lower boundary of the wedge, indicating that sellers are taking control.
3. Key Technical Levels & Trading Strategy
Resistance Level (Rejection Zone) – $34.00 - $34.50
The upper boundary of the rising wedge acted as strong resistance.
Multiple price rejections confirm sellers' dominance in this area.
Any future retest of this level may provide a new opportunity for short entries.
Support Level (Broken & Retested) – $32.50 - $32.80
This zone previously acted as strong support, preventing price from falling lower.
Now that price has broken this support level, it could act as resistance if a retest occurs.
A confirmed rejection here will further validate the bearish outlook.
Stop Loss Placement – $34.16
A logical stop-loss placement is slightly above the previous swing high and resistance area.
If price moves above this level, it would indicate that the breakdown has failed, invalidating the bearish setup.
Bearish Target – $30.76 (Measured Move Projection)
This level is derived from the height of the rising wedge pattern projected downward.
The area around $30.76 aligns with a previous support zone, making it a reasonable target for the current breakdown.
4. Price Action & Future Expectations
Current Market Sentiment: Bearish
The break below the wedge confirms a bearish sentiment.
A slight retracement to the previous support (now resistance) around $32.80 - $33.00 is possible before further downside.
If selling pressure remains strong, Silver is likely to reach the $30.76 target in the coming sessions.
Alternative Scenario: Bullish Recovery
If the price moves back above $34.16, the bearish outlook is invalidated.
A sustained move above this level could indicate a false breakdown and may push Silver toward new highs.
5. Trading Plan Based on This Setup
🔹 Entry Strategy:
Look for a retest of the broken support zone ($32.80 - $33.00) to enter short positions.
A rejection from this level with bearish confirmation (e.g., a bearish engulfing candle) strengthens the trade setup.
🔹 Stop Loss:
Placed above the wedge resistance at $34.16 to protect against false breakouts.
🔹 Take Profit Targets:
First Target: $31.50 (intermediate support level)
Final Target: $30.76 (measured move projection of the wedge)
6. Conclusion
This Rising Wedge Breakdown on Silver’s H4 chart presents a strong bearish trading opportunity with a well-defined risk-reward ratio. The break below key support signals continued downside, with $30.76 as the next major target. However, traders should monitor any retest of the broken support zone to confirm further selling momentum before entering new positions.
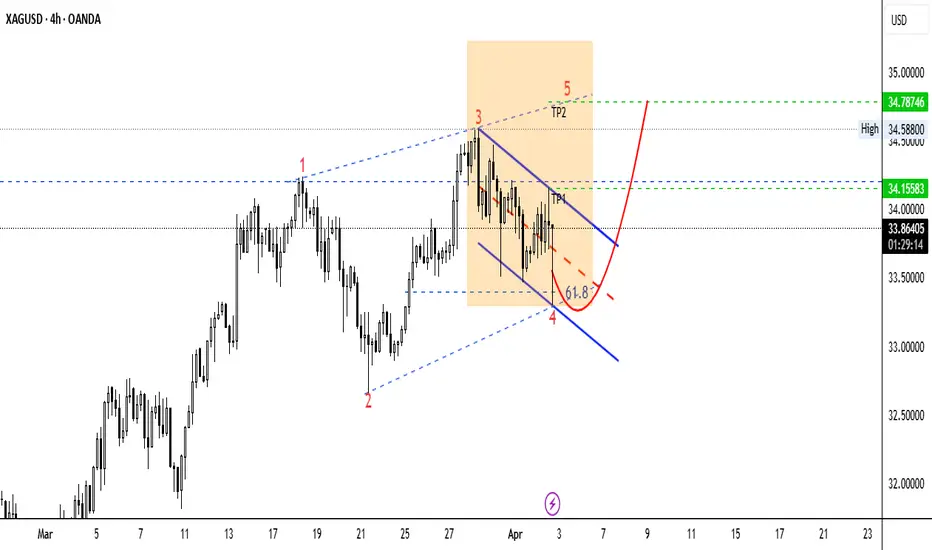
Silver H4 | Overlap support at 50% Fibonacci retracementSilver (XAG/USD) is falling towards an overlap support and could potentially bounce off this level to climb higher.
Buy entry is at 32.69 which is an overlap support that aligns with the 50.0% Fibonacci retracement.
Stop loss is at 31.70 which is a level that lies underneath a swing-low support.
Take profit is at 34.02 which is a swing-high resistance.
High Risk Investment Warning
Trading Forex/CFDs on margin carries a high level of risk and may not be suitable for all investors. Leverage can work against you.
Stratos Markets Limited (www.fxcm.com):
CFDs are complex instruments and come with a high risk of losing money rapidly due to leverage. 63% of retail investor accounts lose money when trading CFDs with this provider. You should consider whether you understand how CFDs work and whether you can afford to take the high risk of losing your money.
Stratos Europe Ltd (www.fxcm.com):
CFDs are complex instruments and come with a high risk of losing money rapidly due to leverage. 63% of retail investor accounts lose money when trading CFDs with this provider. You should consider whether you understand how CFDs work and whether you can afford to take the high risk of losing your money.
Stratos Trading Pty. Limited (www.fxcm.com):
Trading FX/CFDs carries significant risks. FXCM AU (AFSL 309763), please read the Financial Services Guide, Product Disclosure Statement, Target Market Determination and Terms of Business at www.fxcm.com
Stratos Global LLC (www.fxcm.com):
Losses can exceed deposits.
Please be advised that the information presented on TradingView is provided to FXCM (‘Company’, ‘we’) by a third-party provider (‘TFA Global Pte Ltd’). Please be reminded that you are solely responsible for the trading decisions on your account. There is a very high degree of risk involved in trading. Any information and/or content is intended entirely for research, educational and informational purposes only and does not constitute investment or consultation advice or investment strategy. The information is not tailored to the investment needs of any specific person and therefore does not involve a consideration of any of the investment objectives, financial situation or needs of any viewer that may receive it. Kindly also note that past performance is not a reliable indicator of future results. Actual results may differ materially from those anticipated in forward-looking or past performance statements. We assume no liability as to the accuracy or completeness of any of the information and/or content provided herein and the Company cannot be held responsible for any omission, mistake nor for any loss or damage including without limitation to any loss of profit which may arise from reliance on any information supplied by TFA Global Pte Ltd.
The speaker(s) is neither an employee, agent nor representative of FXCM and is therefore acting independently. The opinions given are their own, constitute general market commentary, and do not constitute the opinion or advice of FXCM or any form of personal or investment advice. FXCM neither endorses nor guarantees offerings of third-party speakers, nor is FXCM responsible for the content, veracity or opinions of third-party speakers, presenters or participants.

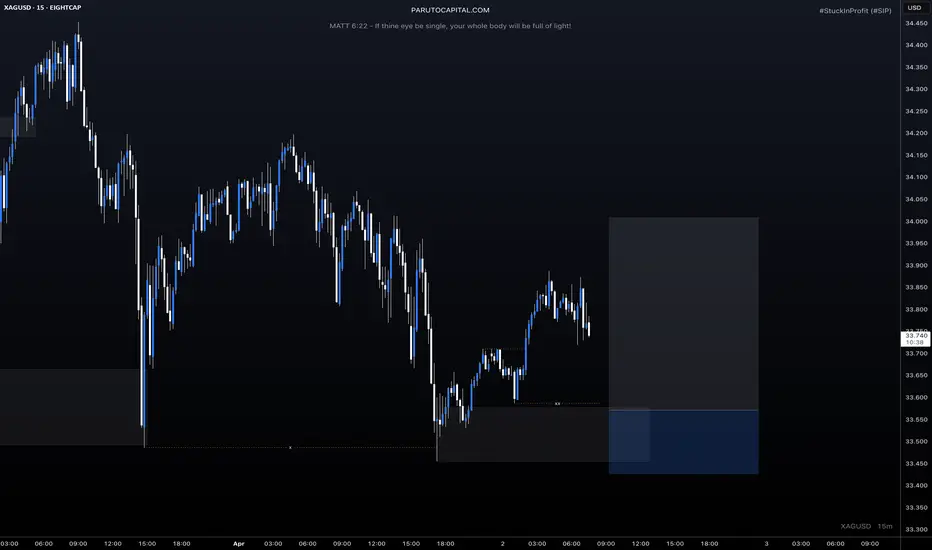
Silver (XAGUSD) – Watching for a bounce from this key supportPrice is sitting right inside a strong demand area, and I’m watching to see if we can get a reaction back toward 33.58.

XAGUSDSilver right now giving a new upward impulse, possible formation of a final diagonal and then making a much larger correction.
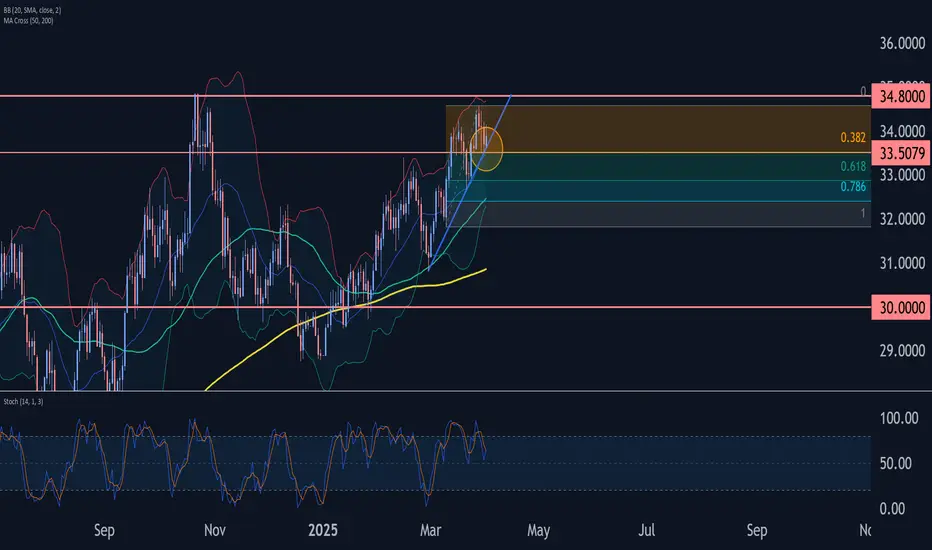
Silver Golden butterflyThe silver butterfly's decline from the 34.57 level is being observed as a golden Fibonacci level. This particular point holds significance for analysts and enthusiasts who closely monitor Fibonacci retracement levels in various contexts, whether in nature, art, or even financial markets.
It’s fascinating how these mathematical patterns appear in diverse areas, sparking curiosity and deeper exploration.
SEYED.

XAGUSD potential bullish biasThis XAGUSD potential bullish bias is likely to play out in a few hours.
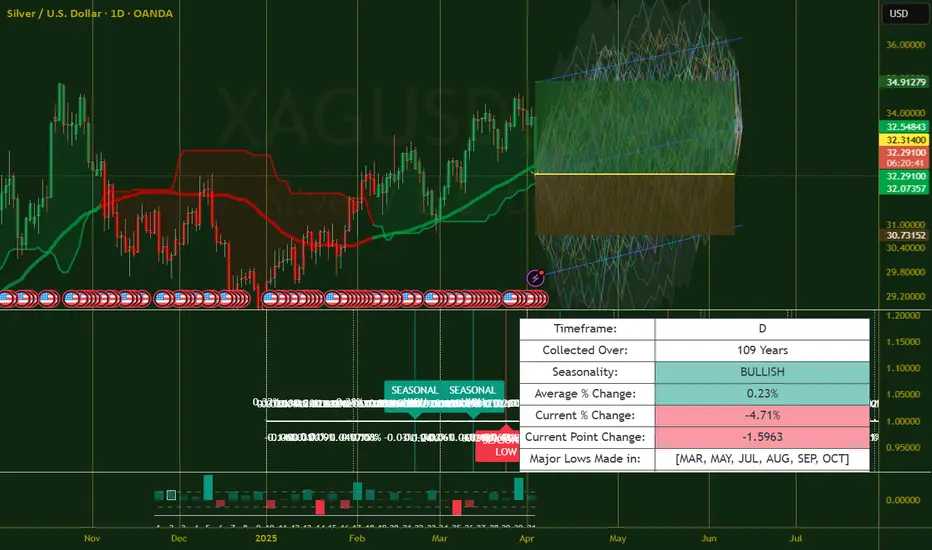
Silver Wave Analysis – 2 April 2025- Silver reversed from the support area
- Likely to rise to the resistance level 34.50
Silver recently reversed up from the support zone between the support level 33.50 (former monthly high from February), 20-day moving average, support trendline from February and the 50% Fibonacci correction of the upward impulse from March.
The upward reversal from this support area continues the active impulse waves iii, 3 and (C) – inside which Silver has been moving since December.
Given the strong daily uptrend, Silver can be expected to rise to the next resistance level 34.50 (the former monthly high from last month).