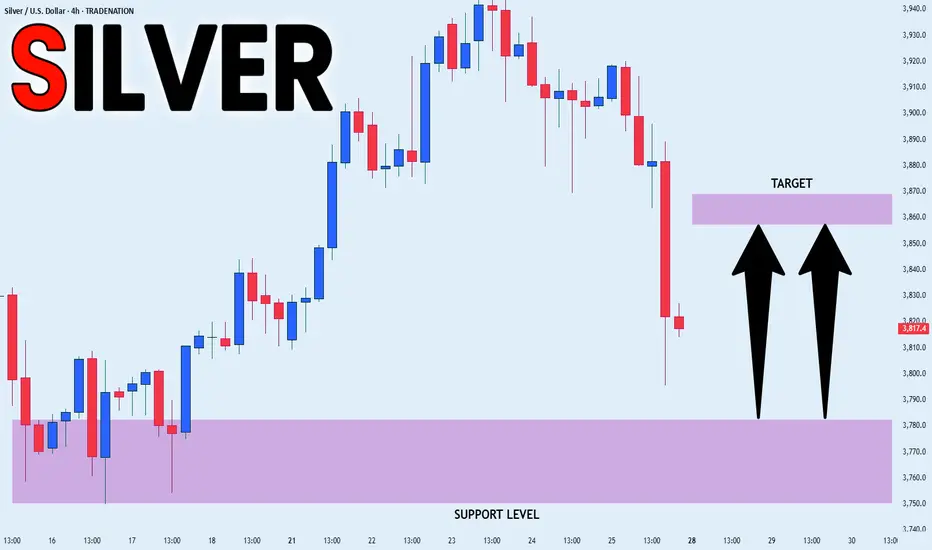
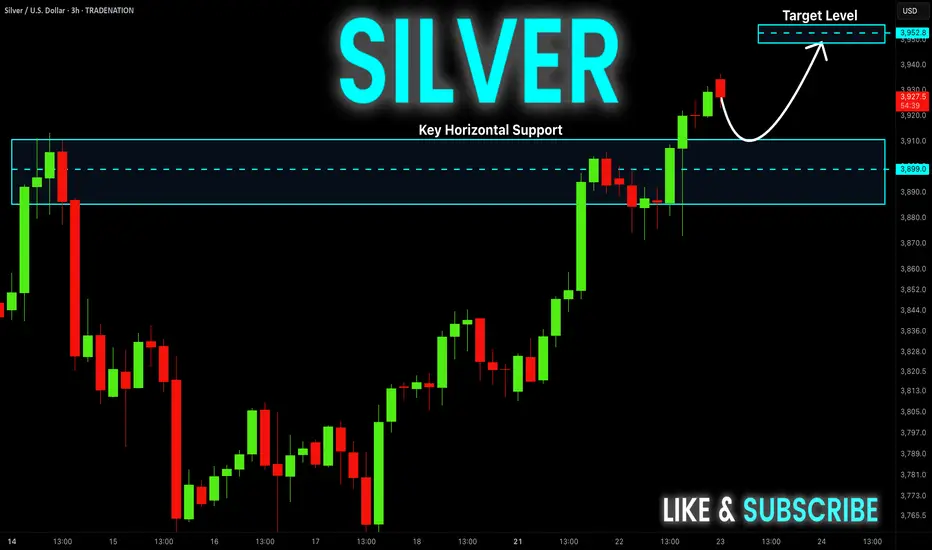
SILVER SUPPORT AHEAD|LONG|
✅SILVER has been falling recently
And Silver seems locally oversold
So as the pair is approaching
A horizontal support of 37.80$
Price growth is to be expected
LONG🚀
✅Like and subscribe to never miss a new idea!✅
Disclosure: I am part of Trade Nation's Influencer program and receive a monthly fee for using their TradingView charts in my analysis.
SILVERCFD trade ideas
SILVER: Expecting Bullish Continuation! Here is Why:
The charts are full of distraction, disturbance and are a graveyard of fear and greed which shall not cloud our judgement on the current state of affairs in the SILVER pair price action which suggests a high likelihood of a coming move up.
Disclosure: I am part of Trade Nation's Influencer program and receive a monthly fee for using their TradingView charts in my analysis.
❤️ Please, support our work with like & comment! ❤️

SILVER: The Market Is Looking Down! Short!
My dear friends,
Today we will analyse SILVER together☺️
The recent price action suggests a shift in mid-term momentum. A break below the current local range around 38.780 will confirm the new direction downwards with the target being the next key level of 38.635.and a reconvened placement of a stop-loss beyond the range.
❤️Sending you lots of Love and Hugs❤️

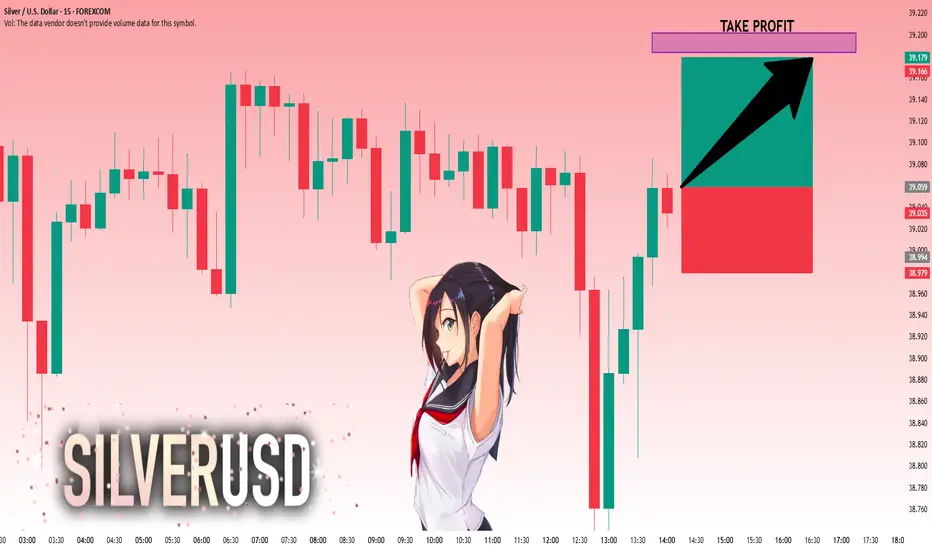
SILVER: Bulls Are Winning! Long!
My dear friends,
Today we will analyse SILVER together☺️
The market is at an inflection zone and price has now reached an area around 39.025 where previous reversals or breakouts have occurred.And a price reaction that we are seeing on multiple timeframes here could signal the next move up so we can enter on confirmation, and target the next key level of 39.148.Stop-loss is recommended beyond the inflection zone.
❤️Sending you lots of Love and Hugs❤️
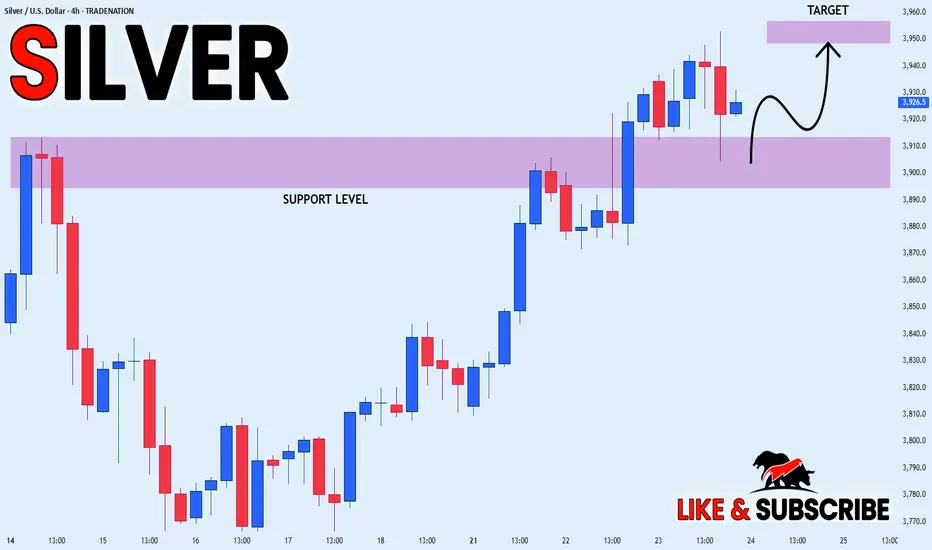
SILVER WILL KEEP GROWING|LONG|
✅SILVER is trading in an
Uptrend and the price made
A retest of the horizontal support
Level of 39.10$ and we are already
Seeing a bullish reaction so we
Are bullish biased and we will be
Expecting a further bullish move up
LONG🚀
✅Like and subscribe to never miss a new idea!✅
Disclosure: I am part of Trade Nation's Influencer program and receive a monthly fee for using their TradingView charts in my analysis.

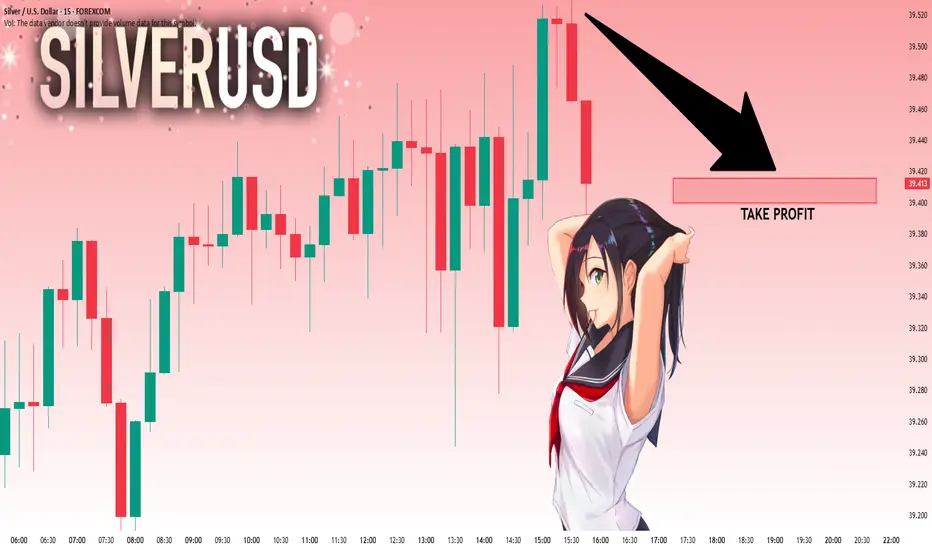
SILVER: Will Go Down! Short!
My dear friends,
Today we will analyse SILVER together☺️
The price is near a wide key level
and the pair is approaching a significant decision level of 39.520 Therefore, a strong bearish reaction here could determine the next move down.We will watch for a confirmation candle, and then target the next key level of 39.416..Recommend Stop-loss is beyond the current level.
❤️Sending you lots of Love and Hugs❤️
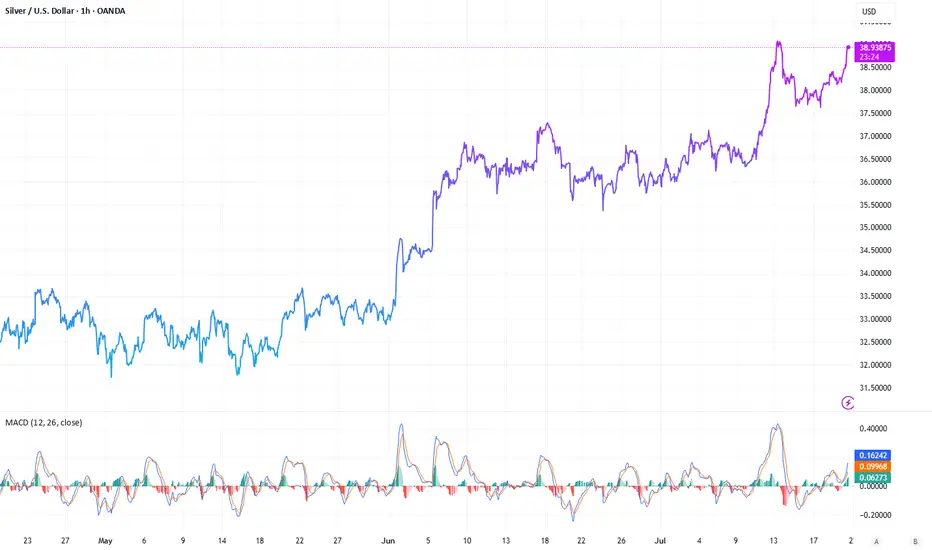
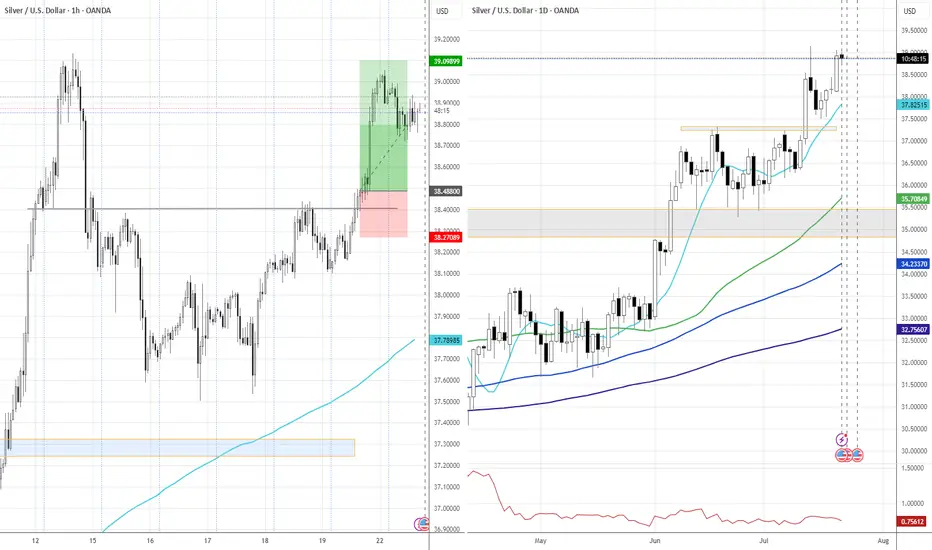
Silver Stays Strong on China Growth HopesSilver remained firm around $38.90 per ounce, holding near its highest levels since 2010. A weaker dollar and lower U.S. yields underpinned the metal, while traders await Fed Chair Powell’s comments and trade updates ahead of the August 1 deadline. China’s pledge to boost industrial growth also added to silver’s positive outlook.
Resistance is at $39.50, with support at $37.40.
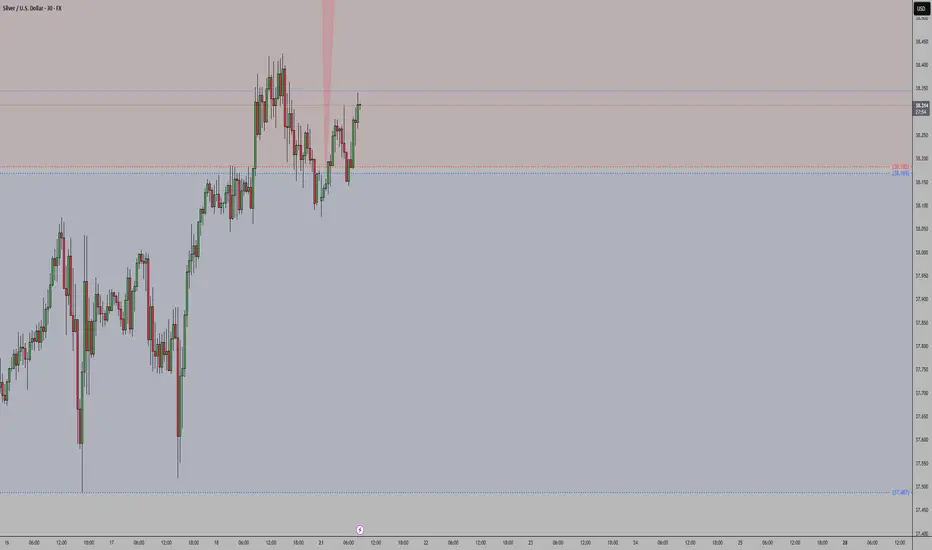
XAG USD SHORT RESULT Silver price was in a broadening falling wedge which is a bullish pattern, but still took a quick short scalp trade from the set supply zone to the next Order Block and it moved just as Predicted
_THE_KLASSIC_TRADER_.
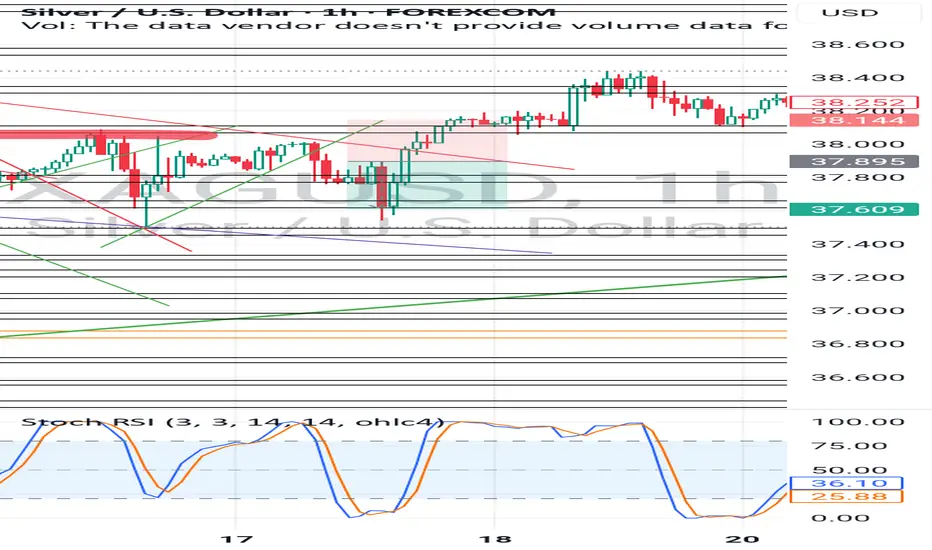
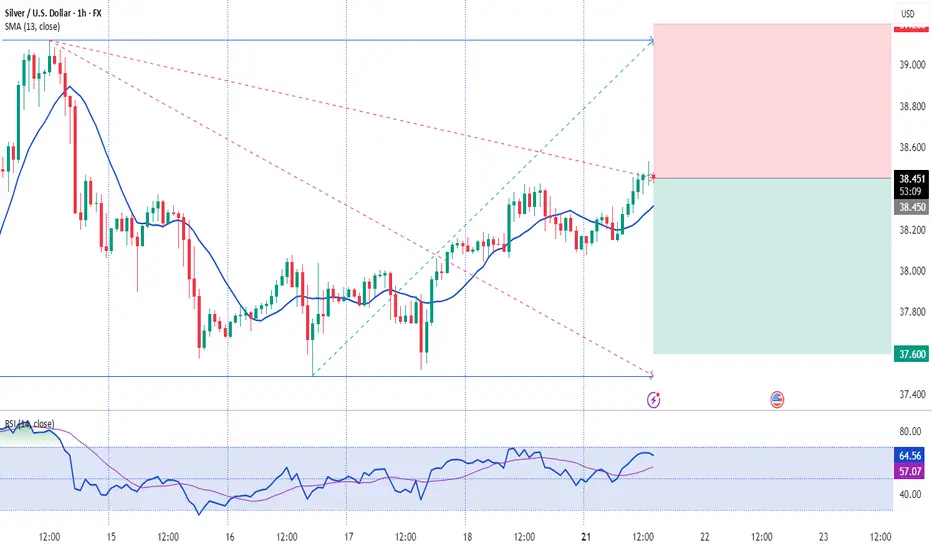
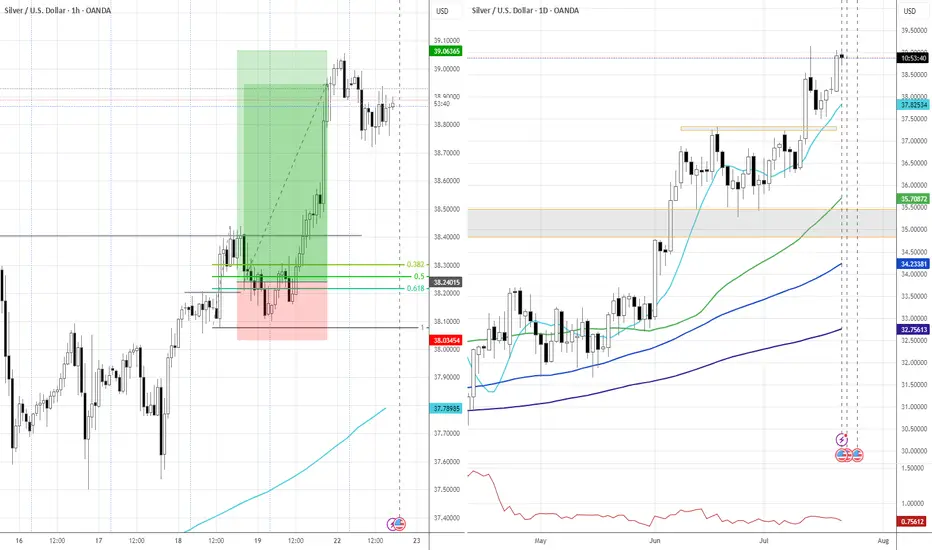
Silver H4 | Falling toward a pullback supportSilver (XAG/USD) is falling towards a pullback support and could potentially bounce off this level to climb higher.
Buy entry is at 38.37 which is a pullback support that aligns with the 50% Fibonacci retracement.
Stop loss is at 37.40 which is a level that lies underneath a multi-swing-low support.
Take profit is at 40.12 which is a resistance that aligns with the 161.8% Fibonacci extension.
High Risk Investment Warning
Trading Forex/CFDs on margin carries a high level of risk and may not be suitable for all investors. Leverage can work against you.
Stratos Markets Limited (tradu.com ):
CFDs are complex instruments and come with a high risk of losing money rapidly due to leverage. 66% of retail investor accounts lose money when trading CFDs with this provider. You should consider whether you understand how CFDs work and whether you can afford to take the high risk of losing your money.
Stratos Europe Ltd (tradu.com ):
CFDs are complex instruments and come with a high risk of losing money rapidly due to leverage. 66% of retail investor accounts lose money when trading CFDs with this provider. You should consider whether you understand how CFDs work and whether you can afford to take the high risk of losing your money.
Stratos Global LLC (tradu.com ):
Losses can exceed deposits.
Please be advised that the information presented on TradingView is provided to Tradu (‘Company’, ‘we’) by a third-party provider (‘TFA Global Pte Ltd’). Please be reminded that you are solely responsible for the trading decisions on your account. There is a very high degree of risk involved in trading. Any information and/or content is intended entirely for research, educational and informational purposes only and does not constitute investment or consultation advice or investment strategy. The information is not tailored to the investment needs of any specific person and therefore does not involve a consideration of any of the investment objectives, financial situation or needs of any viewer that may receive it. Kindly also note that past performance is not a reliable indicator of future results. Actual results may differ materially from those anticipated in forward-looking or past performance statements. We assume no liability as to the accuracy or completeness of any of the information and/or content provided herein and the Company cannot be held responsible for any omission, mistake nor for any loss or damage including without limitation to any loss of profit which may arise from reliance on any information supplied by TFA Global Pte Ltd.
The speaker(s) is neither an employee, agent nor representative of Tradu and is therefore acting independently. The opinions given are their own, constitute general market commentary, and do not constitute the opinion or advice of Tradu or any form of personal or investment advice. Tradu neither endorses nor guarantees offerings of third-party speakers, nor is Tradu responsible for the content, veracity or opinions of third-party speakers, presenters or participants.

SILVER Bullish Breakout! Buy!
Hello,Traders!
SILVER is trading in a strong
Uptrend and the price made a
Bullish breakout of the key
Horizontal level of 39.10$
So we are bullish biased
And we will be expecting a
Further bullish move up
Buy!
Comment and subscribe to help us grow!
Check out other forecasts below too!
Disclosure: I am part of Trade Nation's Influencer program and receive a monthly fee for using their TradingView charts in my analysis.
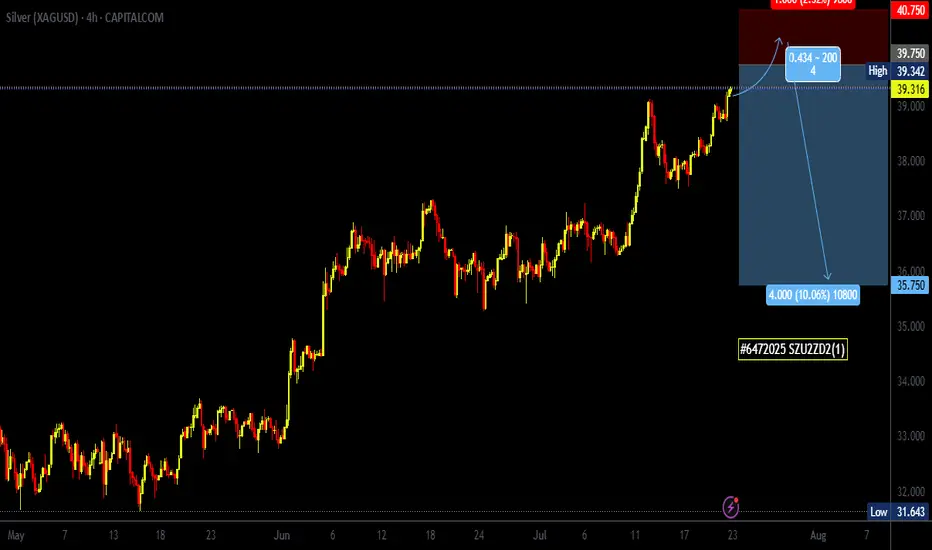
#6472025 | XAGUSD Selling opportunity 1:4XAGUSD Selling opportunity Appears in H4 Time Frame Looking Price Action for Long Term Sell
Risk and Reward Ratio is 1:4
After 50 pips Profit Set SL Entry Level
"DISCLAIMER" Trading & investing business is "Very Profitable" as well as risky, so any trading or investment decision should be made after Consultation with Certified & Regulated Investment Advisors, by Carefully Considering your Financial Situation.
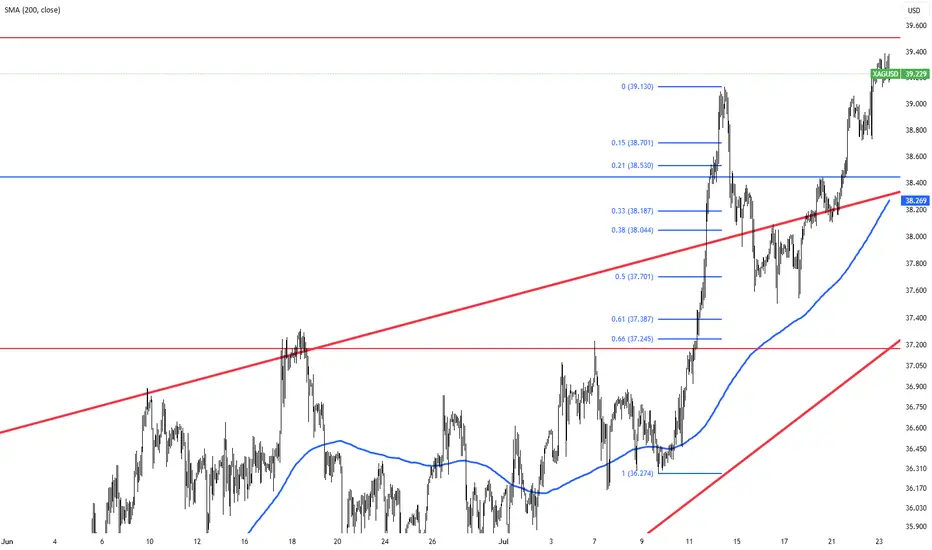
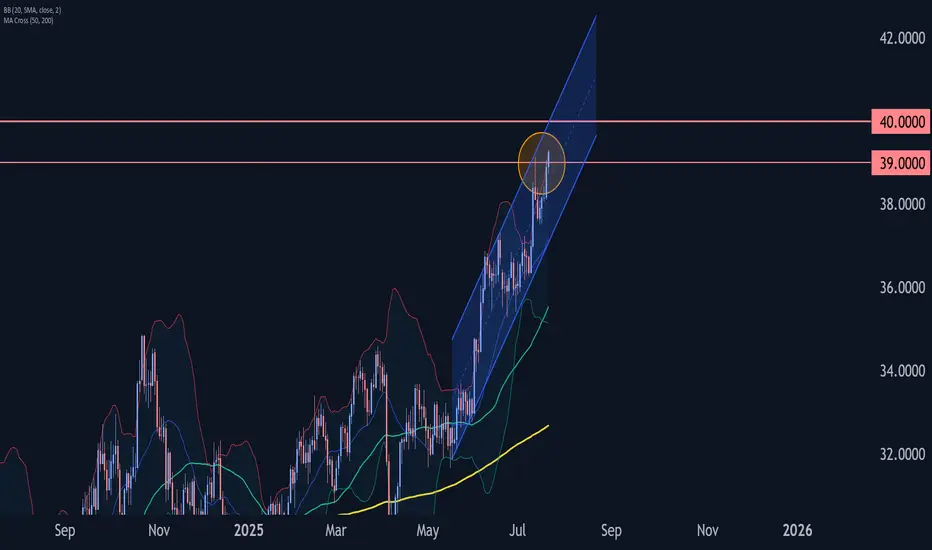
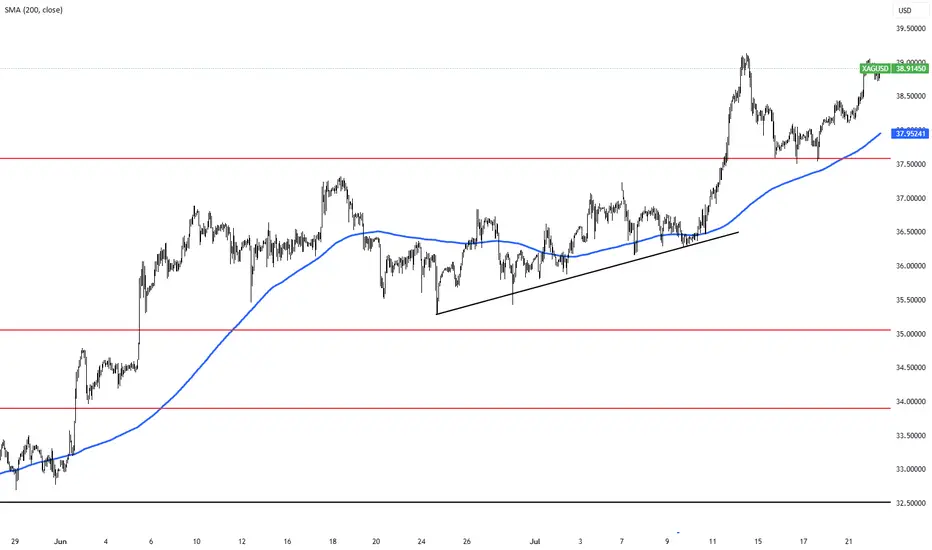
Silver Wave Analysis – 22 July 2025
- Silver broke resistance level 39.00
- Likely to rise to resistance level 40.00
Silver recently broke the resistance level 39.00, which stopped the previous impulse wave i earlier this month, as can be seen from the daily Silver chart below.
The breakout of the resistance level 39.00 should accelerate the active impulse waves 5 and (C).
Given the clear daily uptrend, Silver can be expected to rise to the next resistance level 40.00, target price for the completion of the active impulse wave iii.
XAGUSD, Elliott wave analysisOutlook for XAGUSD on 1W chart.
I think we are in sub-wave (3) of the wave (ⅲ).
Sub-wave (3) shown by Green-line will probably be an extension.
If the assumption is correct, the target for wave (3) will exceed 66.4.

SILVER: Next Move Is Up! Long!
My dear friends,
Today we will analyse SILVER together☺️
The price is near a wide key level
and the pair is approaching a significant decision level of 38.823 Therefore, a strong bullish reaction here could determine the next move up.We will watch for a confirmation candle, and then target the next key level of 38.872.Recommend Stop-loss is beyond the current level.
❤️Sending you lots of Love and Hugs❤️

XAGUSDCOT data shows a bullish shift in sentiment for silver (XAG/USD), with managed money increasing net long positions for the third consecutive week. This rising speculative interest signals growing confidence in silver's upside potential. Combined with a weakening USD and supportive macro trends, silver is well-positioned to break above the $30 resistance zone. Continued accumulation by institutional traders suggests momentum could carry XAG/USD toward the $33–$35 area in the coming weeks.
Silver Trades Above $38.3 Amid Safe-Haven Demand and Industrial NYSE:TVC : SILVER Silver is trading above $38.3, supported by safe-haven flows and resilience in industrial demand. The metal outpaces gold on the back of stronger relative momentum and inflation expectations.
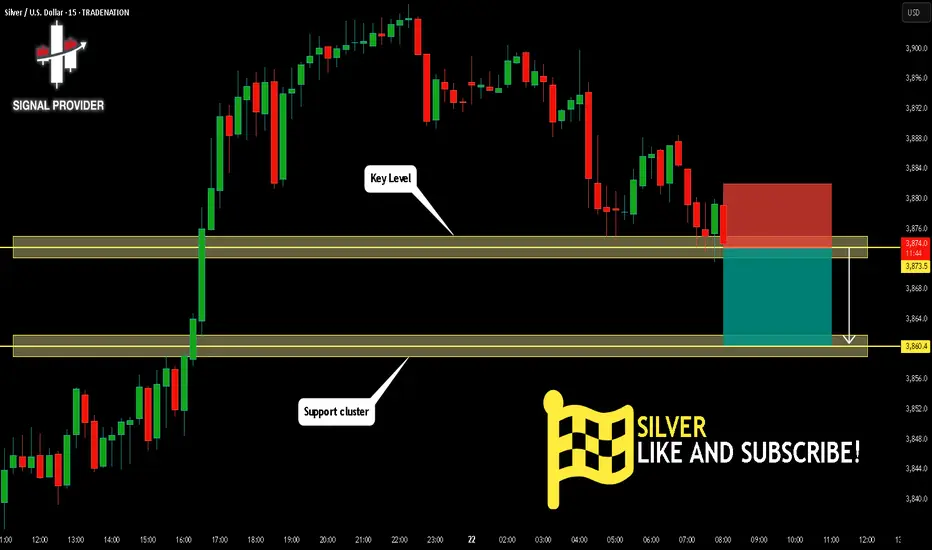
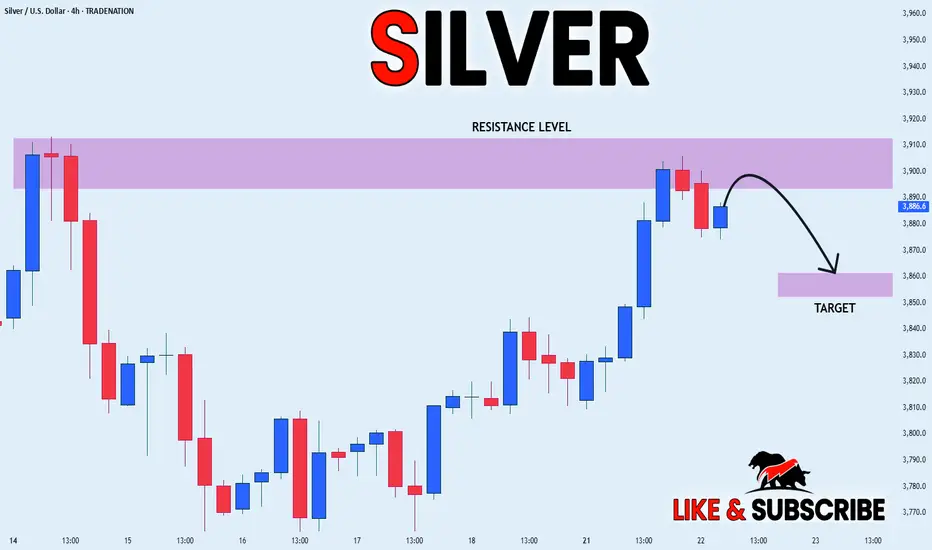
SILVER Is Going Down! Short!
Here is our detailed technical review for SILVER.
Time Frame: 15m
Current Trend: Bearish
Sentiment: Overbought (based on 7-period RSI)
Forecast: Bearish
The market is on a crucial zone of supply 3,873.5.
The above-mentioned technicals clearly indicate the dominance of sellers on the market. I recommend shorting the instrument, aiming at 3,860.4 level.
P.S
We determine oversold/overbought condition with RSI indicator.
When it drops below 30 - the market is considered to be oversold.
When it bounces above 70 - the market is considered to be overbought.
Disclosure: I am part of Trade Nation's Influencer program and receive a monthly fee for using their TradingView charts in my analysis.
Like and subscribe and comment my ideas if you enjoy them!
SILVER LOCAL SHORT|
✅SILVER has retested a key resistance level of 39.10$
And as the pair is already making a bearish pullback
A move down to retest the demand level below at 38.61$ is likely
SHORT🔥
✅Like and subscribe to never miss a new idea!✅
Disclosure: I am part of Trade Nation's Influencer program and receive a monthly fee for using their TradingView charts in my analysis.
Silver Market Recap: Q2 2025 HighlightsSilver prices hit a 14-year peak in Q2 of 25 due to global uncertainties and a tight supply-demand balance. Although it shares some similar drivers with gold, silver has carved its own path, which one charged by robust industrial demand and its safe-haven appeal amid economic and geopolitical turbulence.
Silver’s Price Journey
The quarter kicked off with a dip, silver fell from $33.77 per ounce on April 2 to $29.57 by April 4. But then, it quickly regained traction, crossing $30 by April 9 and peaking at $33.63 on April 23. May brought volatility, with prices swinging between $32.05 on May 2 and $33.46 on May 23. June marked a turning point: silver surging to $36.76 by June 9 and reaching a year-to-date high of $37.12 on June 17. By the quarter’s end, prices stabilized between $36 and $37, holding strong into July.
Supply Squeeze Meets Rising Demand
Silver’s rally was underpinned by a persistent supply deficit. The Silver Institute’s World Silver Survey (April 16, 2025) reported record demand of 680.5 million ounces in 2024, driven by industries like solar energy, artificial intelligence, and electric vehicles. Meanwhile, mine production lagged, creating a 148.9-million-ounce shortfall-the fourth consecutive year of deficits. Some experts may say that we’re seeing flat supply and demand outpacing it by nearly 20%. Aboveground stockpiles have dwindled by 800 million ounces over four years-equivalent to a full year’s mine output. They call it a “perfect storm” for silver’s price trajectory.
Geopolitical and Economic Catalysts
Global tensions are having a very noticeable impact on the dynamics of silver. Escalating conflicts, including Israel’s June 12 and June 21 strikes on Iranian nuclear sites, heightened fears of disrupted trade and energy flows, just boosting this way silver’s safe-haven appeal. Meanwhile, the BRICS bloc’s push to reduce reliance on the U.S. dollar, including Russia’s proposal for a precious metals exchange, added further momentum. U.S. trade policies, particularly President Trump’s fluctuating tariffs, introduced volatility. The April 2 “Liberation Day” tariff announcement sparked fears of a recession, briefly pushing silver prices down due to its industrial exposure. I guess that any recession-driven dip would be short-lived, with silver buoyed by broader precious metals strength and a weaker U.S. dollar.
Industrial Demand in the Spotlight
Unlike gold, silver’s industrial role amplified its price movements. Its use in photovoltaics, military components, and energy infrastructure has surged, with national security priorities in the U.S. and elsewhere driving demand. Economist Dr. Nomi Prins states the following: “Silver’s industrial applications-especially in energy and defense-are outpacing supply. Geopolitical shifts are cementing its role beyond a traditional safe-haven asset.”
What’s Next for Silver?
Looking ahead, analysts remain optimistic. Some predicts, that silver will hold above $35, potentially reaching $40 by year-end, with a stronger dollar as a possible headwind. Speaking about long-term, they see the gold-silver ratio (currently 92:1, compared to a 50-year average of 60:1) narrowing to 40:1 or lower, potentially pushing silver past $100 per ounce in the next few years. Although a global recession could temper industrial demand, safe-haven buying and ongoing supply constraints are expected to provide support. Geopolitical tensions and trade disputes, particularly between the U.S. and China, are unlikely to fade, which will only increase the attractiveness of silver.
Silver's performance reflects the dynamic interplay between industrial demand, supply shortages, and global uncertainties. With favorable fundamentals and geopolitical conditions, silver is poised for continued strength in the second half of 2025, assuming recession risks remain manageable.