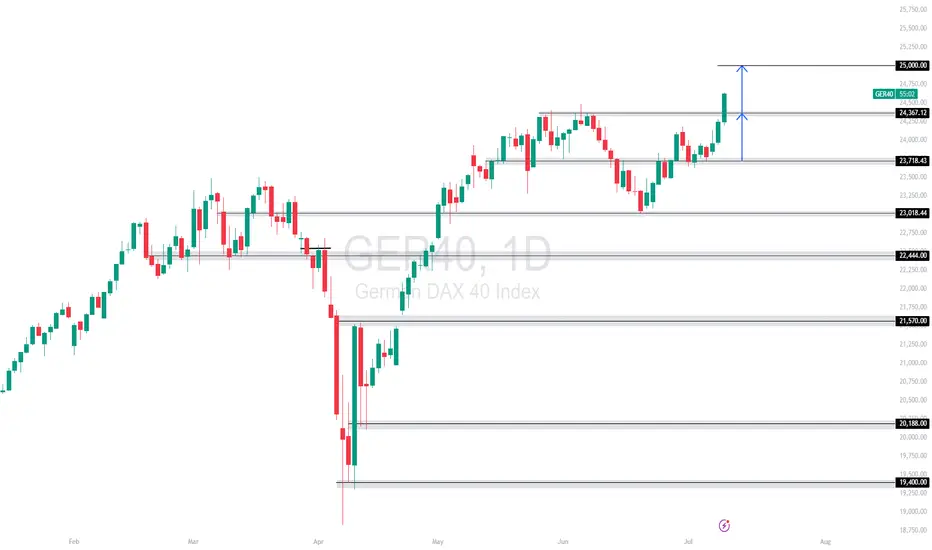
GER40 Breaks Resistance – Eyes Set on 25,000 The index has broken above the key resistance at 24,367 🔼, turning it into fresh support. This breakout confirms bullish momentum, with strong upward structure and follow-through candles.
Support Levels: 24,367 🔽, 23,718 🔽
Resistance Levels: 25,000 🔼
Bias:
🔼 Bullish: If price holds above 24,367, we may see a continued push toward 25,000.
🔽 Bearish: A drop below 24,367 could invalidate the breakout and shift momentum back to 23,718.
📛 Disclaimer: This is not financial advice. Trade at your own risk.
DE40 trade ideas
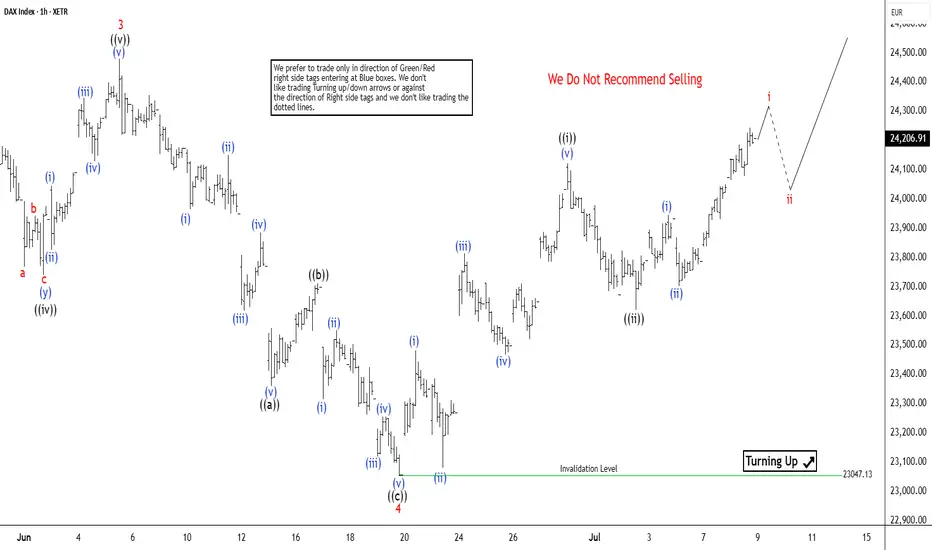
Elliott Wave Outlook: DAX Set to Rally Higher in Wave 5Since April 7, 2025, the DAX Index has been advancing in a clear impulsive cycle, originating from a low that has set the stage for a structured upward movement. The initial advance, wave 1, concluded at 20468.43. It was followed by a corrective pullback in wave 2, which found support at 19384.39. The subsequent rally in wave 3 was robust, peaking at 24479.42, as depicted on the 1-hour chart. Wave 4 unfolded as a zigzag Elliott Wave pattern, characterized by a decline in wave ((a)) to 23360.16. A recovery in wave ((b)) took place to 23711.73, and a final dip in wave ((c)) to 23047.13, completing the corrective wave 4.
The Index then resumed its upward trajectory in wave 5, structured as an impulse in a lesser degree. From the wave 4 low, wave (i) reached 23481.97. A minor pullback in wave (ii) followed which ended at 23080.29. The rally then continued with wave (iii) peaking at 23812.79, a slight correction in wave (iv) to 23466.73, and the final leg, wave (v), concluding at 241200.82, marking the completion of wave ((i)).
A corrective wave ((ii)) found support at 23620.42, and the Index has since turned higher in wave ((iii)). As long as the pivot low at 23407.13 holds, the DAX is expected to extend its gains, with pullbacks likely finding support in a 3, 7, or 11 swing structure. This analysis suggests continued bullish momentum in the near term, with key support levels providing opportunities for further upside.
Technical Weekly AnalysisStart your week by identifying the key price levels and trends.
The SpreadEx Research team has analysed the most popular markets, including stocks, indices, commodities & forex.
--------------------------------------------------------------------------------------------------------------
Analysis
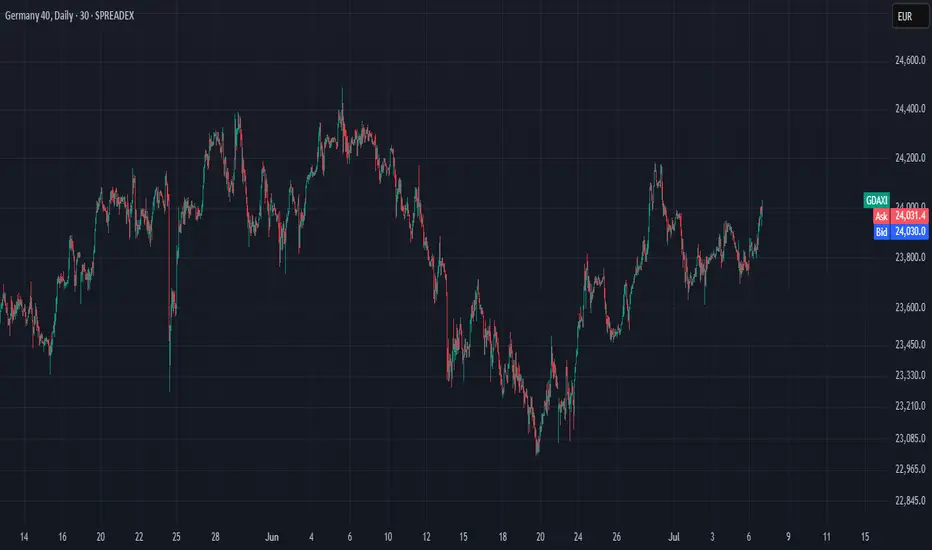
Germany 40 is currently in a neutral trend, moving within a range phase. It's trading at 23,851, holding above its VWAP of 23,582, suggesting limited directional conviction. The RSI at 53 indicates a balanced market. Support is at 22,985, while resistance is at 24,179.
UK 100 remains in a neutral trend and range phase, hovering around its VWAP at 8,800, with price at 8,805. This shows a lack of strong momentum. The RSI at 53 confirms indecision. Support lies at 8,734, while resistance is at 8,881.
Wall Street continues its bullish trend and is in an extended impulsive phase, trading at 44,681, significantly above its VWAP of 43,119. This highlights ongoing upside strength. The RSI at 72 suggests the market has entered overbought conditions. Support is seen at 41,002, with resistance at 45,236.
Brent Crude is in a neutral trend and range phase, trading at 6,802, still below the VWAP of 7,045 following the steep correction. This implies modest weakness. The RSI at 48 supports the lack of strong momentum. Support is at 6,217, while resistance is at 7,873.
Gold remains in a neutral range-bound trend underneath record highs, currently priced at 3,310, just under its VWAP of 3,347. The RSI at 46 signals a lack of directional conviction. Support is at 3,262, with resistance at 3,432.
EUR/USD is bullish and in an impulsive phase, with price at 1.1748, well above its VWAP of 1.1646 and at a multi-year high. The RSI at 65 after reaching overbought conditions is a warning sign. Support is at 1.1402, with resistance extending to 1.8897.
GBP/USD holds a bullish trend and is in a pullback phase after hitting a multi-year high, trading at 1.3606, right in line with its VWAP. RSI at 51 indicates neutral momentum with signs of bearish divergence from price. Support is seen at 1.3373, with resistance at 1.3818.
USD/JPY is in a neutral trend and range phase, trading at 145.06, matching its VWAP level. This equilibrium reflects indecision. The RSI at 53 aligns with a directionless market. Support sits at 143.28, with resistance at 146.34.
Quick take on DAXTariffs, no tariffs, tariffs, no tariffs... Let's look at the technical picture...
XETR:DAX
MARKETSCOM:GERMANY40
Let us know what you think in the comments below.
Thank you.
77.3% of retail investor accounts lose money when trading CFDs with this provider. You should consider whether you understand how CFDs work and whether you can afford to take the high risk of losing your money. Past performance is not necessarily indicative of future results. The value of investments may fall as well as rise and the investor may not get back the amount initially invested. This content is not intended for nor applicable to residents of the UK. Cryptocurrency CFDs and spread bets are restricted in the UK for all retail clients.

German30The Asian session traded fairly low today looking to target yesterdays low however we are forming a bullish flag pattern indicating that we will continue the uptrend.
We will take advantage of this opportunity and look to target 200 pips on this setup. Remember to always trade cautiously and like and subscriber for more A+ setups
Germany 40 – Preparing For A Short Term Range BreakoutTariff worries, including new comments from President Trump stating that he is likely to impose fresh import charges on pharmaceuticals, have continued to dominate the thinking of Germany 40 traders this week. This has lead to some choppy price action for the index, which after opening on Monday at 24140, has bounced between a Tuesday high of 24293 and a Wednesday low of 23923, before settling back into the middle of that range.
Throw into the mix, the start of Q2 earnings season for European corporates and an upcoming ECB interest rate decision in a week's time and you can see how price action could become increasingly volatile moving forward into the end of July.
Earnings season has so far got off to a slow start in Europe and Germany 40 traders may have to wait until SAP, the company carrying the highest market capitalisation ($352 billion) and index weighting (14.5%), reports its results next Tuesday (after the close) for further insight into where prices may move next.
In terms of the ECB rate decision next Thursday (July 24th), market expectations may currently be indicating that another rate cut is unlikely, although it could be a close call. Traders seem to be focusing on recent commentary from policymakers which suggests the balance of power for the time being has shifted to the more hawkish committee members, who have stated that with inflation sitting on the central bank's target of 2% there is no need to cut rates further. Choosing instead to wait for more clarity on the outcome of trade negotiations with the US, which could decide whether a trade war between the world's first and third biggest economies may be something they need to navigate.
Technical Update: Assessing Current Pirce Action
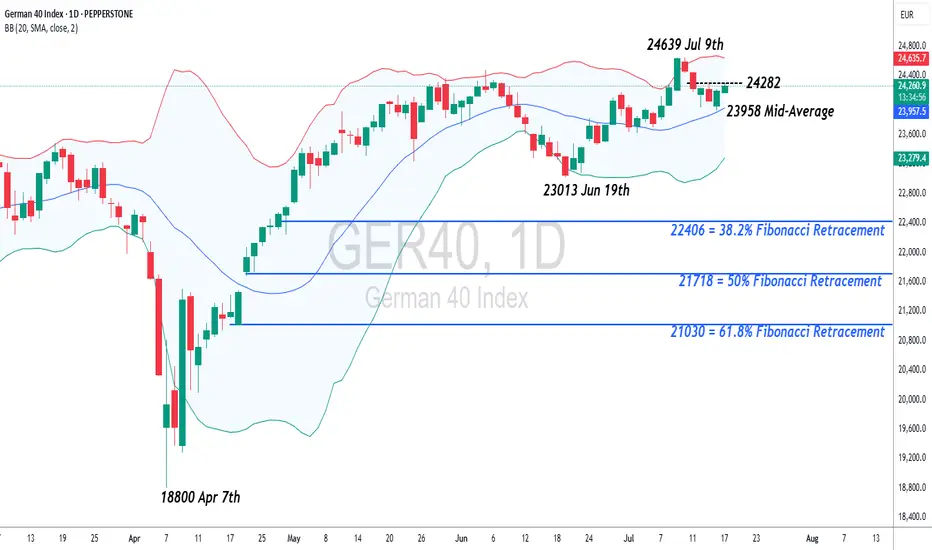
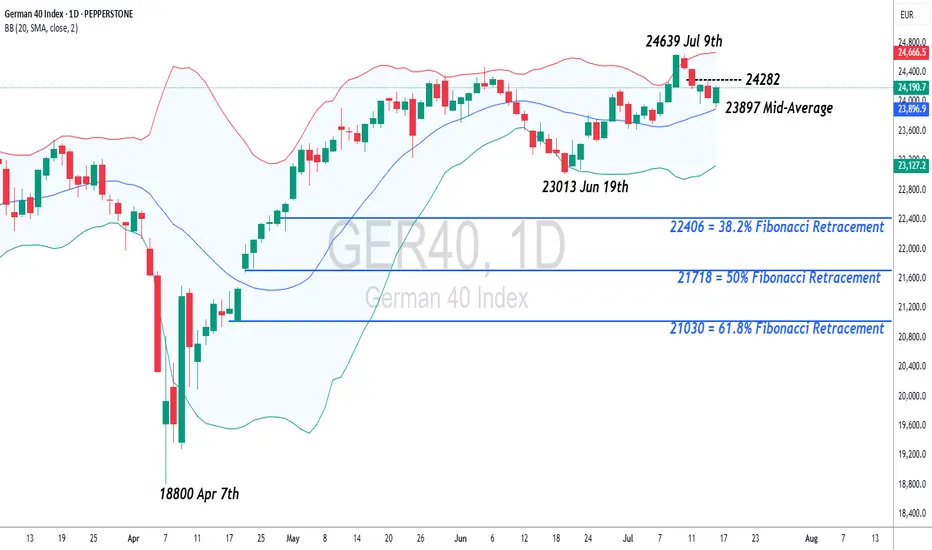
Having posted a new all-time high at 24639 on July 9th the Germany 40 index has entered a corrective period in price. However, while much will depend on future market sentiment and price trends, traders may well be asking, whether current price declines can develop into a more extended phase of weakness, or if the downside move could be limited as buyers return once again.
Time will tell, but in the meantime, technical analysis may help pinpoint potential support and resistance levels which can aid traders in establishing the next possible trends and directional risks.
Potential Support Levels:
Having recently posted a new all-time high at 24639, it might be argued this is still a positive price trend, especially as the Bollinger mid-average is currently rising. The mid-average stands at 23954, so may mark the first support focus for traders over coming sessions.
However, if closing breaks of this 23954 level materialise, it might lead towards a further phase of price weakness towards 23013, the June 19th session low, even 22406, which is the 38.2% Fibonacci retracement of April to July 2025 price strength.
Potential Resistance Levels:
If the 23954 mid-average successfully holds the current price setback, it could prompt further attempts to extend recent strength.
The first resistance might then stand at 24282, which is equal to half of the latest weakness, with successful closing breaks above this level possibly opening scope back to the 24639 all-time high and maybe further, if this in turn gives way.
The material provided here has not been prepared accordance with legal requirements designed to promote the independence of investment research and as such is considered to be a marketing communication. Whilst it is not subject to any prohibition on dealing ahead of the dissemination of investment research, we will not seek to take any advantage before providing it to our clients.
Pepperstone doesn’t represent that the material provided here is accurate, current or complete, and therefore shouldn’t be relied upon as such. The information, whether from a third party or not, isn’t to be considered as a recommendation; or an offer to buy or sell; or the solicitation of an offer to buy or sell any security, financial product or instrument; or to participate in any particular trading strategy. It does not take into account readers’ financial situation or investment objectives. We advise any readers of this content to seek their own advice. Without the approval of Pepperstone, reproduction or redistribution of this information isn’t permitted.
Germany 40 – Preparing For A Short Term Range BreakoutTariff worries, including new comments from President Trump stating that he is likely to impose fresh import charges on pharmaceuticals, have continued to dominate the thinking of Germany 40 traders this week, leading to some choppy price action for the index, which after opening on Monday at 24084, has bounced between a Tuesday high of 24293 and a Wednesday low of 23925, before settling back into the middle of that range.
Throw into the mix, the start of Q2 earnings season for European corporates and an upcoming ECB interest rate decision in a week's time and you can see how price action could become increasingly volatile moving forward into the end of July.
Earnings season has so far got off to a slow start in Europe and Germany 40 traders may have to wait until SAP, the company carrying the highest market capitalisation ($352 billion) and index weighting (14.5%), reports its results next Tuesday (after the close) for further insight into where prices may move next.
In terms of the ECB rate decision next Thursday (July 24th), market expectations may currently be indicating that another rate cut is unlikely, although it could be a close call. Traders seem to be focusing on recent commentary from policymakers which suggests the balance of power for the time being has shifted to the more hawkish committee members, who have stated that with inflation sitting on the central bank's target of 2% there is no need to cut rates further. Choosing instead to wait for more clarity on the outcome of trade negotiations with the US, which could decide whether a trade war between the world's first and third biggest economies may be something they need to navigate.
Technical Update:
Having posted a new all-time high at 24639 on July 9th the German 40 index has entered a corrective period in price. However, while much will depend on future market sentiment and price trends, traders may well be asking, if current price declines can develop into a more extended phase of weakness, or if downside is just a limited move before buyers return to extend price strength.
Time will tell, but in the meantime, technical analysis may help pinpoint potential support and resistance levels, aiding in establishing next possible trends and directional risks.
Potential Support:
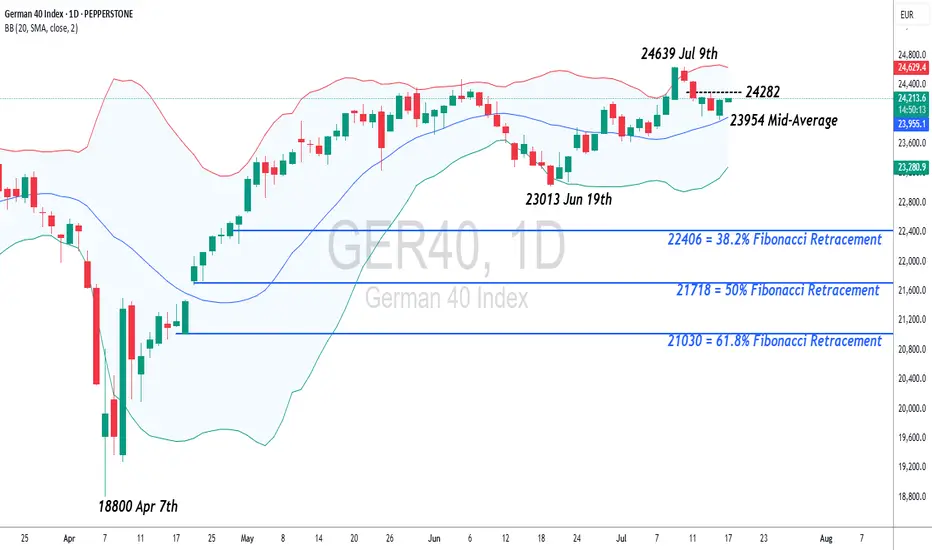
Having recently posted a new all-time high at 24639, it might be argued this is still a positive price trend, especially as the Bollinger mid-average is currently rising. This for Thursday stands at 23954, so may mark the first support focus for traders over coming sessions.
If closing breaks of this 23954 level materialise, it might lead towards a further phase of price weakness towards 23013, the June 19th session low, even 22406, the 38.2% Fibonacci retracement of April to July 2025 price strength.
Potential Resistance:
If the 23954 mid-average successfully holds the current price setback, it could possibly prompt further attempts to extend recent strength.
First resistance might then stand at 24282, equal to half latest weakness, with successful closing breaks possibly then opening scope back to the 24639 all-time high and maybe further, if this in turn gives way.
The material provided here has not been prepared accordance with legal requirements designed to promote the independence of investment research and as such is considered to be a marketing communication. Whilst it is not subject to any prohibition on dealing ahead of the dissemination of investment research, we will not seek to take any advantage before providing it to our clients.
Pepperstone doesn’t represent that the material provided here is accurate, current or complete, and therefore shouldn’t be relied upon as such. The information, whether from a third party or not, isn’t to be considered as a recommendation; or an offer to buy or sell; or the solicitation of an offer to buy or sell any security, financial product or instrument; or to participate in any particular trading strategy. It does not take into account readers’ financial situation or investment objectives. We advise any readers of this content to seek their own advice. Without the approval of Pepperstone, reproduction or redistribution of this information isn’t permitted.
Germany 40 – Preparing For A Short Term Range BreakoutTariff worries, including new comments from President Trump stating that he is likely to impose fresh import charges on pharmaceuticals, have continued to dominate the thinking of Germany 40 traders this week, leading to some choppy price action for the index, which after opening on Monday at 24084, has bounced between a Tuesday high of 24293 and a Wednesday low of 23925, before settling back into the middle of that range.
Throw into the mix, the start of Q2 earnings season for European corporates and an upcoming ECB interest rate decision in a week's time and you can see how price action could become increasingly volatile moving forward into the end of July.
Earnings season has so far got off to a slow start in Europe and Germany 40 traders may have to wait until SAP, the company carrying the highest market capitalisation ($352 billion) and index weighting (14.5%), reports its results next Tuesday (after the close) for further insight into where prices may move next.
In terms of the ECB rate decision next Thursday (July 24th), market expectations may currently be indicating that another rate cut is unlikely, although it could be a close call. Traders seem to be focusing on recent commentary from policymakers which suggests the balance of power for the time being has shifted to the more hawkish committee members, who have stated that with inflation sitting on the central bank's target of 2% there is no need to cut rates further. Choosing instead to wait for more clarity on the outcome of trade negotiations with the US, which could decide whether a trade war between the world's first and third biggest economies may be something they need to navigate.
Technical Update:
Having posted a new all-time high at 24639 on July 9th the German 40 index has entered a corrective period. However, while much will depend on future unknow market sentiment and price trends, traders may well be asking, if current price weakness can develop into a more extended phase of weakness, or if downside is just a limited move before buyers return to extend price strength.
Time will tell, but in the meantime, technical analysis may help pinpoint potential support and resistance levels, aiding us establish next potential trends and directional risks.
Potential Support:
Having recently posted a new all-time high at 24639, it might be argued this is still a possible positive trend, especially as the Bollinger mid-average is currently rising. This for Thursday stands at 23897, so may mark the first support focus for traders over coming sessions.
If closing breaks of this 23965 level materialise, it might lead towards a further phase of price weakness towards 23013, the June 19th session low, even 22406, the 38.2% Fibonacci retracement of April to July 2025 price strength.
Potential Resistance:
If the 23965 mid-average successfully holds the current price setback, it could possibly prompt further attempts to extend recent strength.
First resistance might then stand at 24282, equal to half latest weakness, with successful closing breaks possibly then opening scope back to the 24639 all-time high and maybe further, if this in turn gives way.
The material provided here has not been prepared accordance with legal requirements designed to promote the independence of investment research and as such is considered to be a marketing communication. Whilst it is not subject to any prohibition on dealing ahead of the dissemination of investment research, we will not seek to take any advantage before providing it to our clients.
Pepperstone doesn’t represent that the material provided here is accurate, current or complete, and therefore shouldn’t be relied upon as such. The information, whether from a third party or not, isn’t to be considered as a recommendation; or an offer to buy or sell; or the solicitation of an offer to buy or sell any security, financial product or instrument; or to participate in any particular trading strategy. It does not take into account readers’ financial situation or investment objectives. We advise any readers of this content to seek their own advice. Without the approval of Pepperstone, reproduction or redistribution of this information isn’t permitted.
Double bottom Double bottom on the Dax with a RSI divergency. There's a good possibility the trend will resume from here.
DAX: Will Go Up! Long!
My dear friends,
Today we will analyse DAX together☺️
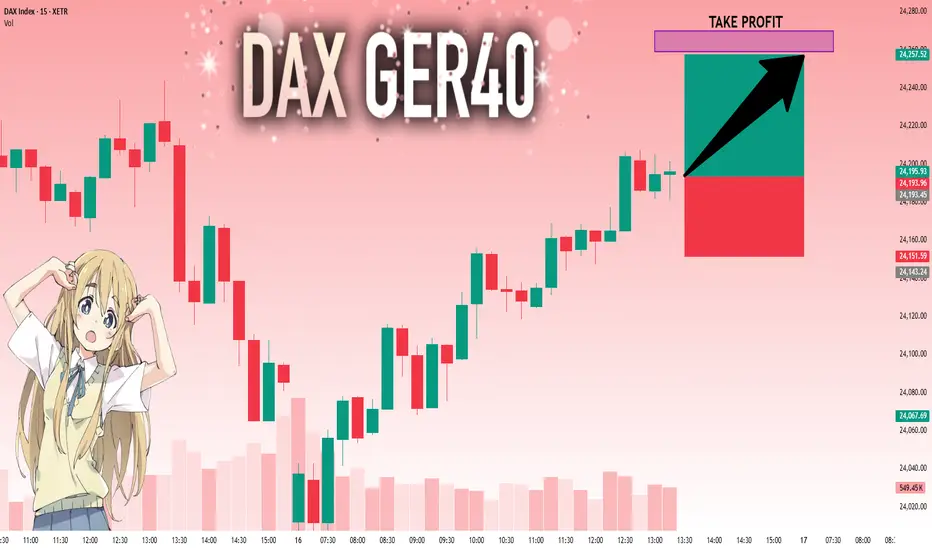
The recent price action suggests a shift in mid-term momentum. A break above the current local range around 24,193.45 will confirm the new direction upwards with the target being the next key level of 24,258.97 and a reconvened placement of a stop-loss beyond the range.
❤️Sending you lots of Love and Hugs❤️
ger30 long again trend on daily is bullish ,we have a level all we need s our entry patterns on the smaller time frames . waiting for mine
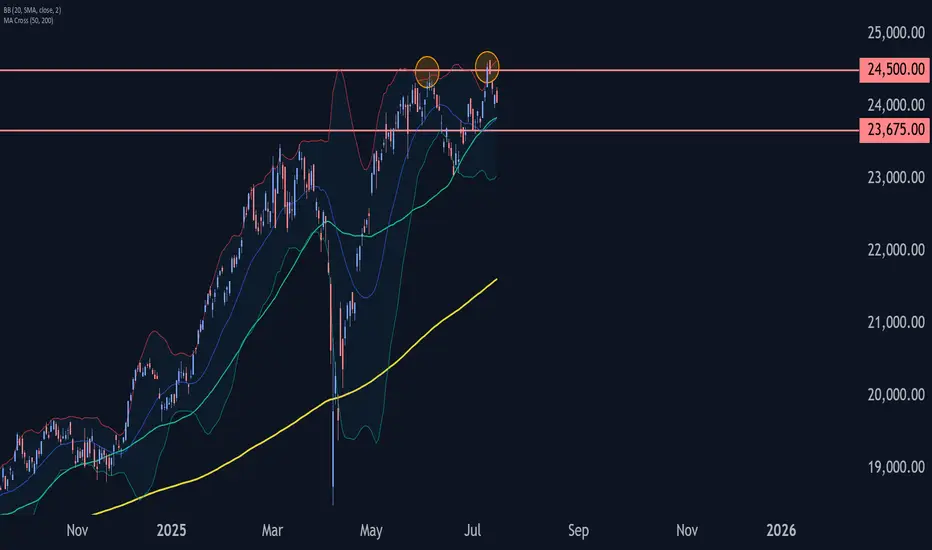
DAX Wave Analysis – 15 July 2025
- DAX reversed from the resistance area
- Likely to fall to support level 23675.00.
DAX index recently reversed down the resistance area between the pivotal resistance level 24500.00 (former top of wave 3 from June) and the upper daily Bollinger Band.
The downward reversal from this resistance zone stopped the earlier short-term ABC correction B.
Given the strength of the resistance level 24500.00, DAX index can be expected to fall further to the next support level 23675.00.
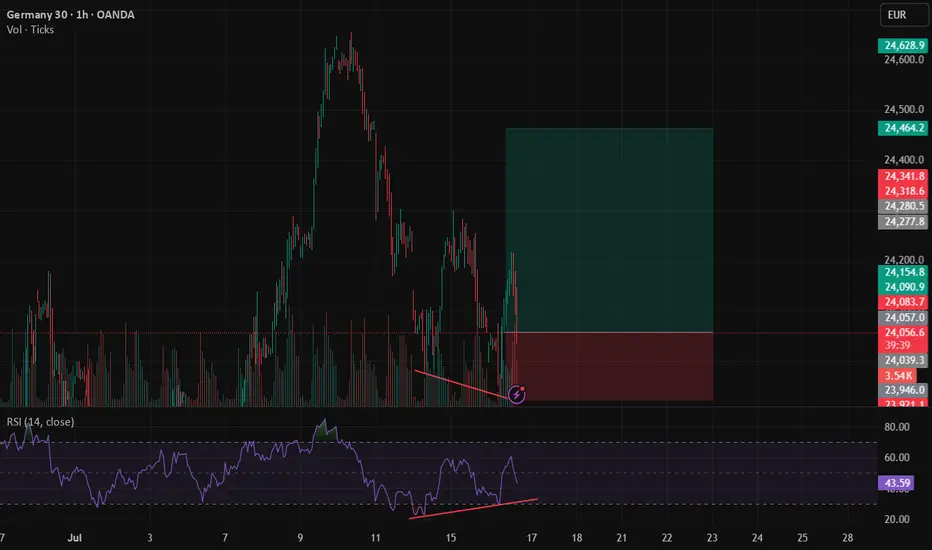
GER40 is BullishPrice was in a downtrend, however the bullish divergence with a double bottom reversal formation hints the return of bulls. If previous lower high is broken along with the descending trendline, then we can expect a bullish reversal as per Dow theory. Targets are mentioned on the chart.
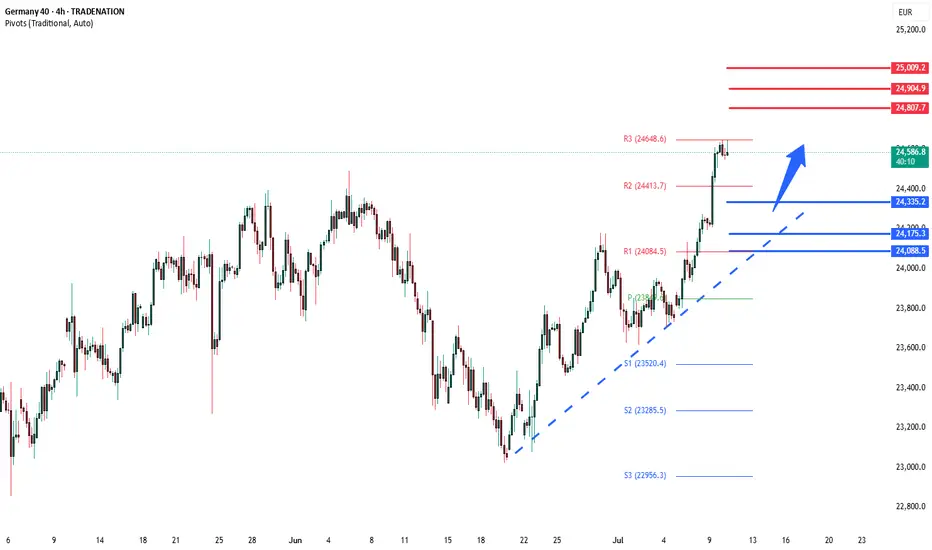
DAX pause at the ATH The DAX remains in a bullish trend, with recent price action showing signs of a resistance breakout within the broader uptrend.
Support Zone: 24335 – a key level from previous consolidation. Price is currently testing or approaching this level.
A bullish rebound from 24335 would confirm ongoing upside momentum, with potential targets at:
24800 – initial resistance
24900 – psychological and structural level
25000 – extended resistance on the longer-term chart
Bearish Scenario:
A confirmed break and daily close below 24335 would weaken the bullish outlook and suggest deeper downside risk toward:
24175 – minor support
24090 – stronger support and potential demand zone
Outlook:
Bullish bias remains intact while the DAX holds above 24335. A sustained break below this level could shift momentum to the downside in the short term.
This communication is for informational purposes only and should not be viewed as any form of recommendation as to a particular course of action or as investment advice. It is not intended as an offer or solicitation for the purchase or sale of any financial instrument or as an official confirmation of any transaction. Opinions, estimates and assumptions expressed herein are made as of the date of this communication and are subject to change without notice. This communication has been prepared based upon information, including market prices, data and other information, believed to be reliable; however, Trade Nation does not warrant its completeness or accuracy. All market prices and market data contained in or attached to this communication are indicative and subject to change without notice.
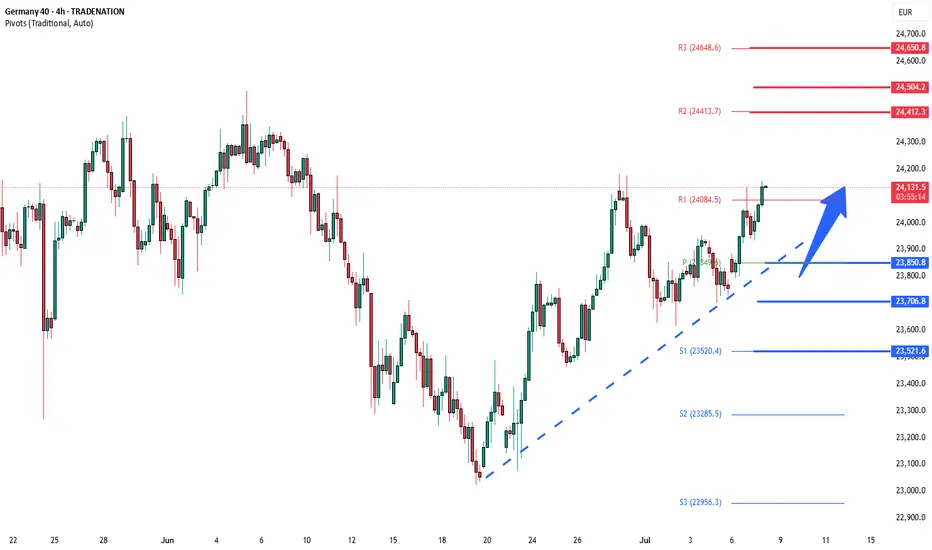
DAX40 uptrend continuation support at 23850The DAX40 remains in a bullish trend, with recent price action showing signs of a corrective pullback within the broader uptrend.
Support Zone: 23850 – a key level from previous consolidation. Price is currently testing or approaching this level.
A bullish rebound from 22850 would confirm ongoing upside momentum, with potential targets at:
24410 – initial resistance
24500 – psychological and structural level
24650 – extended resistance on the longer-term chart
Bearish Scenario:
A confirmed break and daily close below 23850 would weaken the bullish outlook and suggest deeper downside risk toward:
23700 – minor support
23520 – stronger support and potential demand zone
Outlook:
Bullish bias remains intact while the DAX40 holds above 23850. A sustained break below this level could shift momentum to the downside in the short term.
This communication is for informational purposes only and should not be viewed as any form of recommendation as to a particular course of action or as investment advice. It is not intended as an offer or solicitation for the purchase or sale of any financial instrument or as an official confirmation of any transaction. Opinions, estimates and assumptions expressed herein are made as of the date of this communication and are subject to change without notice. This communication has been prepared based upon information, including market prices, data and other information, believed to be reliable; however, Trade Nation does not warrant its completeness or accuracy. All market prices and market data contained in or attached to this communication are indicative and subject to change without notice.
DAX40 Bullish consolidation breakout Trend Overview:
The DAX index maintains a bullish overall sentiment, supported by a sustained rising trend on the higher timeframes. However, recent intraday price action suggests a corrective pullback and consolidation phase, likely part of a broader continuation pattern.
Key Support and Resistance Levels:
Support:
Initial support: 23,330 – a key previous consolidation area and pivot level
Below that: 23,170, then 22,970 as deeper retracement levels
Resistance:
Near-term upside target: 24,030
Further resistance: 24,130 and 24,345 over the longer term
Scenarios:
Bullish Continuation:
A bounce from 23,330 would confirm this level as valid support
Sustained strength could drive price toward 24,030, then 24,130 and 24,345
Bearish Breakdown:
A daily close below 23,330 would invalidate the bullish setup
Opens potential for deeper pullbacks toward 23,170 and 22,970
Conclusion:
The DAX remains bullish in structure but is currently consolidating. Watch the 23,330 support zone closely—its ability to hold will determine whether bulls regain control or if a deeper correction unfolds. A bounce here would favor upside targets; a confirmed breakdown shifts the outlook to short-term bearish.
This communication is for informational purposes only and should not be viewed as any form of recommendation as to a particular course of action or as investment advice. It is not intended as an offer or solicitation for the purchase or sale of any financial instrument or as an official confirmation of any transaction. Opinions, estimates and assumptions expressed herein are made as of the date of this communication and are subject to change without notice. This communication has been prepared based upon information, including market prices, data and other information, believed to be reliable; however, Trade Nation does not warrant its completeness or accuracy. All market prices and market data contained in or attached to this communication are indicative and subject to change without notice.

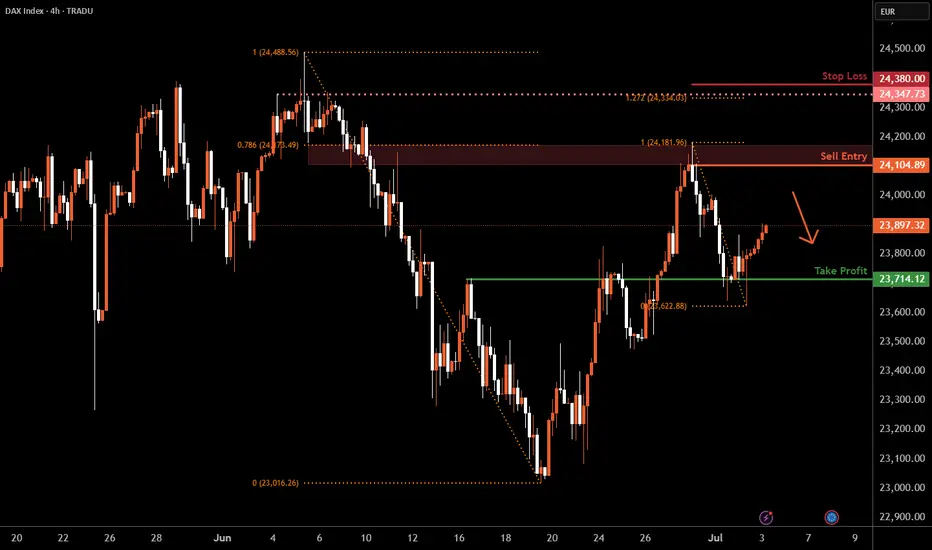
DAX H4 | Heading into a swing-high resistanceThe DAX (GER30) is rising towards a swing-high resistance and could potentially reverse off this level to drop lower.
Sell entry is at 24,104.89 which is a swing-high resistance that aligns closely with the 78.6% Fibonacci retracement.
Stop loss is at 24,380.00 which is a level that sits above the 127.2% Fibonacci extension and a swing-high resistance.
Take profit is at 23,714.12 which is an overlap support.
High Risk Investment Warning
Trading Forex/CFDs on margin carries a high level of risk and may not be suitable for all investors. Leverage can work against you.
Stratos Markets Limited (tradu.com ):
CFDs are complex instruments and come with a high risk of losing money rapidly due to leverage. 63% of retail investor accounts lose money when trading CFDs with this provider. You should consider whether you understand how CFDs work and whether you can afford to take the high risk of losing your money.
Stratos Europe Ltd (tradu.com ):
CFDs are complex instruments and come with a high risk of losing money rapidly due to leverage. 63% of retail investor accounts lose money when trading CFDs with this provider. You should consider whether you understand how CFDs work and whether you can afford to take the high risk of losing your money.
Stratos Global LLC (tradu.com ):
Losses can exceed deposits.
Please be advised that the information presented on TradingView is provided to Tradu (‘Company’, ‘we’) by a third-party provider (‘TFA Global Pte Ltd’). Please be reminded that you are solely responsible for the trading decisions on your account. There is a very high degree of risk involved in trading. Any information and/or content is intended entirely for research, educational and informational purposes only and does not constitute investment or consultation advice or investment strategy. The information is not tailored to the investment needs of any specific person and therefore does not involve a consideration of any of the investment objectives, financial situation or needs of any viewer that may receive it. Kindly also note that past performance is not a reliable indicator of future results. Actual results may differ materially from those anticipated in forward-looking or past performance statements. We assume no liability as to the accuracy or completeness of any of the information and/or content provided herein and the Company cannot be held responsible for any omission, mistake nor for any loss or damage including without limitation to any loss of profit which may arise from reliance on any information supplied by TFA Global Pte Ltd.
The speaker(s) is neither an employee, agent nor representative of Tradu and is therefore acting independently. The opinions given are their own, constitute general market commentary, and do not constitute the opinion or advice of Tradu or any form of personal or investment advice. Tradu neither endorses nor guarantees offerings of third-party speakers, nor is Tradu responsible for the content, veracity or opinions of third-party speakers, presenters or participants.
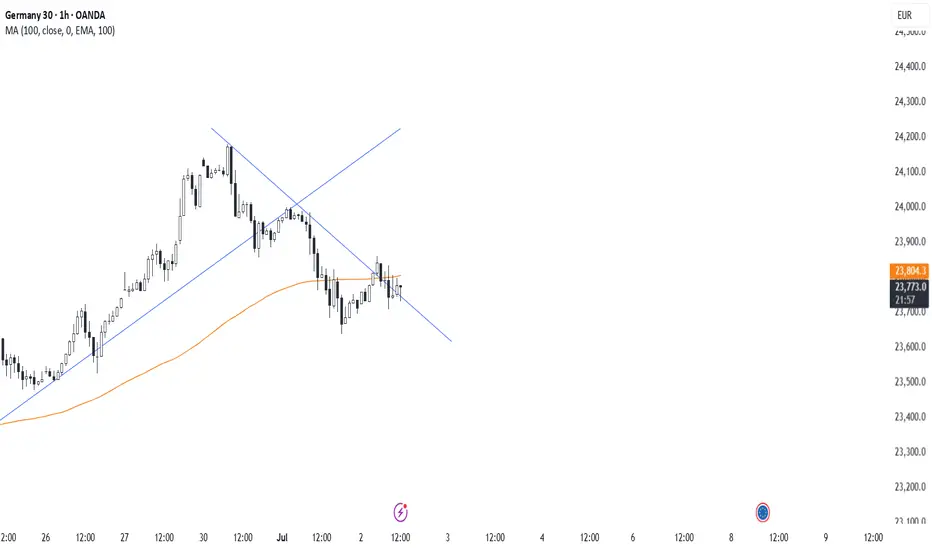
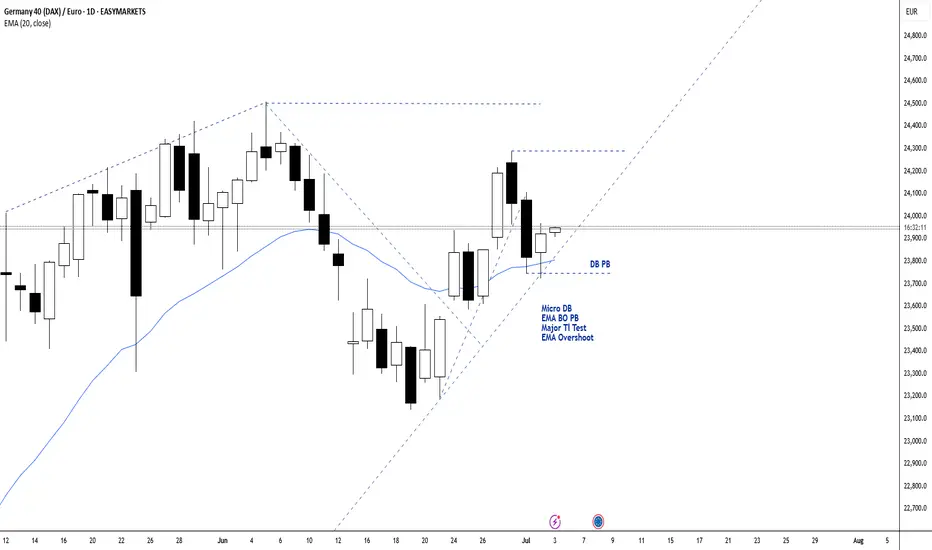
Long ScalpLong Scalp on DAXEUR.
Reasons to take the trade:
1. Major Bull Trendline test
2. Micro Double Bottom Pullback
3. Bullish Doji with long lower tail
4. Breakout Pullback to the EMA with double overshoot
5. It's an almost perfect 50% retracement of the last bull leg (that has a small one candle bear leg in the middle).
Reasons to Passe on it:
1. The last bear candle is bigger than I wanted, so this might be the first bear leg of the new trend.
DAX: Strong Growth Ahead! Long!
My dear friends,
Today we will analyse DAX together☺️
The market is at an inflection zone and price has now reached an area around 23,758.99 where previous reversals or breakouts have occurred.And a price reaction that we are seeing on multiple timeframes here could signal the next move up so we can enter on confirmation, and target the next key level of 23,821.90.Stop-loss is recommended beyond the inflection zone.
❤️Sending you lots of Love and Hugs❤️
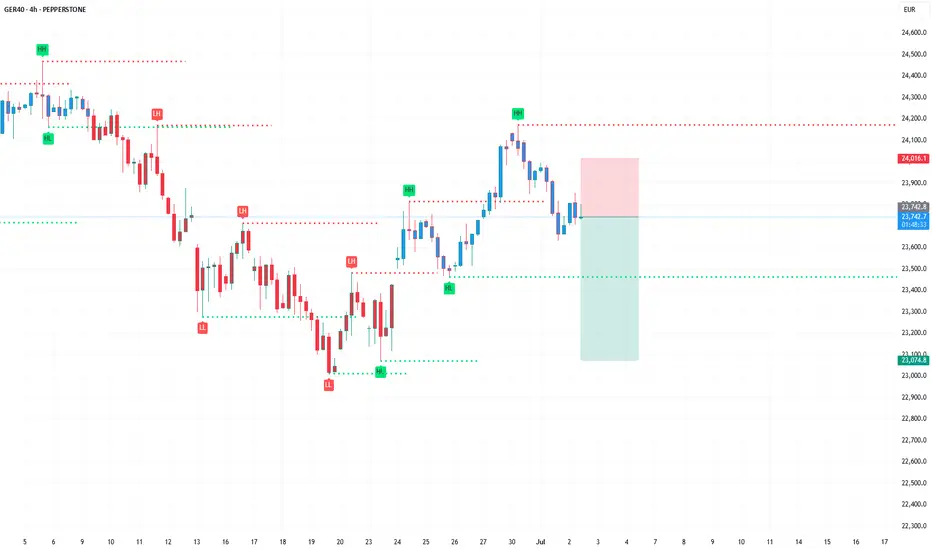
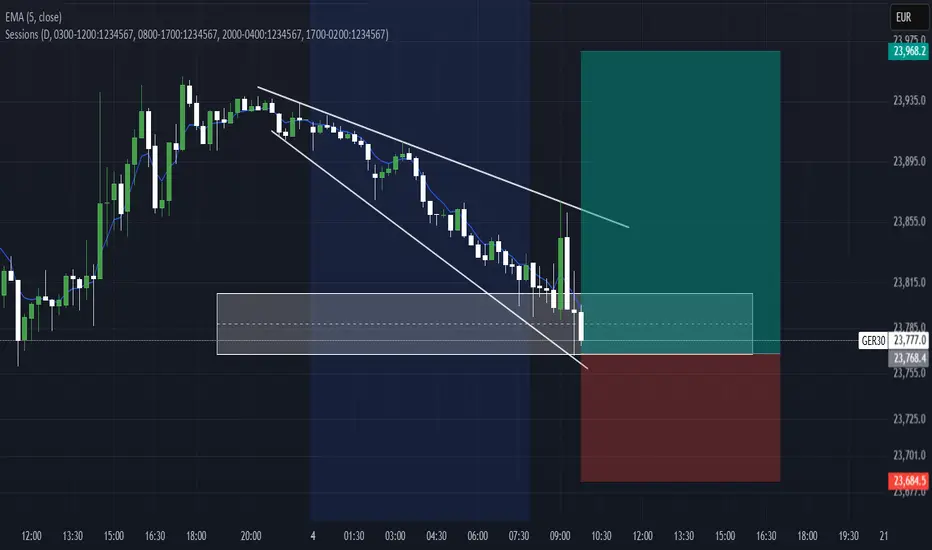
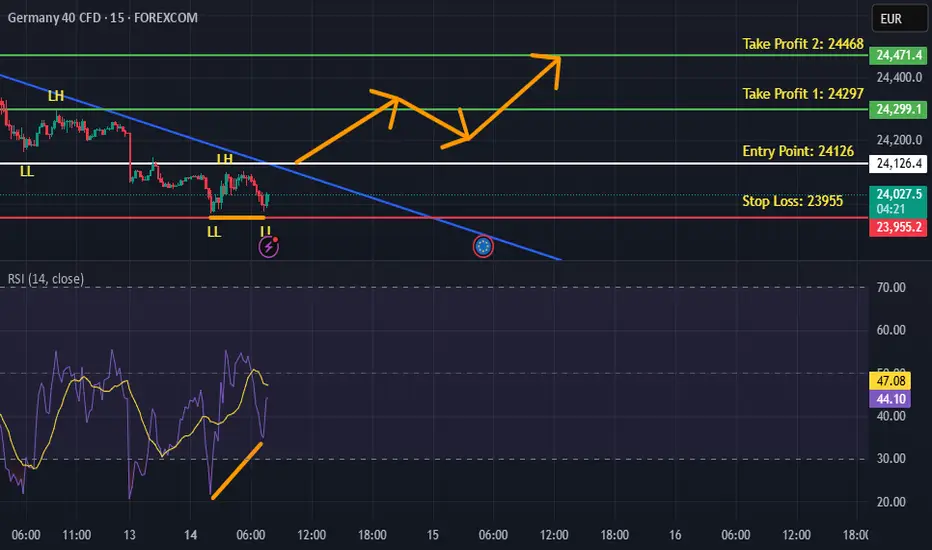
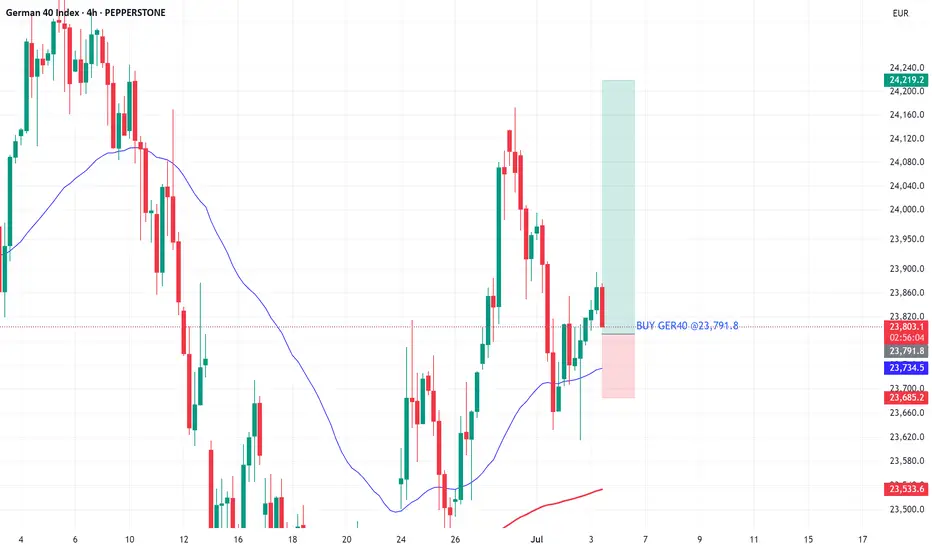
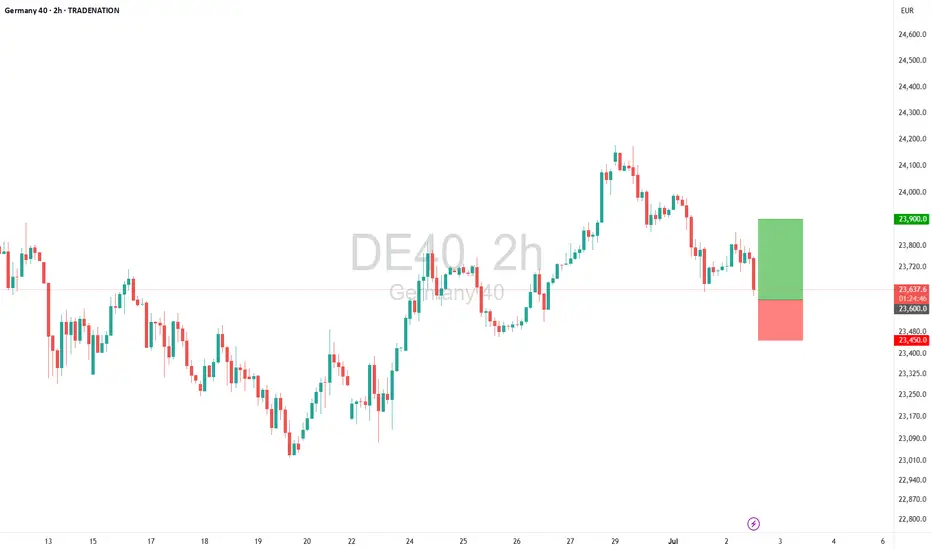
DE40 – Buy the Dip as Bottom Formation EmergesTrade Idea
Type: Buy Limit
Entry: 23,600
Target: 23,900
Stop Loss: 23,450
Duration: Intraday
Expires: 03/07/2025 06:00
Technical Overview
Recent price action suggests a bottom is forming, setting the stage for a potential upward move.
Further upside is expected, but current levels offer a poor risk/reward for immediate buying — instead, waiting for a dip to 23,600 is preferred.
A confirmed move above 23,750 would signal renewed bullish momentum, aligning with a measured move target around 24,000.
Traders should be mindful of ECB President Lagarde’s speech at 15:15 UTC, which may influence overall risk sentiment and European indices.
Key Technical Levels
Support: 23,700 / 23,600 / 23,500
Resistance: 23,800 / 23,900 / 24,000
Disclosure: I am part of Trade Nation's Influencer program and receive a monthly fee for using their TradingView charts in my analysis.
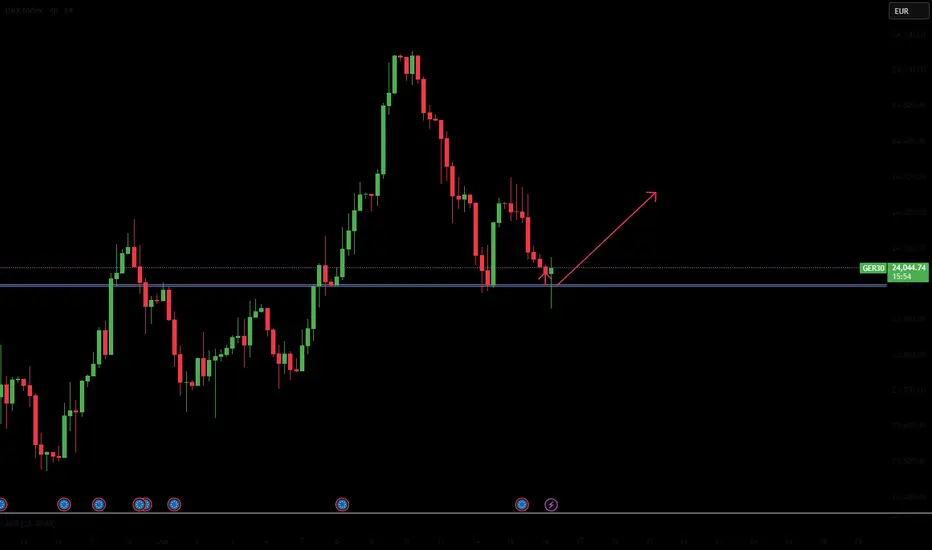
Potential long trade DAXRisk appetite seems to have returned to the market with most global indices reaching new all time highs. The DAX should be no exception to joining the long rally with tariff jitters become the least of investor worries. The overall trend on a daily chart and 4H are bullish. A clear break of the short-term retracement trendline should spark another bullish sequence the could create new highs.