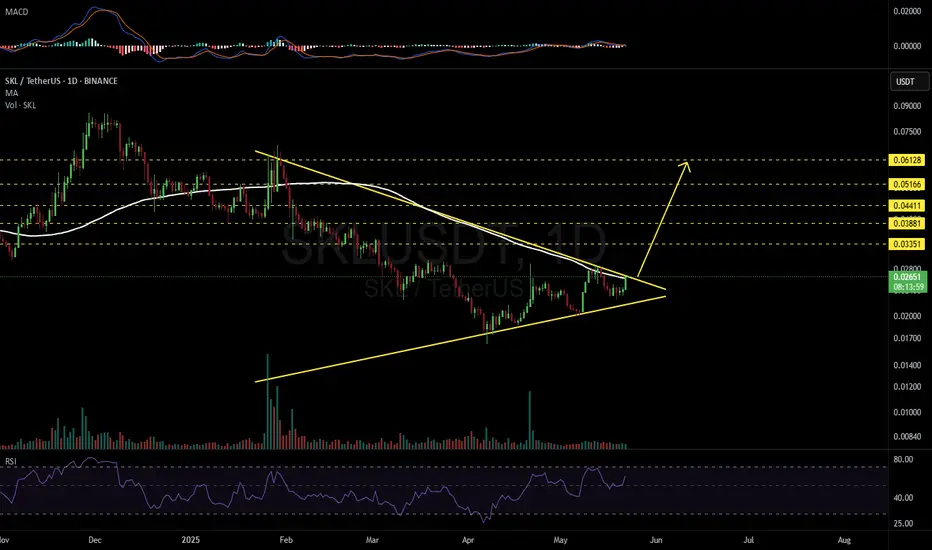
SKLUSDT 1DKeep an eye on the #SKL daily chart. It has formed a symmetrical triangle and is on the verge of breaking out above the triangle resistance and the daily MA100. In case of a breakout, the targets are:
🎯 $0.03351
🎯 $0.03881
🎯 $0.04411
🎯 $0.05166
🎯 $0.06128
⚠️ Use a tight stop-loss.
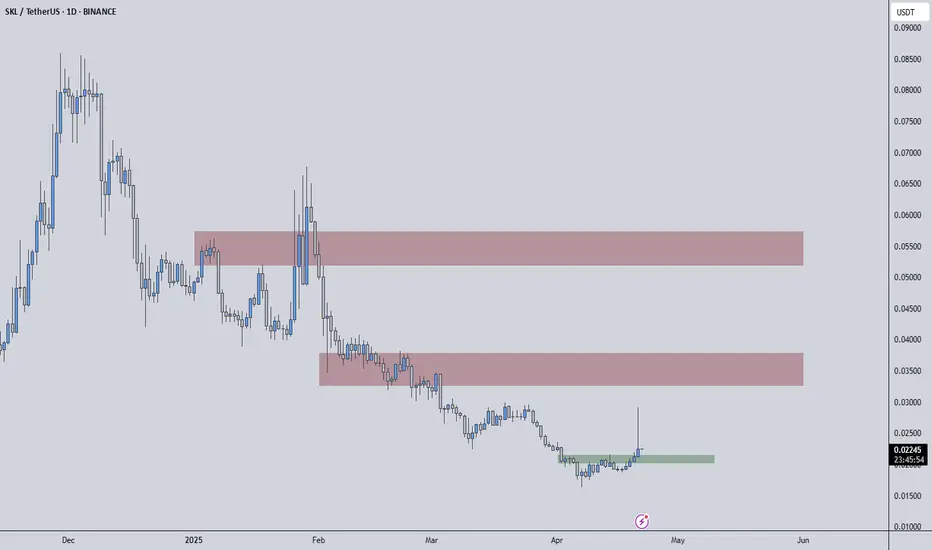
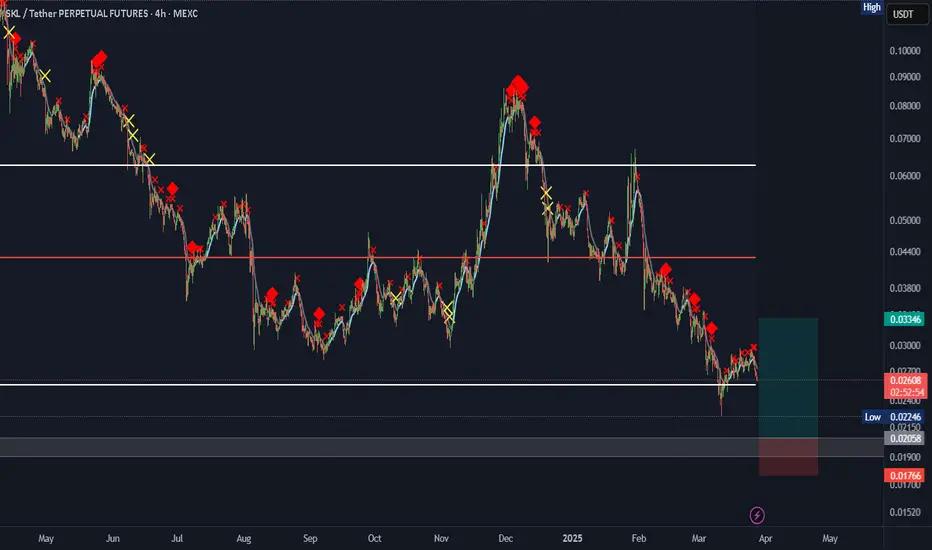
SKLUSDT | +455.6% Volume Surge Signals Big Moves AheadSKLUSDT just recorded a 455.6% jump in trading volume over the last 24 hours. This kind of spike means serious interest is lining up and price is gearing up for its next decisive move.
Key Zones on the Chart
Red Boxes = Strong Resistance
These areas have tested price multiple times and held firm. S
SKLUSDT 1W AnalysisSKL ~ 1W Analysis
#SKL Buy gradually from here with a short -term target of at least 20%+. This is the lowest support for now.
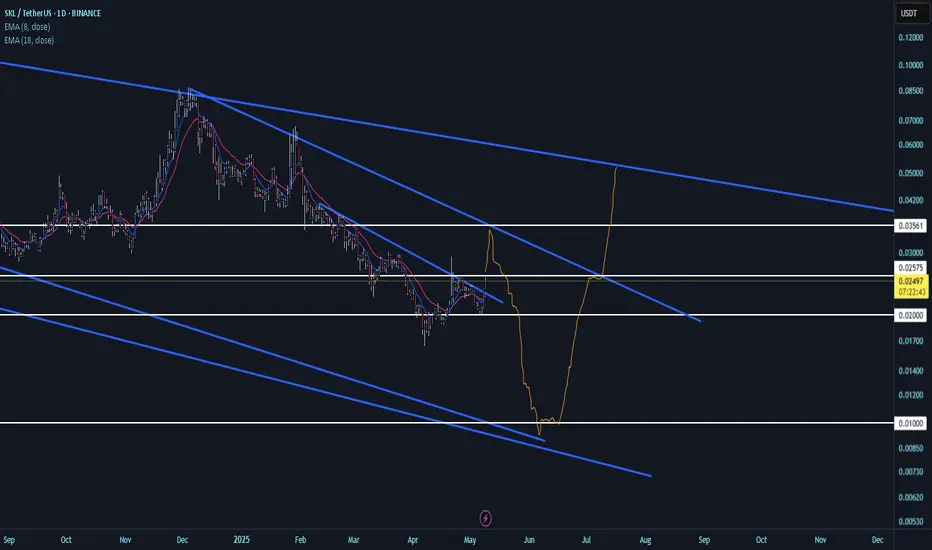
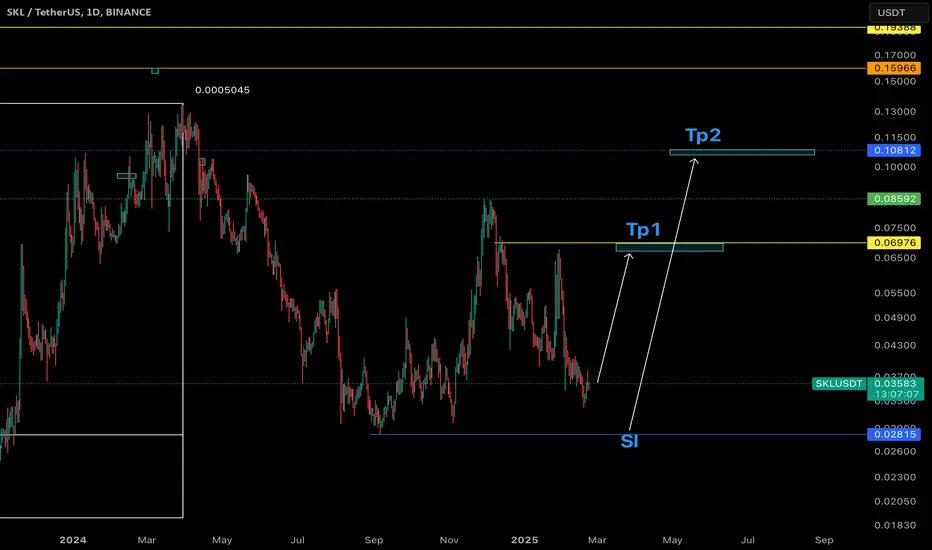
SKL LONG SETUPALL trading ideas have entry point + stop loss + take profit + Risk level.
hello Traders, here is the full analysis for this pair, let me know in the comment section below if you have any questions, the entry will be taken only if all rules of the strategies will be satisfied. I suggest you keep thi
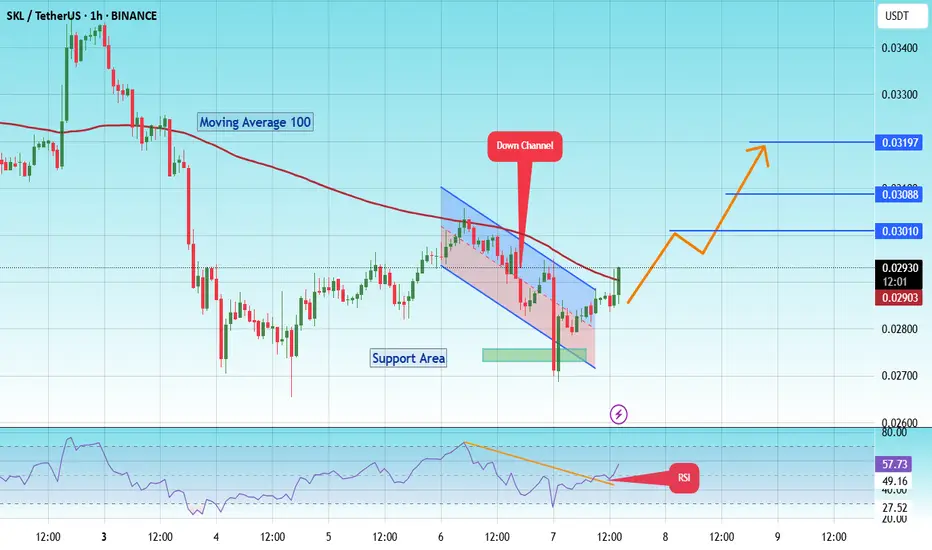
#SKL/USDT#SKL
The price is moving in a descending channel on the 1-hour frame and is expected to continue upwards
We have a trend to stabilize above the moving average 100 again
We have a descending trend on the RSI indicator that supports the rise by breaking it upwards
We have a support area at the low
On a Different SKALE: SKL Analysis!Hello TradingView Family / Fellow Traders. This is Richard, also known as theSignalyst.
📈SKL has been in a correction phase trading within the falling red wedge pattern and it is currently retesting the lower bound of it.
Moreover, the green zone is a strong support.
🏹 Thus, the highlighted blu

Long According to the analysis of the waves and the use of the Gann method and price data analysis, it seems that we can expect the price to return to the ranges specified on the chart.
This analysis is only my personal opinion. Please do not set your own trading criteria and act based on your personal s
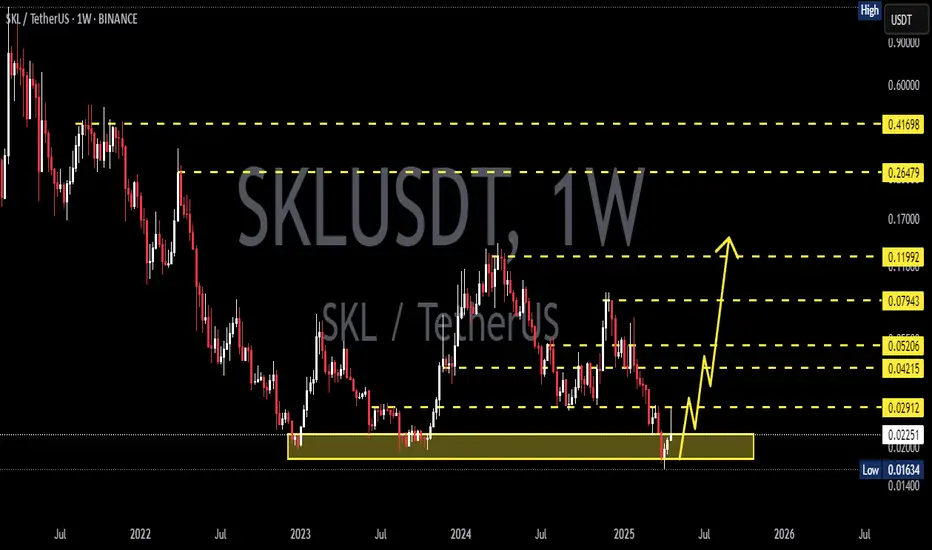
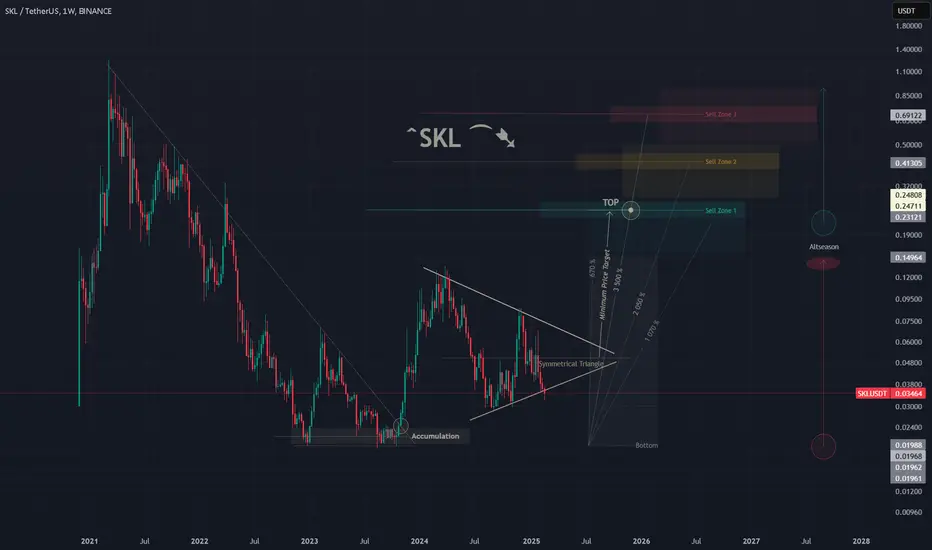
SKL/USDT 1W 🩸 SKL ⁀➷
#SkaleNetwork. Macro chart Another
💯 Intermediate Target - $0.15
🚩 Macro Target 1 - $0.24
🚩 Macro Target 2 - $0.41
🚩 Macro Target 3 - $0.69
- Not financial advice, trade with caution.
#Crypto #SkaleNetwork #SKL #Investment
✅ Stay updated on market news and developments that may i
SKLUSDT 1WSKL ~ 1W Analysis
#SKL If you still have a Conviction on this coin,. Maybe this support block will be a very good place of buy for now.

See all ideas
Summarizing what the indicators are suggesting.
Oscillators
Neutral
SellBuy
Strong sellStrong buy
Strong sellSellNeutralBuyStrong buy
Oscillators
Neutral
SellBuy
Strong sellStrong buy
Strong sellSellNeutralBuyStrong buy
Summary
Neutral
SellBuy
Strong sellStrong buy
Strong sellSellNeutralBuyStrong buy
Summary
Neutral
SellBuy
Strong sellStrong buy
Strong sellSellNeutralBuyStrong buy
Summary
Neutral
SellBuy
Strong sellStrong buy
Strong sellSellNeutralBuyStrong buy
Moving Averages
Neutral
SellBuy
Strong sellStrong buy
Strong sellSellNeutralBuyStrong buy
Moving Averages
Neutral
SellBuy
Strong sellStrong buy
Strong sellSellNeutralBuyStrong buy
Displays a symbol's price movements over previous years to identify recurring trends.