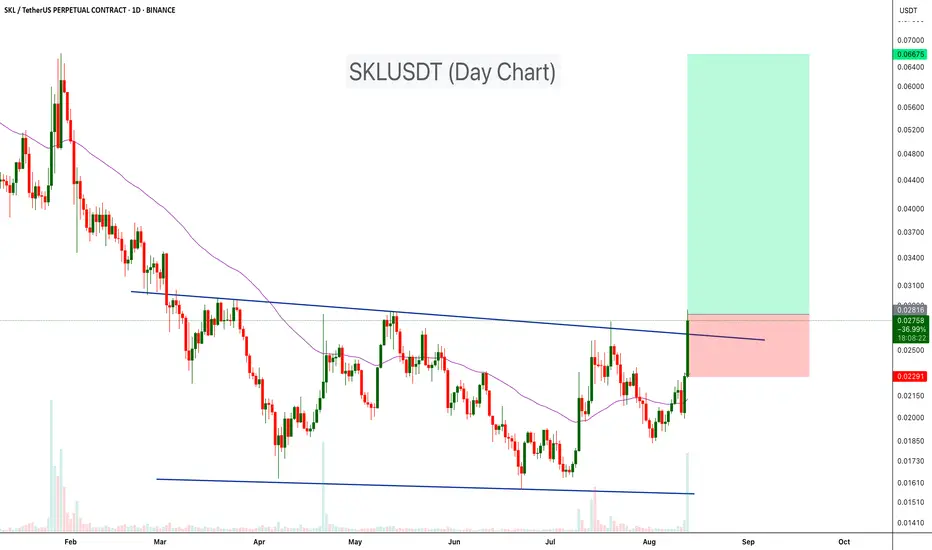
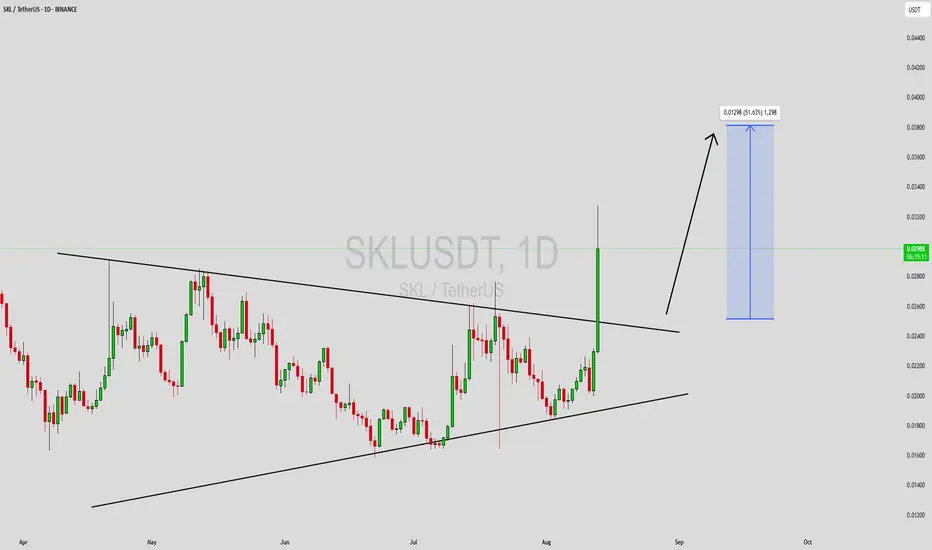
SKLUSDT Signals Potential Trend Reversal!SKLUSDT has broken above a long-standing descending Channel resistance on the daily timeframe. This breakout is backed by a noticeable increase in trading volume, signaling renewed buying interest after months of consolidation.
The chart setup indicates a potential shift in market structure from a prolonged downtrend into an accumulation-to-uptrend phase. If the breakout sustains above the $0.027 level, we could see a 50%–125% move in the coming weeks.
Cheers
Hexa
SKLUSDT trade ideas
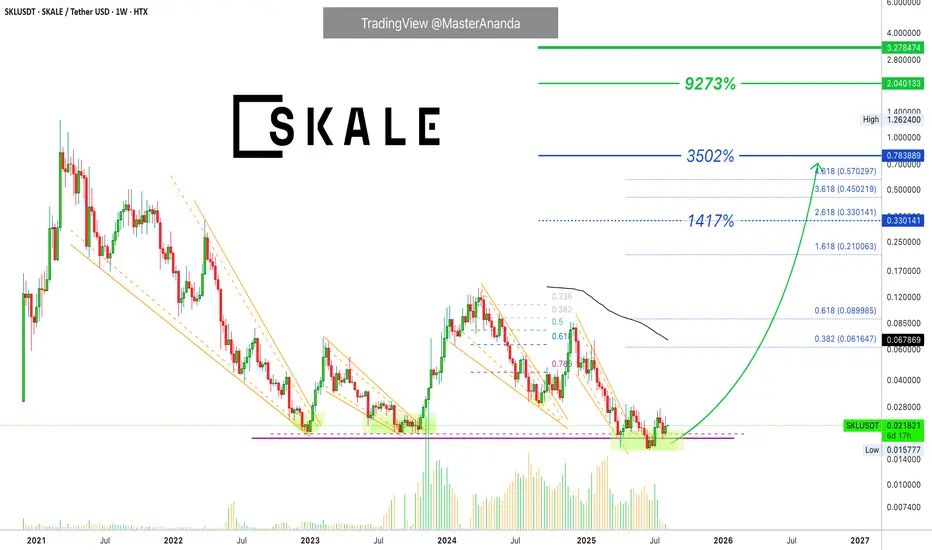
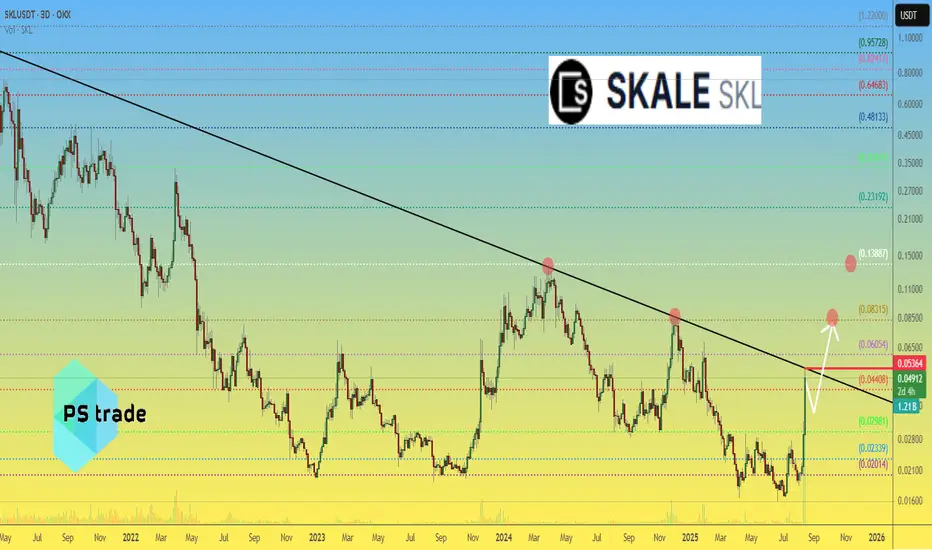
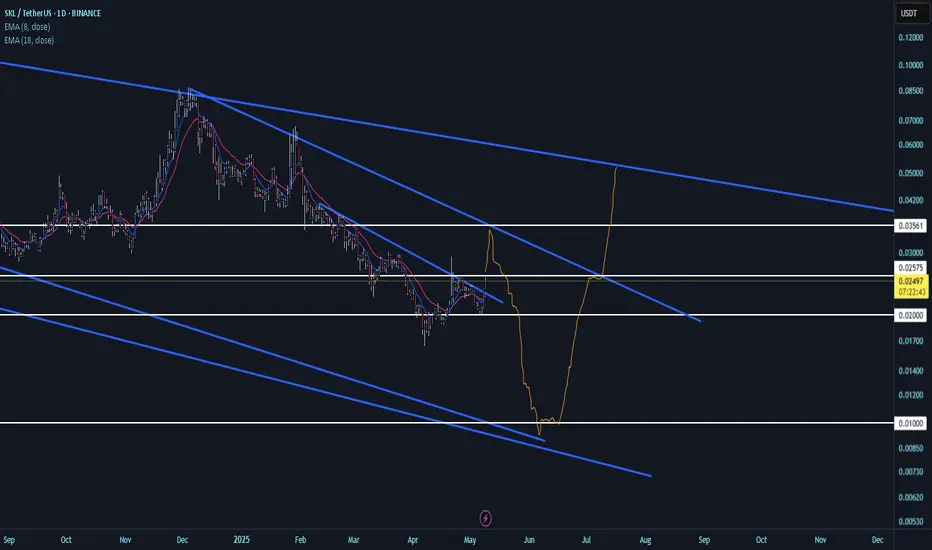
Skale Network 9,000% 2025 Bull Run Potential?Skale Network. Here we have the same support zone from December 2022 and September-October 2023 holding now in April-August 2025. This is the "opportunity buy zone."
SKLUSDT is trading at bottom prices but not a true bottom. The all-time low was set in June and the market already recovered above the long-term December 2022 and Sept.-Oct. 2023 support zone.
Above this zone SKL is truly bullish, specially after the recent move below; the liquidity hunt event. This event always marks the end of a market phase. When it shows up, the market always turns in the opposite direction. We are due a massive wave of growth.
There were three peaks since 2022. It is time for a real bull run.
What will the bull market size be?
We do not have enough data right now because no pair is starting a bear market. Most of the altcoins market is either already growing or recovering from a major support zone. But none are starting a new bear market so it is hard to say.
Some pairs that moved ahead, smaller ones, went beyond all expectations, as usual. This would indicate that the higher numbers are possible but we do not have enough confirmation. It is still early though and we will know weeks before the top is in, sometimes it can be months.
Overall, the bull market will be big and it is better to err on the high end. If you are going to make a mistake, aim high. And buy low.
Namaste.
Unleash Profits: $SKL 4H Trading Breakdown with RSI SurgeBINANCE:SKLUSDT
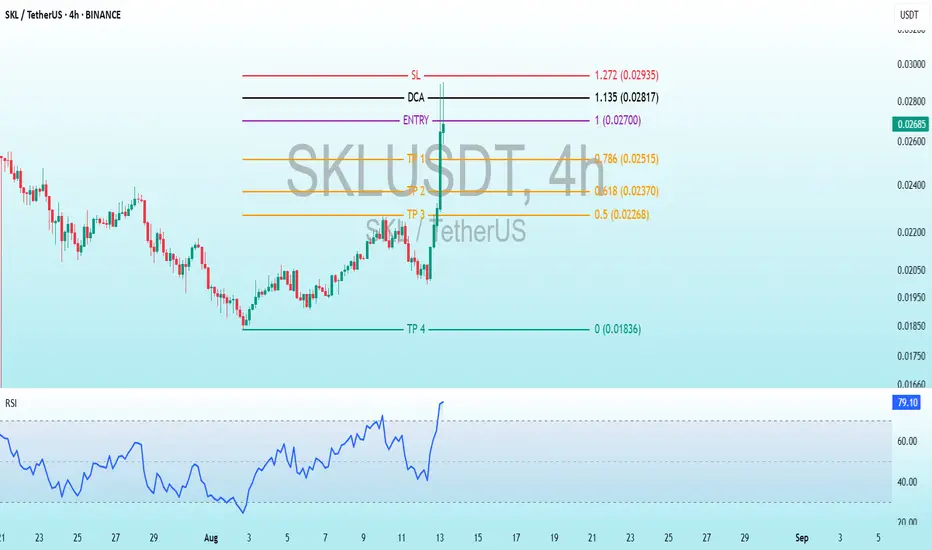
Entry: 1.00 (0.02700 USDT) - The level where the initial purchase is planned.
DCA (Dollar-Cost Averaging): 1.135 (0.02817 USDT) - An additional buying point if the price rises.
SL (Stop Loss): 1.272 (0.02935 USDT) - The level where the loss would be limited.
TP (Take Profit):TP1: 0.786 (0.02515 USDT)
TP2: 0.618 (0.02370 USDT)
TP3: 0.5 (0.02268 USDT)
TP4: 0.013 (0.013 USDT) - An extremely low target, possibly a mistake or a long-term strategy.
RSI (Relative Strength Index) Indicator:
The current RSI value is 78.48, which indicates an overbought zone since it is above 70. This suggests the price may be overextended, and a reversal could occur.
Analysis and Interpretation:
Strategy: The chart uses Fibonacci levels to determine entry, exit, and loss points. The entry is planned at 0.02700, with an additional buying opportunity at 0.02817, and a stop loss at 0.02935 to protect capital.
Profit Targets: The TP1 to TP3 levels are based on Fibonacci ratios (0.786, 0.618, 0.5), suggesting a technical approach to taking profits gradually. TP4 seems unusually low and might be a mistake or a long-term target.
RSI: The high RSI value (79.10) indicates a potential risk of a pullback or correction, especially if the price fails to break the resistance level.
Recommendation:
Monitor the price near the entry level (0.02700) and DCA (0.02817). If the RSI remains above 70 for an extended period, consider a selling opportunity or position adjustment.
Skale SKL price analysis📉 Today, CRYPTOCAP:BTC launched a “red attack” — the daily candle erased the last 3 in a row!
Altcoins are holding surprisingly strong, and #SKL’s price is literally “glued” to the trendline, refusing to give up 😏
No wonder: a trendline break happens either now — with momentum & volume — or the price surrenders to a corrective trend.
📊 OKX:SKLUSDT Plan:
1️⃣ Break and close above $0.054 → only then consider entering a long.
2️⃣ Pullback to ~$0.035 → accumulate positions and aim upward to $0.083 & $0.138.
❓ Could this #SKALE move be fueled by some fundamental news? Share in the comments 👇
🏆 P.S.:
The second corrective wave in alts is often stronger than the first — especially when market sentiment flips to “the pump is over” 😉
⚠️ Disclaimer: This is not financial or investment advice. Opinions are the author’s own. Always DYOR.
________________
◆ Follow us ❤️ for daily crypto insights & updates!
🚀 Don’t miss out on important market moves
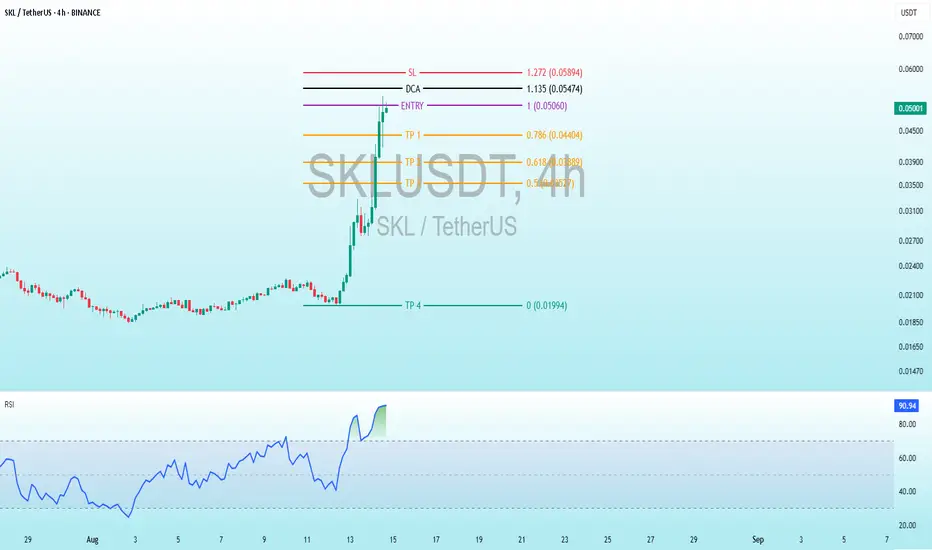
Skyrocketing $SKL 4H Trading Setup with RSI WarningBINANCE:SKLUSDT
Skyrocketing LSE:SKL 4H Trading Setup with RSI Warning
Trading Levels:
Entry: 1.00 (0.05060 USDT) - The level where the initial purchase is planned.
DCA (Dollar-Cost Averaging): 1.135 (0.05474 USDT) - An additional buying point if the price rises.
SL (Stop Loss): 1.272 (0.05894 USDT) - The level where the loss would be limited.
TP (Take Profit):
TP1: 0.786 (0.04040 USDT)
TP2: 0.618 (0.03577 USDT)
TP3: 0.5 (0.03277 USDT)
TP4: 0.0194 (0.0194 USDT) - A significantly lower target, possibly a long-term goal or error.
RSI (Relative Strength Index) Indicator:
The current RSI value is 90.95, which is deeply in the overbought territory (above 70 and nearing 90). This suggests the price may be overextended, indicating a potential reversal or correction soon.
Analysis and Interpretation:
Strategy: The chart uses Fibonacci levels to determine entry, exit, and loss points. The entry is set at 0.05060 USDT, with a DCA at 0.05474 USDT if the price continues to rise, and a stop loss at 0.05894 USDT to protect capital.
Profit Targets: TP1 to TP3 are based on Fibonacci retracement levels (0.786, 0.618, 0.5), indicating a technical approach to taking profits incrementally. TP4 at 0.0194 USDT seems unusually low and might reflect a long-term target or an error.
RSI: The extremely high RSI value (90.95) signals a strong overbought condition. This could imply an imminent pullback or consolidation, especially if the price fails to sustain its recent surge.
Recommendation:
Monitor the price closely around the entry level (0.05060 USDT) and DCA (0.05474 USDT). Given the overbought RSI, exercise caution with new entries or consider preparing for a potential sell-off.
SKLUSDT Forming Descending ChannelSKLUSDT is currently trading within a descending channel pattern, a technical structure that often signals a potential bullish reversal once price breaks above the channel resistance. The steady trading volume indicates active participation from both buyers and sellers, but with the pattern narrowing, the balance is slowly tipping in favor of the bulls. Based on the current chart structure, a confirmed breakout could pave the way for a 40% to 50%+ upside move in the near term.
The price action shows multiple touches on both channel boundaries, confirming the validity of the pattern. Historically, descending channels tend to resolve upward when accompanied by healthy volume, as it signals that accumulation is taking place beneath the surface. A breakout with strong momentum could trigger a rapid push toward the projected profit targets, offering a favorable risk-to-reward ratio for traders positioning early.
Investor sentiment around SKLUSDT is improving, with more market participants taking interest in the project’s potential. This technical setup, combined with rising attention, creates an environment where any bullish catalyst — such as positive news, market-wide rallies, or on-chain developments — could spark a decisive upward move. Monitoring the breakout zone closely will be key to catching this opportunity at the right time.
✅ Show your support by hitting the like button and
✅ Leaving a comment below! (What is You opinion about this Coin)
Your feedback and engagement keep me inspired to share more insightful market analysis with you!
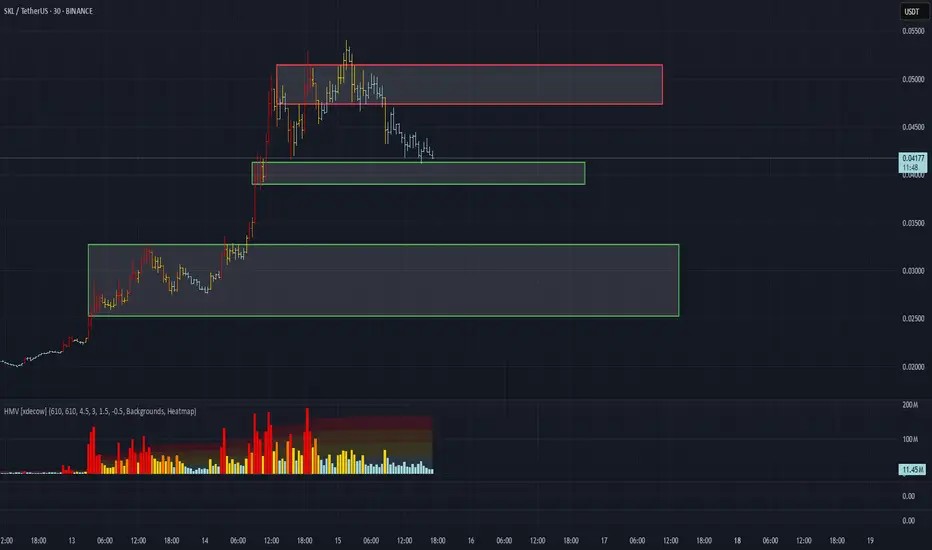
SKL/USDT Analysis — Key Decision Zones
This coin has been among the top gainers over the last three days.
Currently, it is in a correction phase and is approaching the local buy zone at $0.0414–$0.039. Given the weak price action, it is likely that we’ll see a reaction from this zone.
Above the current price, there is also a very important zone at $0.047–$0.0515, with significant volume-based profit-taking already positioned for short bias. Upon a test of this zone and a confirmed reaction, a short position could be considered.
This publication is not financial advice.
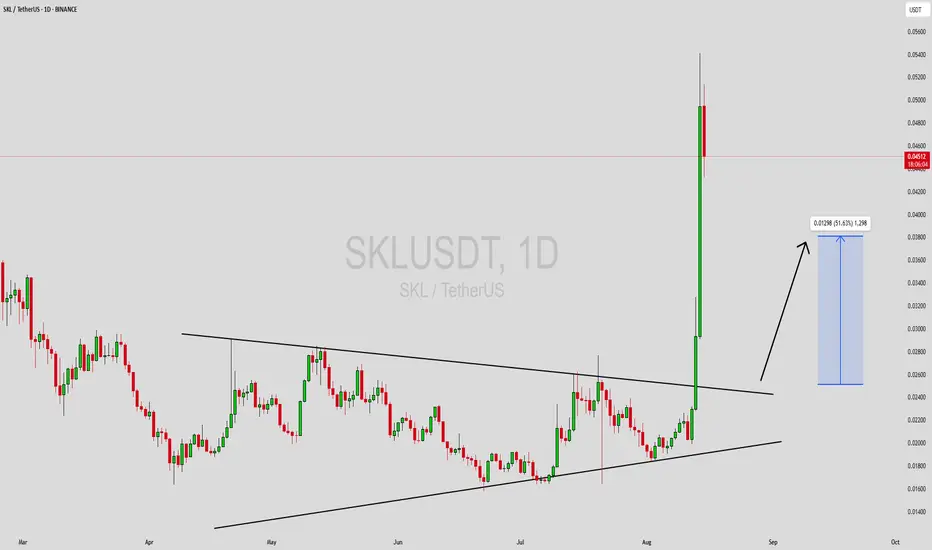
SKLUSDT Forming Bullish PennantSKLUSDT is currently trading within a bullish pennant pattern, a technical structure that often signals a potential bullish reversal once price breaks above the channel resistance. The steady trading volume indicates active participation from both buyers and sellers, but with the pattern narrowing, the balance is slowly tipping in favor of the bulls. Based on the current chart structure, a confirmed breakout could pave the way for a 40% to 50%+ upside move in the near term.
The price action shows multiple touches on both channel boundaries, confirming the validity of the pattern. Historically ,bullish pennants tend to resolve upward when accompanied by healthy volume, as it signals that accumulation is taking place beneath the surface. A breakout with strong momentum could trigger a rapid push toward the projected profit targets, offering a favorable risk-to-reward ratio for traders positioning early.
Investor sentiment around SKLUSDT is improving, with more market participants taking interest in the project’s potential. This technical setup, combined with rising attention, creates an environment where any bullish catalyst — such as positive news, market-wide rallies, or on-chain developments — could spark a decisive upward move. Monitoring the breakout zone closely will be key to catching this opportunity at the right time.
✅ Show your support by hitting the like button and
✅ Leaving a comment below! (What is You opinion about this Coin)
Your feedback and engagement keep me inspired to share more insightful market analysis with you!
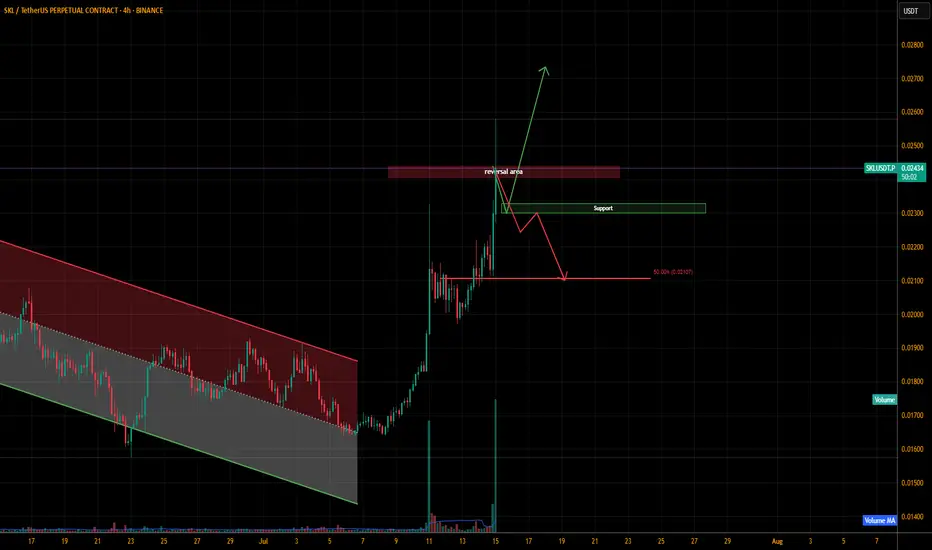
SKLUSDT.PIf we do not see any bullish moment at the support level than we might fall till the second level and if we go till that level than we might making a head and shoulder pattern which can lead the price more lower..
Be careful.. DYOR
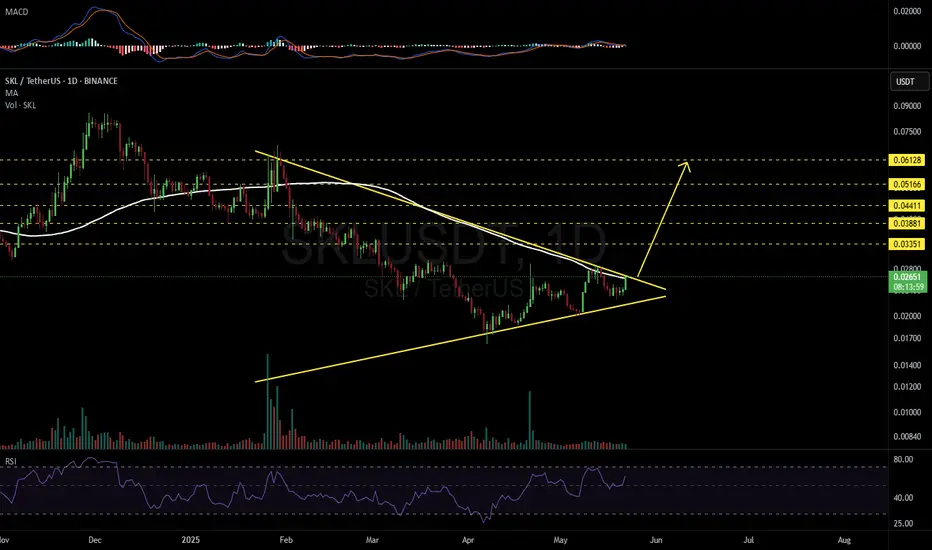
SKLUSDT 1DKeep an eye on the #SKL daily chart. It has formed a symmetrical triangle and is on the verge of breaking out above the triangle resistance and the daily MA100. In case of a breakout, the targets are:
🎯 $0.03351
🎯 $0.03881
🎯 $0.04411
🎯 $0.05166
🎯 $0.06128
⚠️ Use a tight stop-loss.
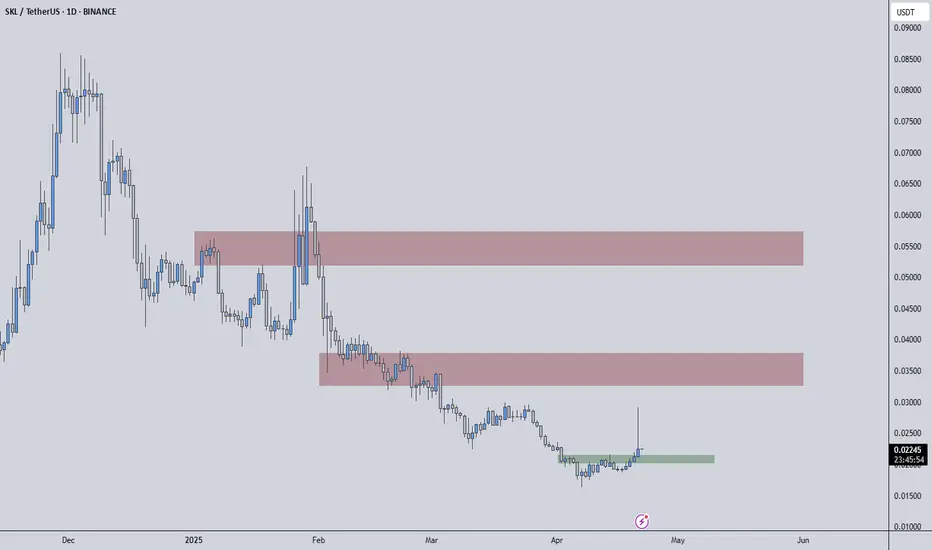
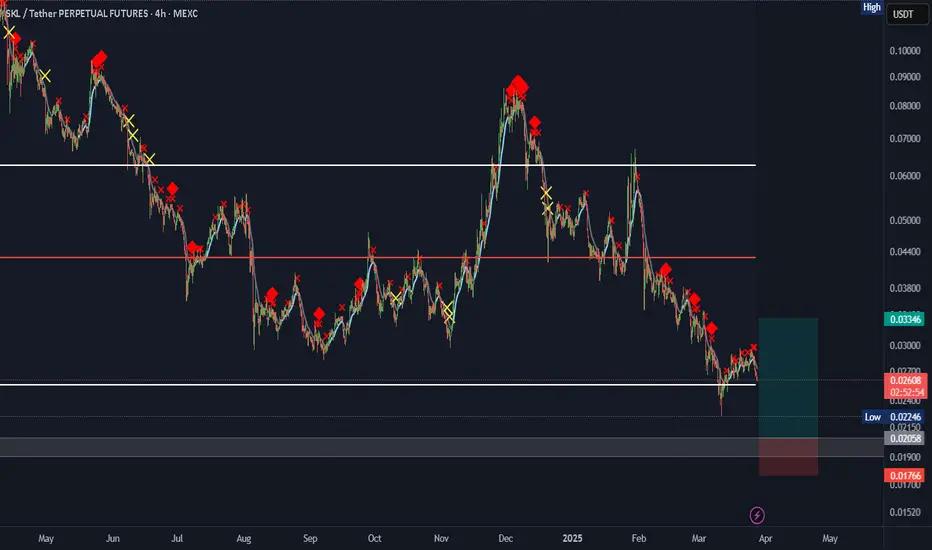
SKLUSDT | +455.6% Volume Surge Signals Big Moves AheadSKLUSDT just recorded a 455.6% jump in trading volume over the last 24 hours. This kind of spike means serious interest is lining up and price is gearing up for its next decisive move.
Key Zones on the Chart
Red Boxes = Strong Resistance
These areas have tested price multiple times and held firm. Sellers are likely waiting here to defend their positions.
Green Box = Support Zone
Buyers have stepped in around this level before. If you’re willing to take more risk, a bounce here with a clean low‑time‑frame breakout could make for an aggressive long entry.
My Current Bias
I still lean short around the red boxes. Targeting a move lower here is less risky compared with other setups.
If you prefer higher risk, you can consider longs at the green box—but only if you see clear confirmation on the lower time frames.
Risk Control and Confirmation
Short Entries require lower‑time‑frame breakdowns confirmed by CDV shifts.
I will not insist on a short bias if SKLUSDT breaks above resistance without a valid downward break on the low time frame. In that case, I pass.
If price breaks up with volume and retests, I’ll flip to a long bias and look for entries.
Use stops just above the red boxes or below the green box to keep risk defined.
This setup is based on real volume and price behavior, not guesswork. Stay patient, wait for confirmations, and let the market validate each move. Follow these levels and you’ll capture trades with confidence rather than chasing losses.
📌I keep my charts clean and simple because I believe clarity leads to better decisions.
📌My approach is built on years of experience and a solid track record. I don’t claim to know it all but I’m confident in my ability to spot high-probability setups.
📌If you would like to learn how to use the heatmap, cumulative volume delta and volume footprint techniques that I use below to determine very accurate demand regions, you can send me a private message. I help anyone who wants it completely free of charge.
🔑I have a long list of my proven technique below:
🎯 ZENUSDT.P: Patience & Profitability | %230 Reaction from the Sniper Entry
🐶 DOGEUSDT.P: Next Move
🎨 RENDERUSDT.P: Opportunity of the Month
💎 ETHUSDT.P: Where to Retrace
🟢 BNBUSDT.P: Potential Surge
📊 BTC Dominance: Reaction Zone
🌊 WAVESUSDT.P: Demand Zone Potential
🟣 UNIUSDT.P: Long-Term Trade
🔵 XRPUSDT.P: Entry Zones
🔗 LINKUSDT.P: Follow The River
📈 BTCUSDT.P: Two Key Demand Zones
🟩 POLUSDT: Bullish Momentum
🌟 PENDLEUSDT.P: Where Opportunity Meets Precision
🔥 BTCUSDT.P: Liquidation of Highly Leveraged Longs
🌊 SOLUSDT.P: SOL's Dip - Your Opportunity
🐸 1000PEPEUSDT.P: Prime Bounce Zone Unlocked
🚀 ETHUSDT.P: Set to Explode - Don't Miss This Game Changer
🤖 IQUSDT: Smart Plan
⚡️ PONDUSDT: A Trade Not Taken Is Better Than a Losing One
💼 STMXUSDT: 2 Buying Areas
🐢 TURBOUSDT: Buy Zones and Buyer Presence
🌍 ICPUSDT.P: Massive Upside Potential | Check the Trade Update For Seeing Results
🟠 IDEXUSDT: Spot Buy Area | %26 Profit if You Trade with MSB
📌 USUALUSDT: Buyers Are Active + %70 Profit in Total
🌟 FORTHUSDT: Sniper Entry +%26 Reaction
🐳 QKCUSDT: Sniper Entry +%57 Reaction
📊 BTC.D: Retest of Key Area Highly Likely
📊 XNOUSDT %80 Reaction with a Simple Blue Box!
📊 BELUSDT Amazing %120 Reaction!
I stopped adding to the list because it's kinda tiring to add 5-10 charts in every move but you can check my profile and see that it goes on..
SKLUSDT 1W AnalysisSKL ~ 1W Analysis
#SKL Buy gradually from here with a short -term target of at least 20%+. This is the lowest support for now.
SKL LONG SETUPALL trading ideas have entry point + stop loss + take profit + Risk level.
hello Traders, here is the full analysis for this pair, let me know in the comment section below if you have any questions, the entry will be taken only if all rules of the strategies will be satisfied. I suggest you keep this pair on your watchlist and see if the rules of your strategy are satisfied. Please also refer to the Important Risk Notice linked below.
Disclaimer
#SKL/USDT#SKL
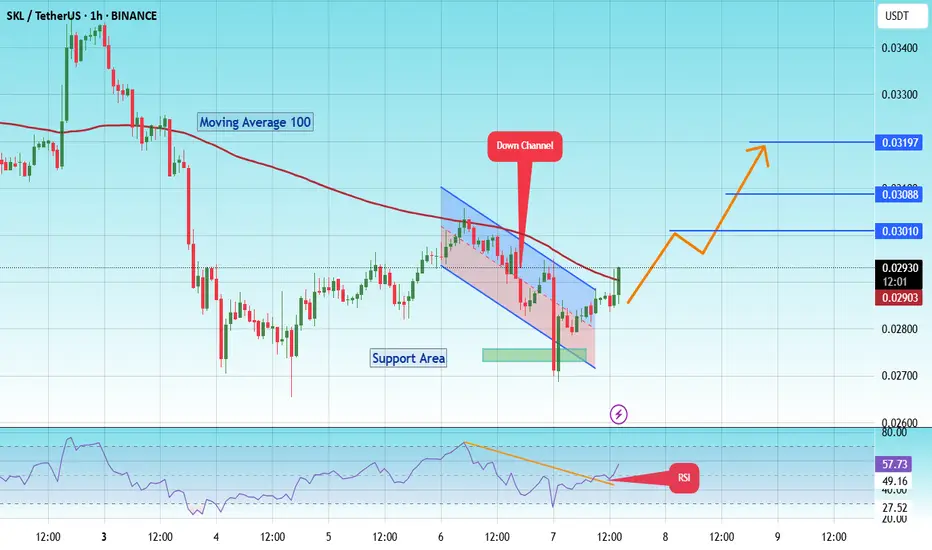
The price is moving in a descending channel on the 1-hour frame and is expected to continue upwards
We have a trend to stabilize above the moving average 100 again
We have a descending trend on the RSI indicator that supports the rise by breaking it upwards
We have a support area at the lower limit of the channel at a price of 0.02733
Entry price 0.02916
First target 0.03010
Second target 0.03090
Third target 0.03200
On a Different SKALE: SKL Analysis!Hello TradingView Family / Fellow Traders. This is Richard, also known as theSignalyst.
📈SKL has been in a correction phase trading within the falling red wedge pattern and it is currently retesting the lower bound of it.
Moreover, the green zone is a strong support.
🏹 Thus, the highlighted blue circle is a strong area to look for buy setups as it is the intersection of support and lower red trendline acting as a non-horizontal support.
📚 As per my trading style:
As #SKL is around the blue circle, I will be looking for bullish reversal setups (like a double bottom pattern, trendline break , and so on...)
📚 Always follow your trading plan regarding entry, risk management, and trade management.
Good luck!
All Strategies Are Good; If Managed Properly!
~Rich

Long According to the analysis of the waves and the use of the Gann method and price data analysis, it seems that we can expect the price to return to the ranges specified on the chart.
This analysis is only my personal opinion. Please do not set your own trading criteria and act based on your personal strategy.
Be successful and profitable
(Translated by google)
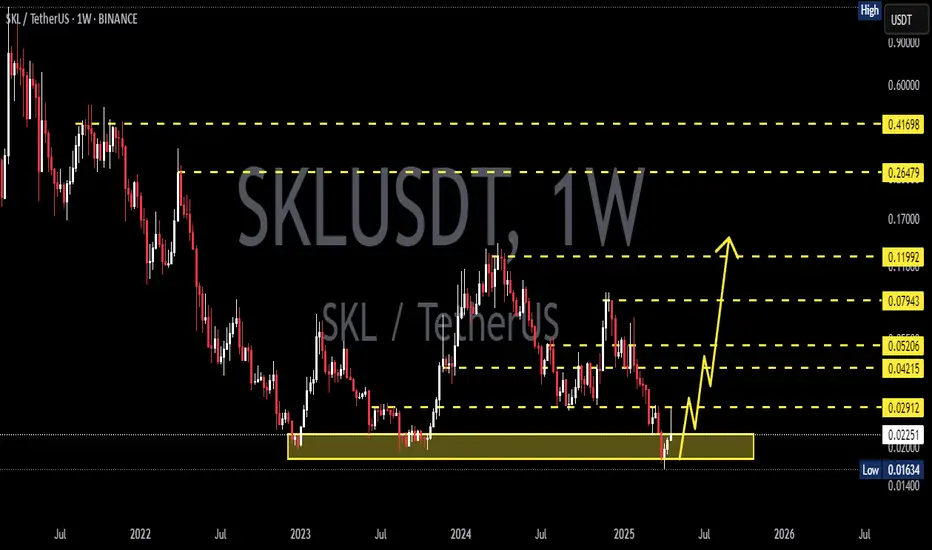
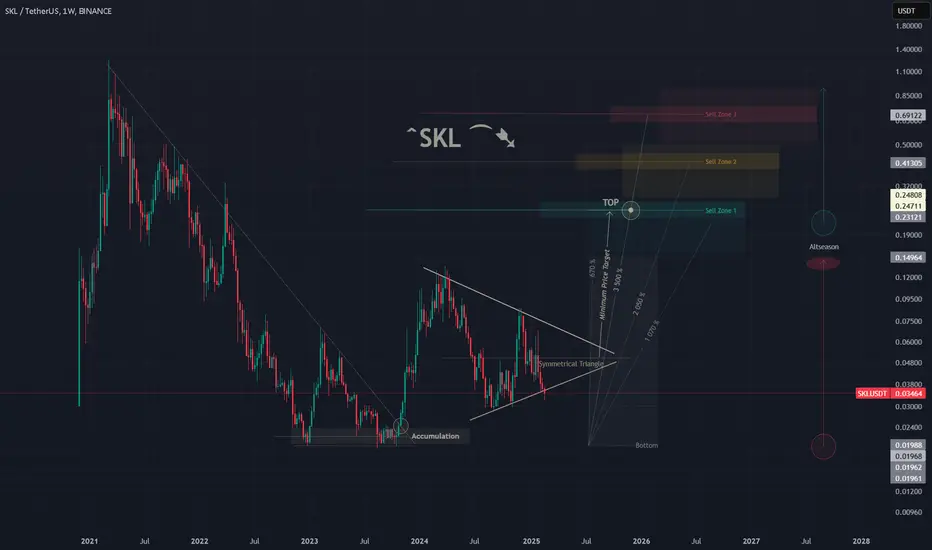
SKL/USDT 1W 🩸 SKL ⁀➷
#SkaleNetwork. Macro chart Another
💯 Intermediate Target - $0.15
🚩 Macro Target 1 - $0.24
🚩 Macro Target 2 - $0.41
🚩 Macro Target 3 - $0.69
- Not financial advice, trade with caution.
#Crypto #SkaleNetwork #SKL #Investment
✅ Stay updated on market news and developments that may influence the price of Skale Network. Positive or negative news can significantly impact the cryptocurrency's value.
✅ Exercise patience and discipline when executing your trading plan. Avoid making impulsive decisions driven by emotions, and adhere to your strategy even during periods of market volatility.
✅ Remember that trading always involves risk, and there are no guarantees of profit. Conduct thorough research, analyze market conditions, and be prepared for various scenarios. Trade only with funds you can afford to lose and avoid excessive risk-taking.
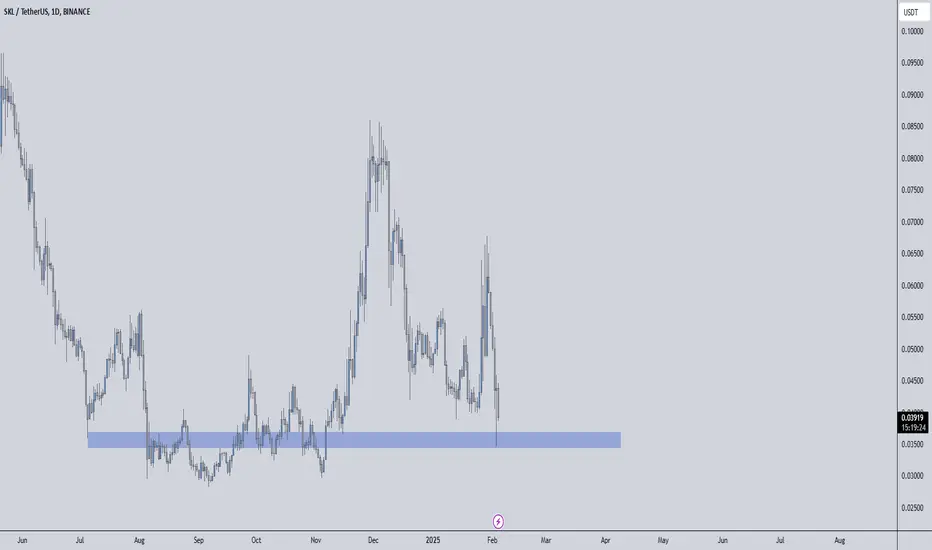
SKLUSDT 1WSKL ~ 1W Analysis
#SKL If you still have a Conviction on this coin,. Maybe this support block will be a very good place of buy for now.

Long-Term Investors – These Are Prime Buy Zones! “Listen, if you’re thinking long-term, stop overcomplicating it. These are great accumulation zones – whether it’s the blue box or just around these levels, it doesn’t really matter. Small details don’t make big money!”
Why I Like This Setup:
Strong Buy Zones – Price is in an ideal range for accumulation, and long-term investors could see massive returns from these levels.
CDV + Volume Profile Matter – If lower time frame breakouts confirm, this becomes an even stronger entry.
Don’t Miss the Bigger Picture – People worry too much about tiny differences. If the macro setup is strong, that’s all that counts!
Final Thoughts:
“I’m tracking CDV, volume profile, and liquidity heatmap closely. The setup is there, the opportunity is real, and long-term buyers might look back at this as an absolute steal!”
Don’t overthink it – just position smartly and let the market do the work! 🚀🔥
Let me tell you, this is something special. These insights, these setups—they’re not just good; they’re game-changers. I've spent years refining my approach, and the results speak for themselves. People are always asking, "How do you spot these opportunities?" It’s simple: experience, clarity, and a focus on high-probability moves.
Want to know how I use heatmaps, cumulative volume delta, and volume footprint techniques to find demand zones with precision? I’m happy to share—just send me a message. No cost, no catch. I believe in helping people make smarter decisions.
Here are some of my recent analyses. Each one highlights key opportunities:
🚀 RENDERUSDT: Strategic Support Zones at the Blue Boxes +%45 Reaction
🎯 PUNDIXUSDT: Huge Opportunity | 250% Volume Spike - %60 Reaction Sniper Entry
🌐 CryptoMarkets TOTAL2: Support Zone
🚀 GMTUSDT: %35 FAST REJECTION FROM THE RED BOX
🎯 ZENUSDT.P: Patience & Profitability | %230 Reaction from the Sniper Entry
🎯 DEXEUSDT %180 Reaction with %9 Stop
🐶 DOGEUSDT.P: Next Move
🎨 RENDERUSDT.P: Opportunity of the Month
💎 ETHUSDT.P: Where to Retrace
🟢 BNBUSDT.P: Potential Surge
📊 BTC Dominance: Reaction Zone
🌊 WAVESUSDT.P: Demand Zone Potential
🟣 UNIUSDT.P: Long-Term Trade
🔵 XRPUSDT.P: Entry Zones
🔗 LINKUSDT.P: Follow The River
📈 BTCUSDT.P: Two Key Demand Zones
🟩 POLUSDT: Bullish Momentum
🌟 PENDLEUSDT.P: Where Opportunity Meets Precision
🔥 BTCUSDT.P: Liquidation of Highly Leveraged Longs
🌊 SOLUSDT.P: SOL's Dip - Your Opportunity
🐸 1000PEPEUSDT.P: Prime Bounce Zone Unlocked
🚀 ETHUSDT.P: Set to Explode - Don't Miss This Game Changer
🤖 IQUSDT: Smart Plan
⚡️ PONDUSDT: A Trade Not Taken Is Better Than a Losing One
💼 STMXUSDT: 2 Buying Areas
🐢 TURBOUSDT: Buy Zones and Buyer Presence
🌍 ICPUSDT.P: Massive Upside Potential | Check the Trade Update For Seeing Results
🟠 IDEXUSDT: Spot Buy Area | %26 Profit if You Trade with MSB
📌 USUALUSDT: Buyers Are Active + %70 Profit in Total
🌟 FORTHUSDT: Sniper Entry +%26 Reaction
🐳 QKCUSDT: Sniper Entry +%57 Reaction
📊 BTC.D: Retest of Key Area Highly Likely
This list? It’s just a small piece of what I’ve been working on. There’s so much more. Go check my profile, see the results for yourself. My goal is simple: provide value and help you win. If you’ve got questions, I’ve got answers. Let’s get to work!
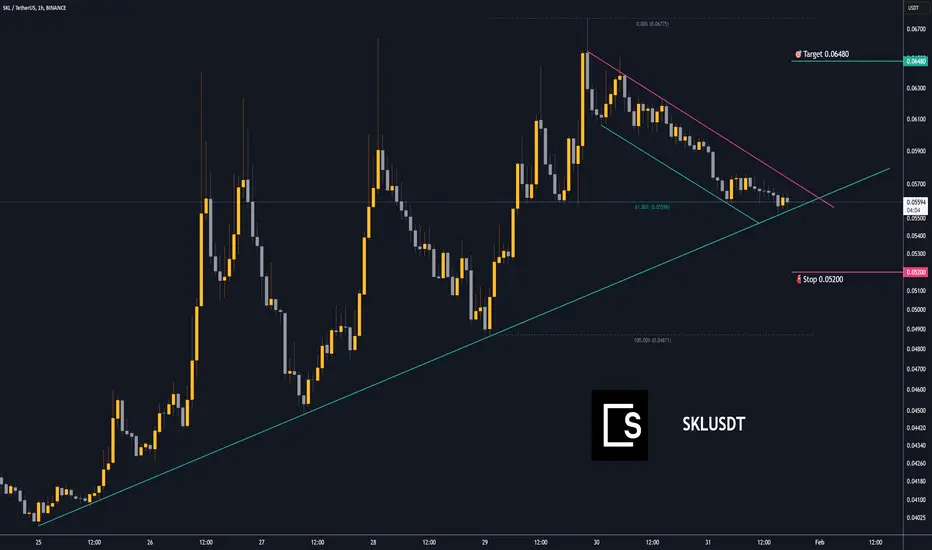
Trading opportunity for SKLUSDTBased on technical factors there is a Buy position in :
📊 SKLUSDT
🔵 Buy Now or by Downtrend Breakout
🪫Stop loss 0.05200
🔋Target 0.06480
📏 R/R 2,4
💸RISK : 1%
We hope it is profitable for you ❤️
Please support our activity with your likes👍 and comments📝
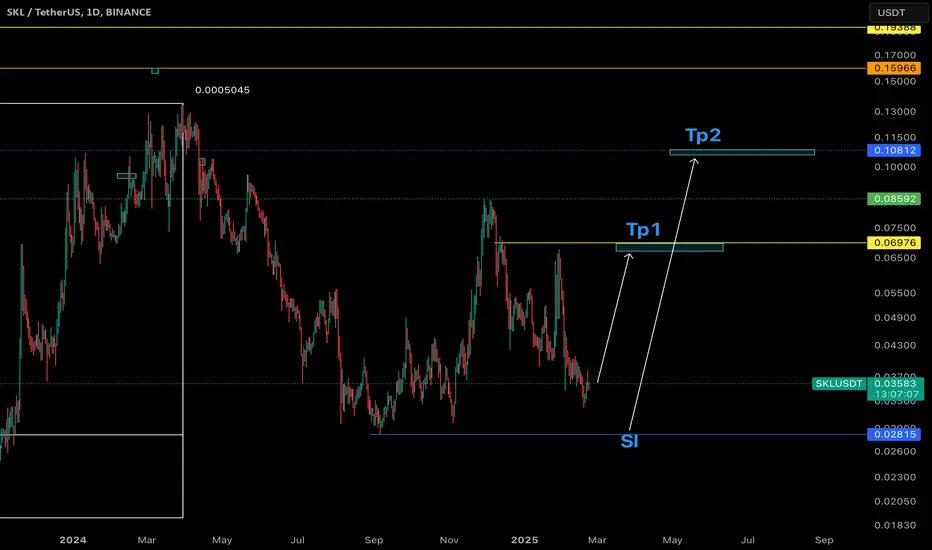
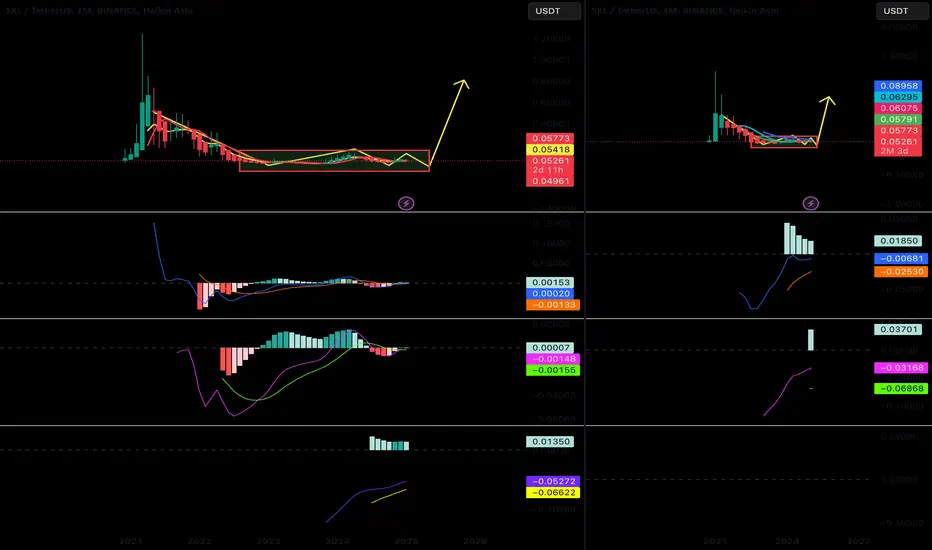
Prepare to BUY Spot SKLUSDT (M & 3M Cycle Combination)🚀 Prepare to BUY Spot SKLUSDT (M & 3M Cycle Combination)
🌟 SKLUSDT has been in accumulation since 2022 – Now is the time for a breakout! 🌟
🌍 Market Overview:
After a prolonged accumulation phase from 2022, SKLUSDT is now showing signs of preparing for a strong move in the M & 3M cycles. This marks a strategic entry point for long-term investors looking to capitalize on the next expansion phase.
📊 Trade Plan:
📌 Entry Point:
$0.057 or lower – An optimal accumulation range for maximizing returns.
🎯 Target:
x5 - x8 potential growth as the cycle plays out.
⏳ Hold Time:
Throughout 2025, aligning with the anticipated long-term uptrend.
💡 Note:
Accumulate progressively within the suggested price zone for the best positioning.
Keep an eye on market confirmations and breakout signals.
Patience and strategic holding will be key to maximizing profits.
🔥 SKLUSDT is on the verge of a massive breakout – Don't miss this golden opportunity! 🔥
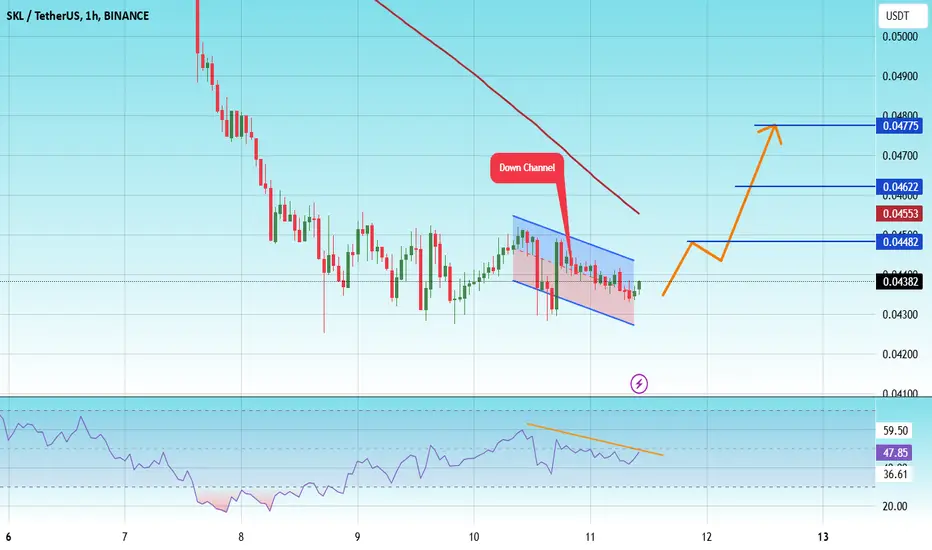
#SKL/USDT#SKL
The price is moving in a descending channel on the 1-hour frame and is expected to continue upwards
We have a trend to stabilize above the moving average 100 again
We have a descending trend on the RSI indicator that supports the rise by breaking it upwards
We have a support area at the lower limit of the channel at a price of 0.04324
Entry price 0.04380
First target 0.04482
Second target 0.04622
Third target 0.04775