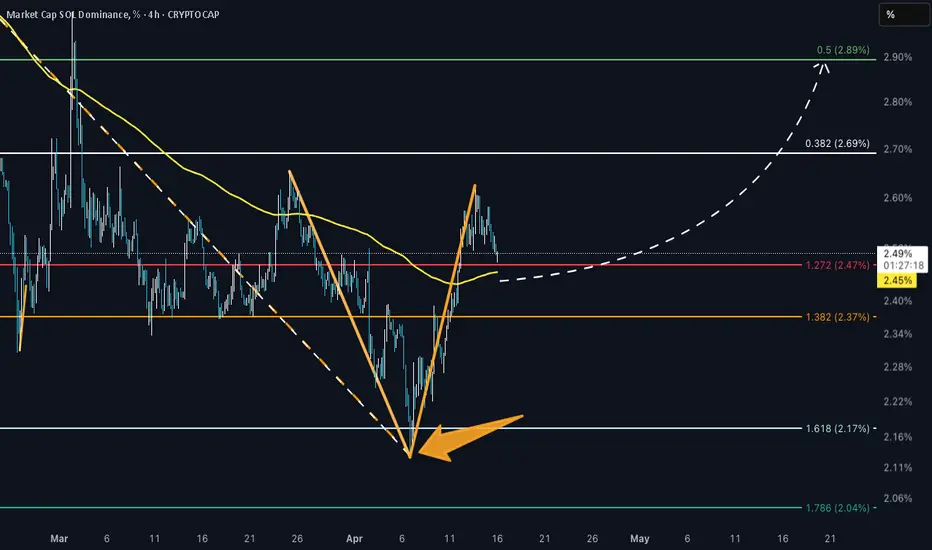
SOL.D 'V' Shape Recovery CRYPTOCAP:SOL.D
SOL.D tagged the high time frame 1.618 and has now formed a 'V' shaped recovery.
Price is currently on top of the 1:1.272 ratio band and sitting tight slightly above the 200 EMA. This area could turn into support here.
This suggests a nice wave up in the works for SOL and SOL
Key data points
Previous close
—
Open
—
Day's range
—
About Market Cap SOL Dominance, %
Coin
SOL.D - Windows in WindowsCRYPTOCAP:SOL.D
A retracement down to the 200 EMA suggests this is closing in on a bottom for this wave.
Essentially this is a 1:1 Golden Window 3 wave correction inside a larger TF 1:1 GW extension.
Next wave up coming soon for SOL. 👍
- Not Financial Advice -

SOL Dominance Its so OverAfter successfully break wedge and failed to retest back above line
this is indicator if trend reversal continuation will see 1.7 - 2% SOL Dominance

WARNING - SOLANA IS DEAD MartyBoots here , I have been trading for 17 years and sharing my thoughts on SOL here.
SOL is looking like ETH did last bull market
Do not miss out on SOL if it breaks down as this is a great opportunity to get out of the market and protect yourself
Watch video for more details

SOL.D for 2025Based on SOL.D pattern formation CRYPTOCAP:SOL Dominance will rise give CRYPTOCAP:SOL based Alts & MEME coins huge gain potential for bull run 2025

$SOL Dominance Weekly BREAKOUT vs $BTC DominanceAdding onto my SOL/BTC chart from yesterday.
SOL.D is also confirming the breakout vs BTC.D
Everything is SCREAMING for CRYPTOCAP:SOL to RIP!
$SOL vs $ETH MCPublishing this to track this chart
Is a chart of SOL Market Cap dominance over ETH Market Cap dominance
A VERY bullish chart and classic uptrending chart, following supports/resistances, while playing respects to fibs.
Right now CRYPTOCAP:SOL is at 17% the market cap of CRYPTOCAP:ETH , expect

Solana Dominance to 10% in given timeSimplicity is key here, this is the current situation
BTC dominance - 54%
ETH dominance - 16%
SOL dominance - 3%
However..
- SOL surpassed ETH for daily active users (more people use SOL than ETH on a daily basis for trading coins and jpegs).
- SOL has the highest amount of value flowing in it comi

SOL.D COULD REACH 11.55% - 14.47% 2025/2026This is an updated version of my first Sol.D idea.
I've studied all top 50 alt dominance behaviour, paying attention to ETH.D behaviour and market cap, BTC.D (which may end up holding 25%) SOlBTC and SOLETH.
All scenarios tells the same story, ETH is on a downtrend just as BTC, all fibonacci chan
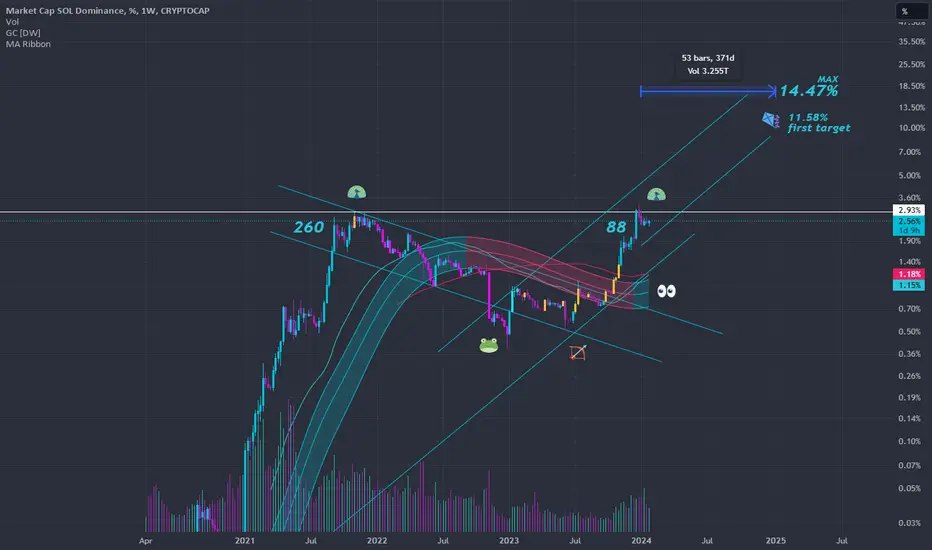
SOL IS LEADING ALTS NOT ETH + SOL.D 14.47% TARGET 2025Comparing behaviour_
ETHBTC SOLETH LTCBTC SOL.D ETH.D BTC.D SOLBTC XLM.D XRP.D DOT.D LINK.D ADA.D I CONCLUDE:
SOL is overtaking ETH and ascending to 14.47% dominance by 2025 regards ANY narrative / tech / advantage / anything but the charts, oscillators and benchamark top 50 projects against btc.

See all ideas
Summarizing what the indicators are suggesting.
Oscillators
Neutral
SellBuy
Strong sellStrong buy
Strong sellSellNeutralBuyStrong buy
Oscillators
Neutral
SellBuy
Strong sellStrong buy
Strong sellSellNeutralBuyStrong buy
Summary
Neutral
SellBuy
Strong sellStrong buy
Strong sellSellNeutralBuyStrong buy
Summary
Neutral
SellBuy
Strong sellStrong buy
Strong sellSellNeutralBuyStrong buy
Summary
Neutral
SellBuy
Strong sellStrong buy
Strong sellSellNeutralBuyStrong buy
Moving Averages
Neutral
SellBuy
Strong sellStrong buy
Strong sellSellNeutralBuyStrong buy
Moving Averages
Neutral
SellBuy
Strong sellStrong buy
Strong sellSellNeutralBuyStrong buy
Displays a symbol's price movements over previous years to identify recurring trends.