SOL.D 'V' Shape Recovery CRYPTOCAP:SOL.D
SOL.D tagged the high time frame 1.618 and has now formed a 'V' shaped recovery.
Price is currently on top of the 1:1.272 ratio band and sitting tight slightly above the 200 EMA. This area could turn into support here.
This suggests a nice wave up in the works for SOL and SOL based meme coins. 👍
- Not Financial Advice -
SOL.D trade ideas
SOL.D - Windows in WindowsCRYPTOCAP:SOL.D
A retracement down to the 200 EMA suggests this is closing in on a bottom for this wave.
Essentially this is a 1:1 Golden Window 3 wave correction inside a larger TF 1:1 GW extension.
Next wave up coming soon for SOL. 👍
- Not Financial Advice -

SOL Dominance Its so OverAfter successfully break wedge and failed to retest back above line
this is indicator if trend reversal continuation will see 1.7 - 2% SOL Dominance

WARNING - SOLANA IS DEAD MartyBoots here , I have been trading for 17 years and sharing my thoughts on SOL here.
SOL is looking like ETH did last bull market
Do not miss out on SOL if it breaks down as this is a great opportunity to get out of the market and protect yourself
Watch video for more details

SOL.D for 2025Based on SOL.D pattern formation CRYPTOCAP:SOL Dominance will rise give CRYPTOCAP:SOL based Alts & MEME coins huge gain potential for bull run 2025

$SOL Dominance Weekly BREAKOUT vs $BTC DominanceAdding onto my SOL/BTC chart from yesterday.
SOL.D is also confirming the breakout vs BTC.D
Everything is SCREAMING for CRYPTOCAP:SOL to RIP!
$SOL vs $ETH MCPublishing this to track this chart
Is a chart of SOL Market Cap dominance over ETH Market Cap dominance
A VERY bullish chart and classic uptrending chart, following supports/resistances, while playing respects to fibs.
Right now CRYPTOCAP:SOL is at 17% the market cap of CRYPTOCAP:ETH , expecting this to reach minimum 33% at the 2.618 fib, 50% target after that at the 3.618 fib)
Fundamentally, more on-chain activity is happening on CRYPTOCAP:SOL , retails mindshare is on CRYPTOCAP:SOL , 0 fees, instant transactions are the future.
A classic case of fundamentals and technicals coming together, typically strong confluence indicator in $crypto.
If you have been following me these past couple years, I called CRYPTOCAP:SOL at $8 as the bottom and was accumulating heavy under $20. I believe CRYPTOCAP:SOL reaches minimum $250B market cap this cycle or $500+ as a very conservative target (see my other charts published).
gl hf
-@CryptoCurb

Solana Dominance to 10% in given timeSimplicity is key here, this is the current situation
BTC dominance - 54%
ETH dominance - 16%
SOL dominance - 3%
However..
- SOL surpassed ETH for daily active users (more people use SOL than ETH on a daily basis for trading coins and jpegs).
- SOL has the highest amount of value flowing in it coming from other chains.
- Total Value Locked in the SOL ecosystem is breaking all time highs every day, showing people adopting supporting and trusting SOL defi protocols.
- Both SOLvs.BTC and SOLvs.ETH Charts are sitting are fighting to break ATH.
- SOL is a one-man-show kind of chain, no Layer 2's needed. Which is good because nobody wants to use a chain that requires bridging assets to different layers.
SOL is the consensus trade of this bull run, 10% is my final target for SOL dominance.

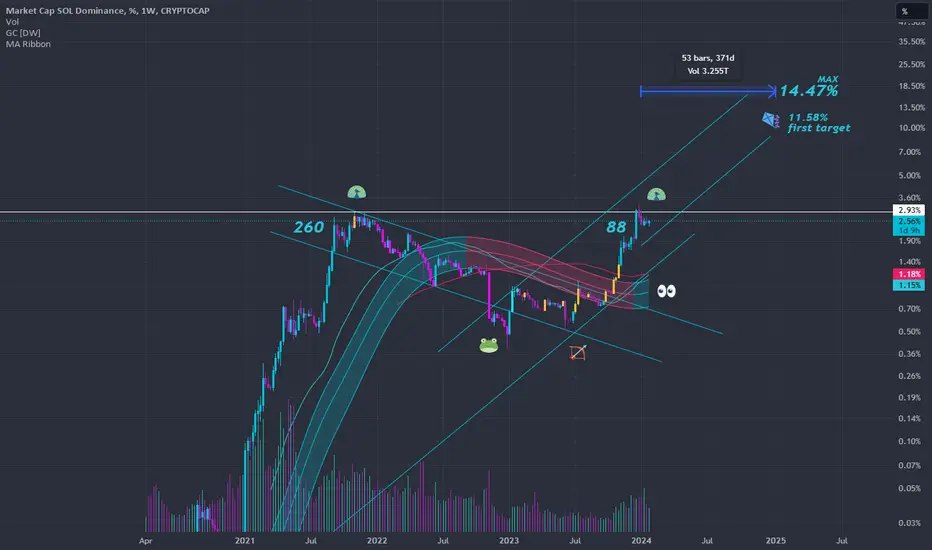
SOL.D COULD REACH 11.55% - 14.47% 2025/2026This is an updated version of my first Sol.D idea.
I've studied all top 50 alt dominance behaviour, paying attention to ETH.D behaviour and market cap, BTC.D (which may end up holding 25%) SOlBTC and SOLETH.
All scenarios tells the same story, ETH is on a downtrend just as BTC, all fibonacci channels are doing the same, and all attention is setup to ETHBTC as the altcoin leader.
But my take is, that is going to change, while all attention was on eth and critic eclipse sol, it's dominance has reached ATH with half the top market cap 2021.
I will consider my target reached, past 9% but 11.55% is needed to be the min. my first projection stablished.
At 7T total market cap, Sol would need 770b Market Cap.
Happy Harvest.
CRYPTOCAP:SOL.D
SOL IS LEADING ALTS NOT ETH + SOL.D 14.47% TARGET 2025Comparing behaviour_
ETHBTC SOLETH LTCBTC SOL.D ETH.D BTC.D SOLBTC XLM.D XRP.D DOT.D LINK.D ADA.D I CONCLUDE:
SOL is overtaking ETH and ascending to 14.47% dominance by 2025 regards ANY narrative / tech / advantage / anything but the charts, oscillators and benchamark top 50 projects against btc.
SOL is the only project from 2021 reaching ATH Dominance with 2021's Market Cap.
I cannot compare any other project regards it's age, measurement is made agains top runners on dominance past cycles vs USD & BTC.
Most pay attention to ETHBTC relationship, my take is, SOL is leading ALTCOINS now, not ETH.
Happy Harvest.
AE

SOL.D mega dump is comingI think Solana's last move is a weekly fake breakout. Dominance Solana is extremely risky in the weekly, daily and 4-hour time frames. be careful.

Long SOLANAEvery time when I look at this chart of SOLANA, I feel like meeting with my long earned crush. Big big long for Solana when it is going to occupy 5% of the total crypto market, can you imagine?

$SOL SOL DOM (SOLANA DOMINANCE) - breakout?Looking at SOL.D
looks like a clean breakout
we can retrace the resistance trendline and notice 1 last line left (subject to perspective of course)
I imagine the first test of this line could get a rejection so if your long SOL, take some profits along the way and set your stop loss or trail your stop loss accordingly.
Not much 'analysis' to provide here as its a dominance chart, just basic trendlines work best on these charts (I find)
We've been bullish on SOL over this past year as well, its been holding off the lows quite well and the bounces of the pullbacks are very impulsive. Candles indicate VERY aggressive trading on way up AND on way down, favoring big money trading SOL very heavily.
I do suspect that even if BTC dumps again (eventually it will), I believe SOL will bounce impulsively each time with very aggressive reactions.
Volatility = Opportunity aka "Volaturnity"
Check out my in-depth analysis on SOL showing wave counts, calculated targets, potential scenarios providing both bullish and bearish views to help us all bank profits on the explosive SOL
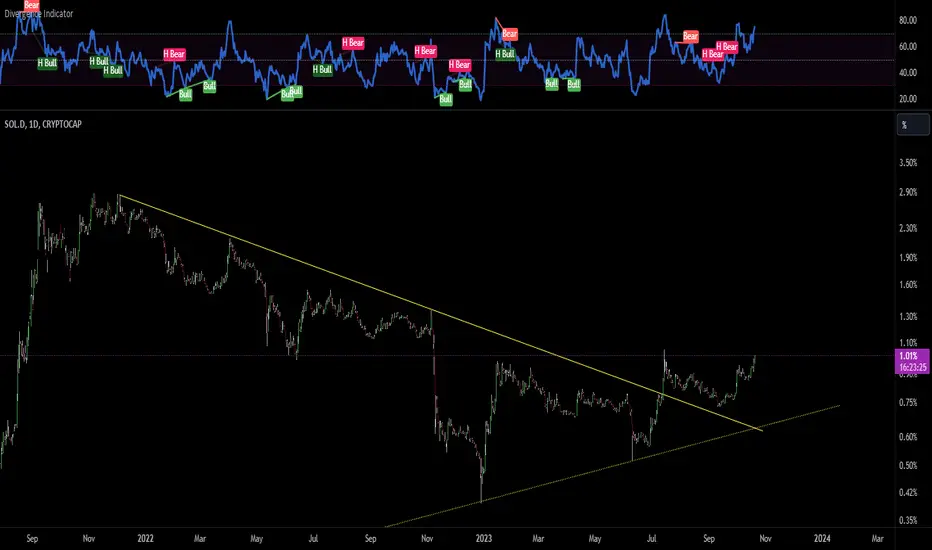

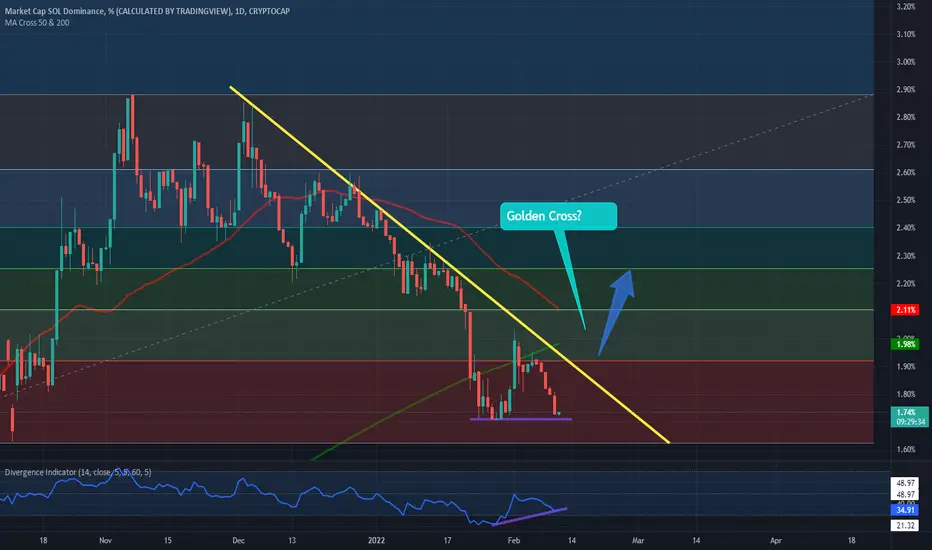
SOL.D Ready for the come back?SOL.D has been declining against that trendline since the peak.
Bullish divergence on the daily. Watch for the next few days to migrate back to the trendline. Then watch for exist.
MA 50/200 may cross and confirm bullish rally has begun.
Good Luck