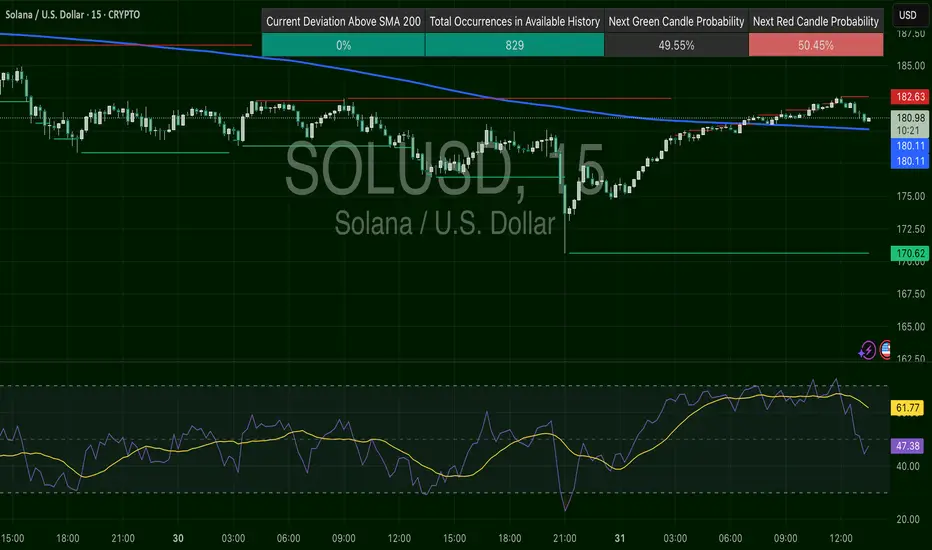
SOLUSD – Faded Highs, Now RetestingSOL recovered off the $170–172 lows and is now testing $182.63 resistance. RSI was high and now cooling off (~47), suggesting momentum is slowing. Still trading just over the 200 SMA, this is a breakout pullback zone. $180.13 is the key level to stay above.
SOLANA trade ideas
Very Bullish!!
Solana chart looks very bullish. The price is currently dropping but I think it is a very healthy correction.
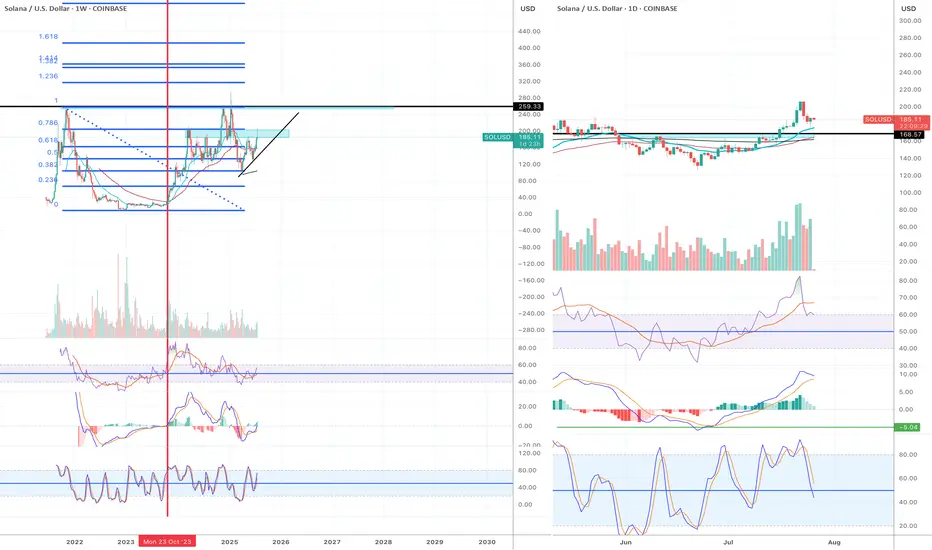
Weekly chart:
1) all momentum indicators just entered the bull zone.
2) The chart is forming higher highs.
Daily:
1) EMA55 finally crossed EMA200. The last time they crossed was October 2023 (see red vertical line in the chart) and it was the beginning of the macro bull trend.
2) Momentum indicators have reached overbought territory and crossed to the downside, however, given weekly momentum indicators have just entered the bull zone, this move is likely to be corrective action.
3) When EMA55 and EMA200 cross, the price often retraces initially to EMAs (21, 55 or 200). Once it completes the pull back, I anticipate the price to move to the previous ATH and beyond.
This is the time when high leverage trading volume increases.
Be careful not get wicked out. Focus on monthly/weekly/daily charts and ignore the noise in the lower timeframes.
SOLUSD at Major support SOLUSD has reached major support from here we may see a good pullback. Let us see how it plays out.
Solana coin Long setupIn this video I go through the current price action and talk about how the 126$ target level was recently reached for a clean long entry and on the daily timeframe we printed a higher low .
I expand on my thoughts for a continuation to the upside and to retest some higher levels of resistance 180$s and time will tell if we print a higher high at the 180$s before retesting the $200 zone .

SolSolana is currently in a correction phase, and a strong demand is forming near the 151 area.
As per the rules, the market should ideally start buying from here.
SOL/USD Last Level before $143Using a simple fib retracement from June Low to July High, mid 150s is a good buy after we lost $165, but it all depends on BTC. If BTC loses 112k-110, we are going to $140s and potentially the June low. God Speed

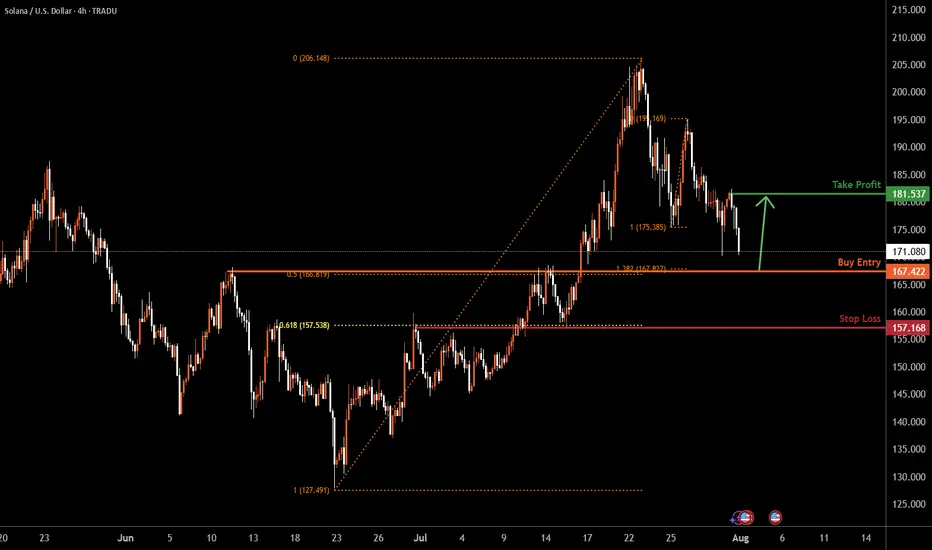
SOLUSD H4 | Bullish bounceBased on the H4 chart analysis, the price could fall to the buy entry, which acts as a pullback support that aligns with the 50% Fibonacci retracement and the 138.2% Fibonacci extension and could bounce to the upside.
Buy entry is at 167.42, which is a pullback support that aligns with the 50% Fibonacci retracement and the 138.2% Fibonacci extension.
Stop loss is at 157.16, which is an overlap support that aligns with the 61.8% Fibonacci retracement.
Take profit is at 181.53, which is a pullback resistance.
High Risk Investment Warning
Trading Forex/CFDs on margin carries a high level of risk and may not be suitable for all investors. Leverage can work against you.
Stratos Markets Limited (tradu.com ):
CFDs are complex instruments and come with a high risk of losing money rapidly due to leverage. 65% of retail investor accounts lose money when trading CFDs with this provider. You should consider whether you understand how CFDs work and whether you can afford to take the high risk of losing your money.
Stratos Europe Ltd (tradu.com ):
CFDs are complex instruments and come with a high risk of losing money rapidly due to leverage. 66% of retail investor accounts lose money when trading CFDs with this provider. You should consider whether you understand how CFDs work and whether you can afford to take the high risk of losing your money.
Stratos Global LLC (tradu.com ):
Losses can exceed deposits.
Please be advised that the information presented on TradingView is provided to Tradu (‘Company’, ‘we’) by a third-party provider (‘TFA Global Pte Ltd’). Please be reminded that you are solely responsible for the trading decisions on your account. There is a very high degree of risk involved in trading. Any information and/or content is intended entirely for research, educational and informational purposes only and does not constitute investment or consultation advice or investment strategy. The information is not tailored to the investment needs of any specific person and therefore does not involve a consideration of any of the investment objectives, financial situation or needs of any viewer that may receive it. Kindly also note that past performance is not a reliable indicator of future results. Actual results may differ materially from those anticipated in forward-looking or past performance statements. We assume no liability as to the accuracy or completeness of any of the information and/or content provided herein and the Company cannot be held responsible for any omission, mistake nor for any loss or damage including without limitation to any loss of profit which may arise from reliance on any information supplied by TFA Global Pte Ltd.
The speaker(s) is neither an employee, agent nor representative of Tradu and is therefore acting independently. The opinions given are their own, constitute general market commentary, and do not constitute the opinion or advice of Tradu or any form of personal or investment advice. Tradu neither endorses nor guarantees offerings of third-party speakers, nor is Tradu responsible for the content, veracity or opinions of third-party speakers, presenters or participants.
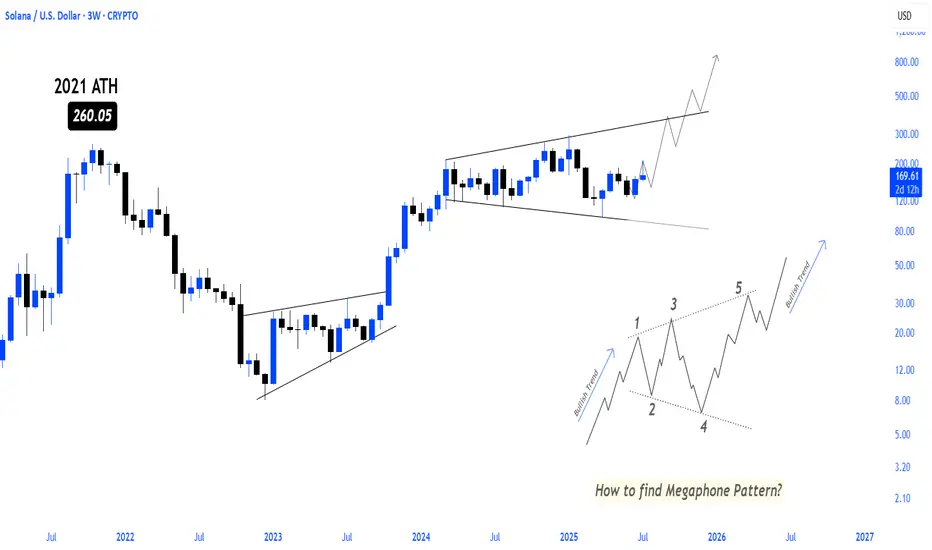
SOLANA BULLISH MEGAPHONE PATTERN LOADING! solana continues to move step by step towards higher levels within the bullish megaphone pattern, which will make movements towards ATH and more inevitable in the coming period
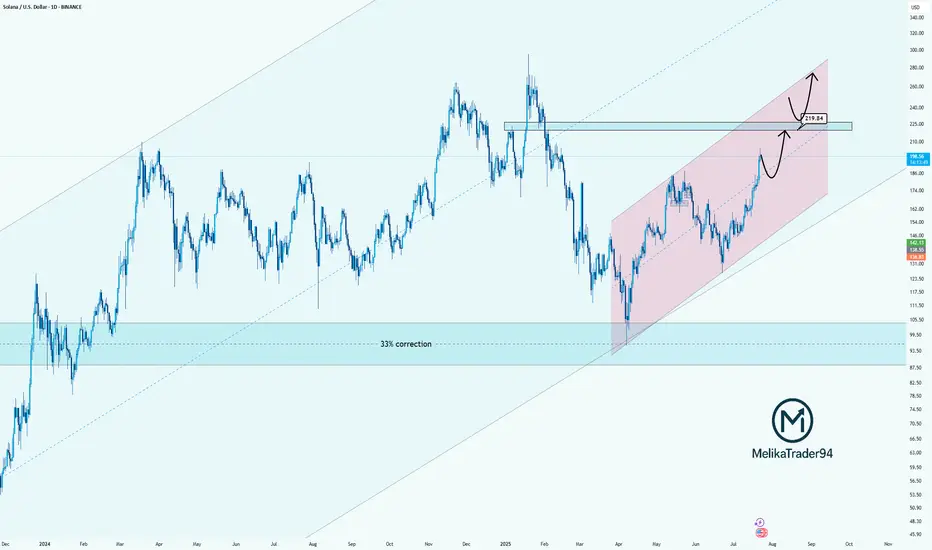
Solana Approaching Key Resistance: watch for $219Hello guys!
Solana has been trending strongly inside a rising parallel channel, recovering steadily after a significant 33% correction. The bullish momentum is clear, and the price is now approaching a key resistance zone near $219.84, which previously acted as a major turning point.
Here’s what I’m watching:
Strong uptrend within the pink channel shows controlled and healthy growth.
$219.84 is a critical decision zone. Price could:
React with a pullback before pushing higher,
Or break through it and flip the level into support for the next bullish leg.
The reaction in this zone will determine the next structure.
Whether we see a temporary correction or continuation to new highs.
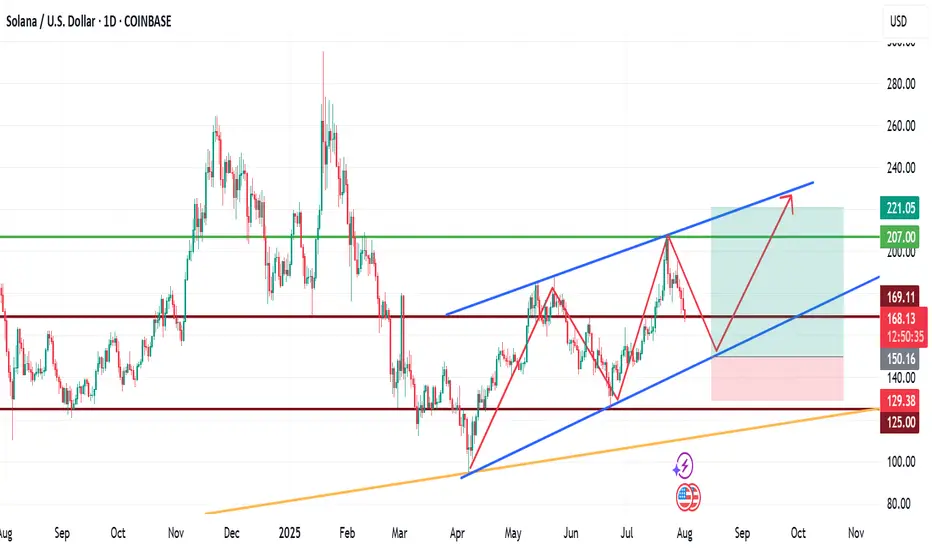
My View for SOLANA next moveMy View for SOLANA next move.
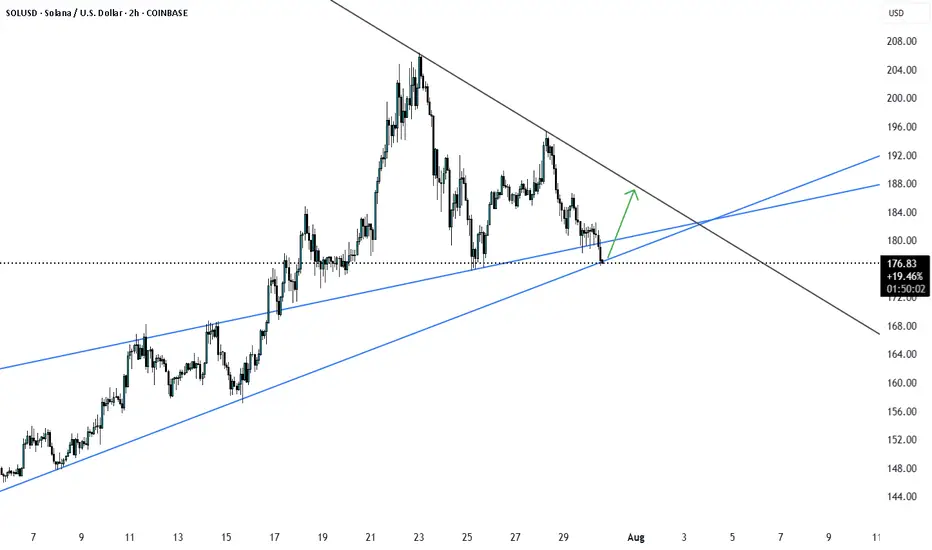
Technically, SOL has been trading within a channel for a while now, with the formation of HHs and HLs.
If fundamentals play out positively long to mid-term, we are likely to see SOLNA fall to $150 zone before another upward leg forms. This leg may rally to as high as $220.
Trade with care.
If you found this helpful, please connect with me.
Like, comment and share
SOLUSD possible scenario reached 0.618 fib levelSOLUSD has reached 0.618 Fib leve of recent swings and if breaks this Fib0.618 is likely to go up if not then can go down. let us see.
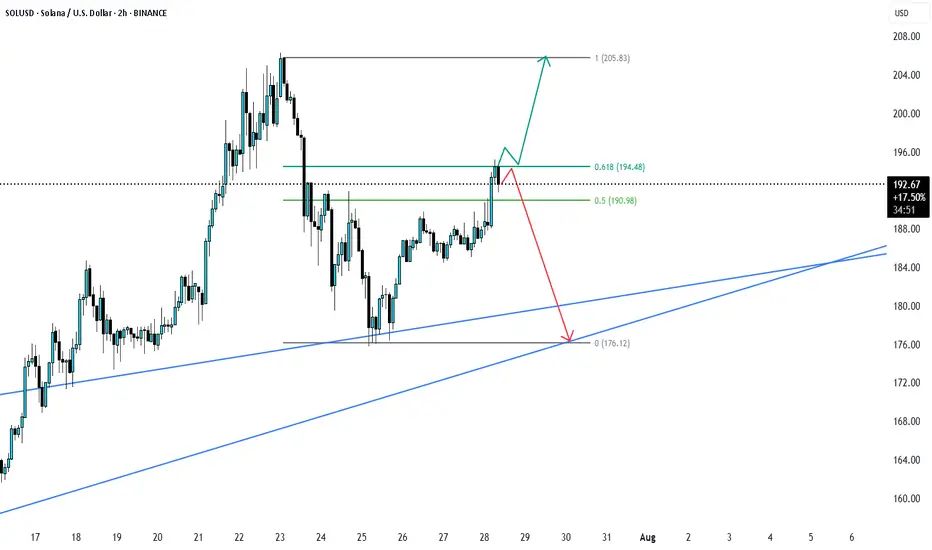
Solana to $260?SOL is testing previous resistance as support around $180.
Reclaiming $184 could signal a test of last week's highs around $206.
Claiming $206 as support could signal a push towards $260.
Losing $180 could signal a retracement towards $165 or 1D 200MA.

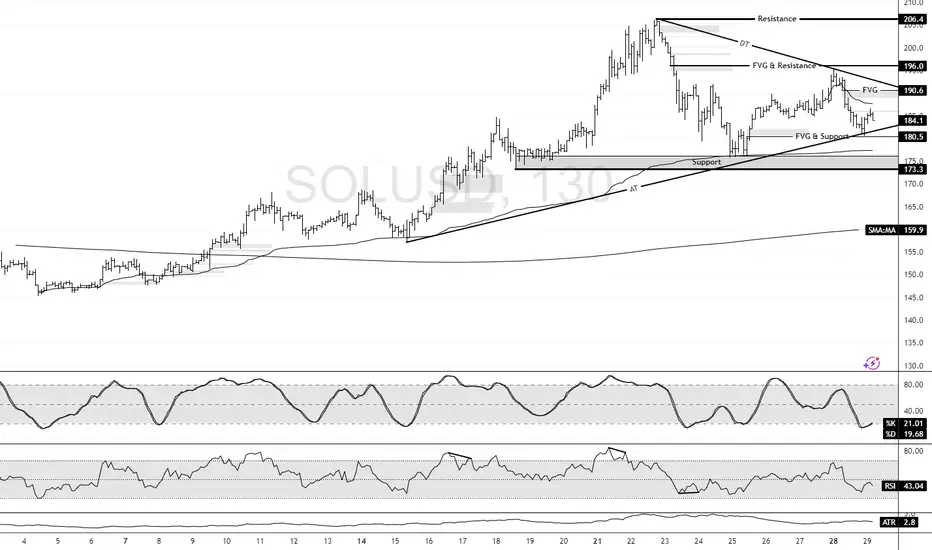
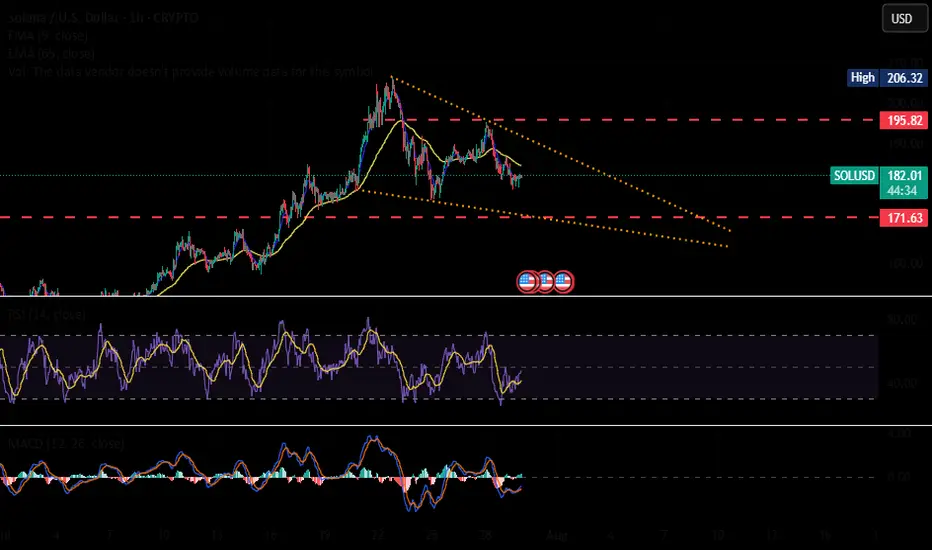
Solana Holds Firm Above VWAP and TrendlineFenzoFx—Solana remained above the ascending trendline and the monthly VWAP, currently trading sideways inside the wedge.
Critical support is at $173.3, and the market outlook remains bullish above this level. If this demand level holds, we expect Solana to resume its bullish trajectory and target the recent highs at $206.4.
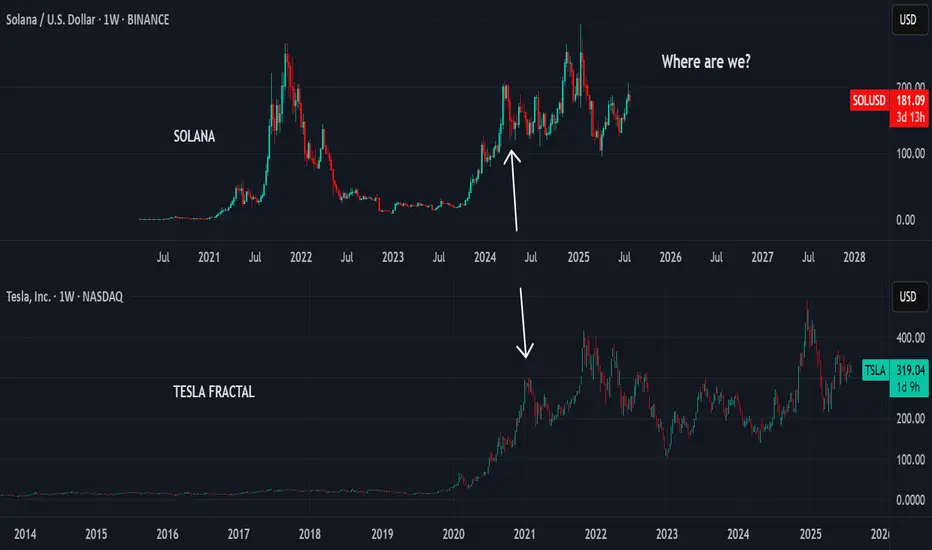
A PICTURE IS WORTH A THOUSAND WORDS.The two charts are only separated by name, both are working out a correlated fractal structure.
The exact position of Solana compared to the Tesla fractal is much elusive. Two possible considerations of current structure in Solana fit equally into the past trend already completed by Tesla
The two possible scenarios are indicated on the chart above,
1. If the 21st July 2025 top in Solana corresponds to the 4th April 2022 point on Tesla, the price action will favourably follow the white line.
2. If the 21st July 2025 top in Solana rather aligns with the 17th July 2022 point on Tesla, then price will likely make a minor correction and move higher as indicated by the gold line.
Please note, the year dates below the lines are not to be considered, the lines are just for illustrations only. Also note that the extent of corrections or expansions in fractals are not necessarily the same, they only share similar structural forms.
Trade safe, good luck
Still bullish in the higher time frames Solana has been struggling to break and stay above $170-200 zone this cycle.
It has been a very difficult asset to trade, however, I can see more bullish setups than bearish setups in higher timeframe charts.
Monthly:
1) July monthly candle closed above Fib 0.618 and formed higher high higher low.
2) RSI and MACD are still in the bull zone.
3) Stochastic are in the bear zone, but they are pointing to the upside.
Weekly:
1) EMA21 is still above EMA55.
2) The current weekly candle is forming bearing engulfing candle, however, there are two more days before it closes. It is still above EMA 21.
3) RSI orange line (RSI based moving average) is moving upwards and entering the bull zone.
4) MACD is about to enter the bull zone.
5) Stochastic hasn't reached overbought territory yet.
6) The set up of these three momentum indicators is very similar to the set up in Oct 23 before Solana started a massive bull trend. (see red vertical line)
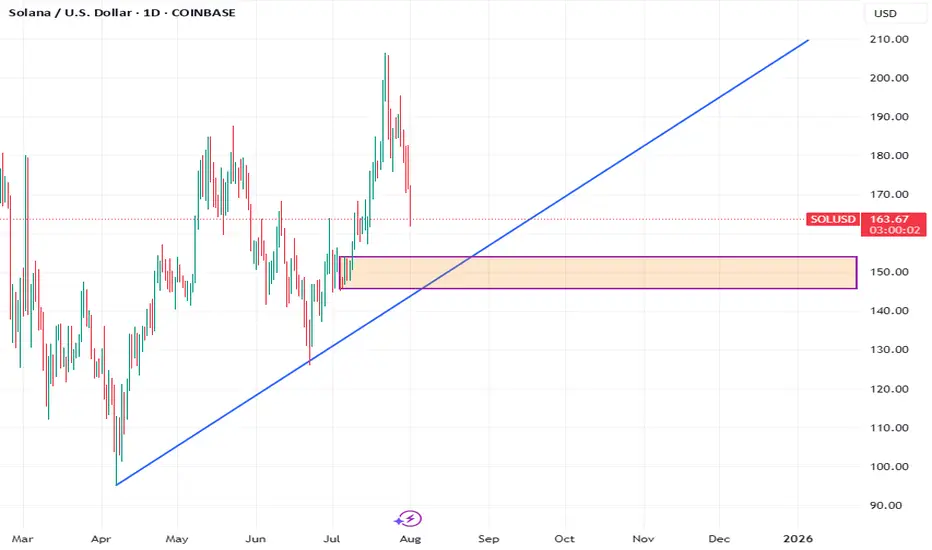
Daily:
1) EMA21>EMA55>EMA200
2) As I said in the previous articles, EMA 55 and 200 don't cross easily. But when they do, the price often pulls back significantly before it starts to move in the direction of the trend.
3) Daily candle broke below EMA21, however, the price is reacting strongly to EMA55.
4) The price is still higher high higher low.
I will wait and see if the price is going to bounce off from $143 -157 region. (see blue rectangular block).
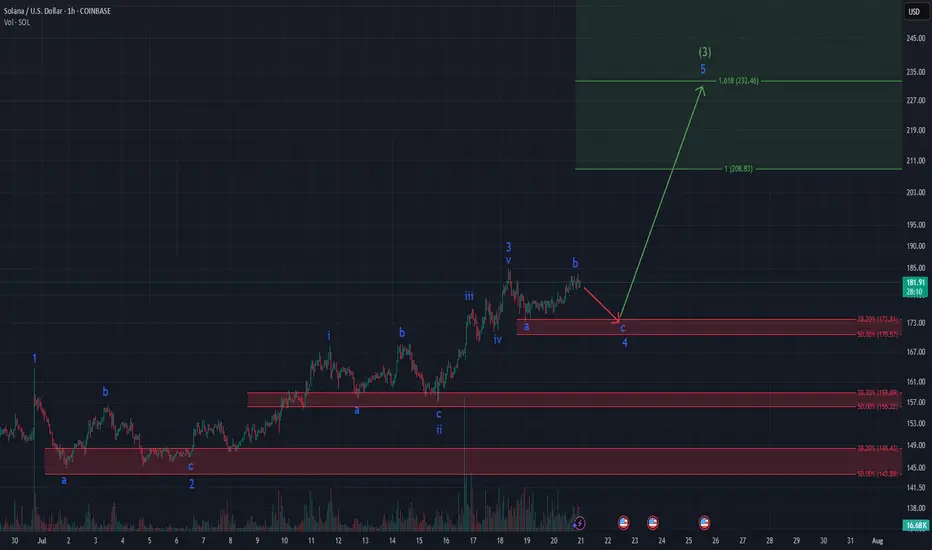
SOLANA ready for Explosion? Textbook Elliott Setup unfoldingSolana – Textbook Elliott Wave Structure Unfolding!
Clear impulsive fractals, textbook ABC corrections, and precise Fibonacci reactions – this 1h chart on CRYPTOCAP:SOL is a dream for any Elliottician.
We’re currently finishing wave C of (4) within a well-formed bullish impulse. Key support lies between $170–$173, aligning perfectly with the 38–50% retracement zone. From there, I expect wave 5 to launch, targeting $232.46 (1.618 extension), which would complete the green (3) wave.
Both RSI and MACD suggest we're approaching exhaustion – a healthy reset here could provide the perfect setup for the next breakout.
🔹 Are you bullish on Solana?
🔹 What chart would you like me to analyze next?
👇 Let me know in the comments and feel free to follow for more detailed Elliott Wave crypto setups.
#Solana #ElliottWave #CryptoTA #TechnicalAnalysis #Wave5 #Fibonacci #BullishSetup #Altseason #CryptoBreakout #SOLUSDT #TradingView
BULLISH MOVESolana has on the WEEKLY chart shows a clear W formation, on the DAILY chart there is a retest forming a small W formation and on the H4 there is w that later forms an IH&S pattern.
All those patterns indicate a move upwards,ideally to complete the bigger picture that is the W.

Solana SOL Extreme LevelsCRYPTO:SOLUSD Extreme Levels
50% - 61.8% Fib Ret ($166 - $156) ✅
Equal Legs area ( $164 - $145) ✅
Next Higher Target = $218 🎯

$SOL🚨 CRYPTOCAP:SOL Bullish Flag Forming 🚨
Solana is currently setting up a clean bullish flag pattern. We’re watching the $195 level closely a breakout above that zone could confirm a continuation to the upside.
However, confirmation is key we’ll need to see strong momentum and volume to validate the move.
👀 On the downside, there's liquidity building around $171. If price dips into that zone, we might see buyer activity spike possibly creating a new wave of volatility.
SOLUSD – Recovery Faces Wall at $193SOL broke below $198, hitting a low near $179, confirming the short trigger from the last setup. Since then, it’s building a grind-recovery, reclaiming $189 but stalling at a confluence zone ($191.84 resistance and SMA200 near $193.11). RSI at 59.41 still favors buyers — but SOL needs a clean break above $193+ to shift back into bullish territory.

The next levels for Solana coinIn this video I recap the previous video and discuss what may be next after the current retracement .
I reveal some important levels that sit below as well as the relationship with the Eth/Btc chart.
Tools used vwap, Fibs and volume profile .

SOLUSD- Has a long-term sport between 155 and 158Technical Analysis by AI
💵 Current Price & Market Context
• SOL trading around $158–$160, down about 2–3% today, still down ~14% from last week’s top near $180+.
🧭 Trend & Momentum
• RSI near 41–47 → not oversold but on the lower side.
• MACD still leaning bearish. Momentum: neutral to slightly bullish across indicators.
🛠️ Support & Resistance
• Immediate support at $160, stronger support at $154.
• Resistance at $172–$176, bigger barrier around $180–$190.
📈 Pattern Behavior
• Still holding an ascending channel, currently sitting near the lower band.
• Failed breakout at $180–$190 means that’s a hard ceiling unless broader market turns bullish.
⸻
✅ Trade Thoughts Based on This
Aspect
Bias Neutral to bearish short-term
Entry Zone Valid? Yes, $156–158 is still solid
Key Level to Watch
$154 — if breaks, downside likely
Upside Potential Target $172–176 short term
Breakout Ceiling $180+ tough without volume/sentiment
⸻
🧭 What You Should Do Now
• You’re in near $156–158 → good spot as long as $154 holds
• If price dips to $154 and bounces: still valid
• If breaks $154: prepare to cut, next support is ~$145
• If price moves above $170: momentum could take it to $176+
• Don’t chase anything. Wait for volume or bounce from support

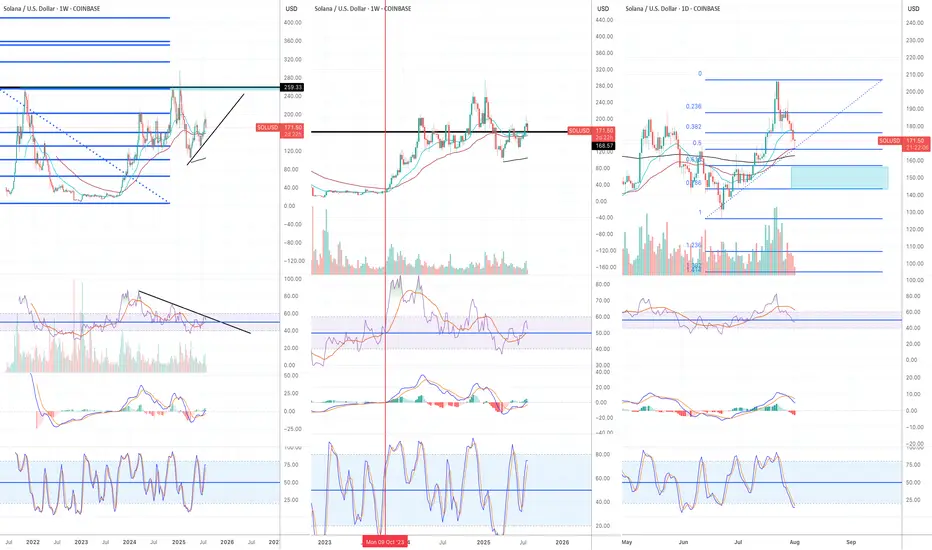
$SOLUSD: Scaling LawsResearch Notes
Progressions here are evident so I'll use the historic bits and organize them into structure that would determine the levels inside dark highlighted zone of the local scope.
If we scale back, it's hard to avoid the massive drop that structurally can serve as reference point.
