SOL key resistance 201We are reaching a key level in the fib retracement which sits at 201 USD. With the daily RSI being in the overbought area, I would expect a pullback to 180 or 165. DYOR, would love to hear your thought
SOLANA trade ideas

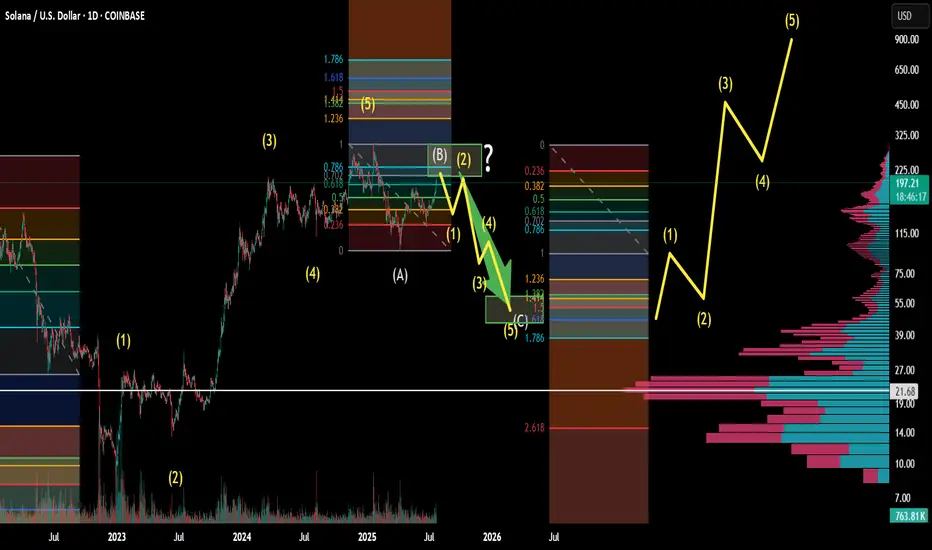
Solana's Bearish 5-0 is Locking in a Bearish Reversal to $26.40Solana has recently run up to Horizontal Resistance Zone of $195-$210 aligning with the PCZ of a Bearish 5-0 and has begun to impulse downwards with volume to back it. This could be the start of a greater move down that would take SOL back to the low of the distributive range at $95.16. If the level breaks, we would then target a drop down to the $40.72-$26.40 confluence area aligning with the all-time 0.886 retrace as well as the 1.618 extension from previous swing low to high. Only at these levels could we even possibly begin to consider Bullish Entries on Solana.

Solana Holds Firm Above VWAP and TrendlineFenzoFx—Solana remained above the ascending trendline and the monthly VWAP, currently trading sideways inside the wedge.
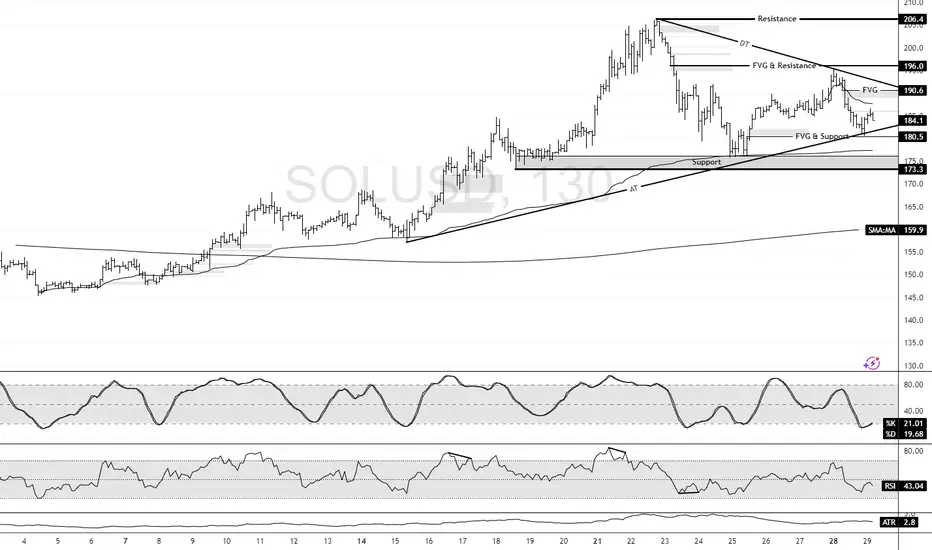
Critical support is at $173.3, and the market outlook remains bullish above this level. If this demand level holds, we expect Solana to resume its bullish trajectory and target the recent highs at $206.4.
BULLISH MOVESolana has on the WEEKLY chart shows a clear W formation, on the DAILY chart there is a retest forming a small W formation and on the H4 there is w that later forms an IH&S pattern.
All those patterns indicate a move upwards,ideally to complete the bigger picture that is the W.

Opened longI opened a long position.
Ideally it is safe to wait for EMAs to line up for the bull trend (EMA21 > 55> 200) in the Daily chart. However, there are many indications that the price will start to move to the upside and the upside move might be quite aggressive. So I decided to open a long position with a small position size.
The reasons for opening a long position:
Daily:
Bull candle has closed above EMA21 for a few times.
RSI lines have crossed and entered the bull zone.
MACD lines are about to enter the bull zone.
Stochastic lines are above to cross and move up.
The price has been staying above Fib 0.236 level for about 10 days.
The price has broke and closed above the descending parallel channel.
4H:
All momentum indicators are in the bull zone.
EMA21 is above EMA 55.
The price has closed above EMA200.
The price is consolidating above the top descending parallel channel.
It is not the perfect bull trend set up, however, there are enough confluences for the price to start to move to the upside.
Entry price: $142.59 (blue horizontal line in 4H chart)
Stop Loss: $130.40 (red horizontal line in 4H chart)
Target: $195 (green horizontal line: Fib 0.5 level in Daily chart and fair value gap zone)
$178 is a strong support and resistance area, so if it starts to stall, I might take a partial profit.
Fingers crossed.

SOLUSD – Recovery Faces Wall at $193SOL broke below $198, hitting a low near $179, confirming the short trigger from the last setup. Since then, it’s building a grind-recovery, reclaiming $189 but stalling at a confluence zone ($191.84 resistance and SMA200 near $193.11). RSI at 59.41 still favors buyers — but SOL needs a clean break above $193+ to shift back into bullish territory.

SOL TO THE MOONthe solana has urged a retracement , going back to its key zone, the next bullrun will explode the price of solana, make sure you have enough sol in your wallet

SOLUSD at Strong SUPPORT SOLUSD was trading down trend the and is current at the support which was its resistance earlier and this is a strong support and expect further growth or up movement of for SOL. 2010-215.

Double bottomDouble bottom with RSI regular divergency. It seems that buyers a willing to buy at this level again.

SOL Institutional Capital Fuels Bull Run SpeculationSolana's Ascent: A Perfect Storm of Adoption and Institutional Capital Fuels Bull Run Speculation
A powerful and rare confluence of tangible real-world adoption, significant institutional investment, and bullish technical indicators is generating a palpable buzz around Solana (SOL). The high-performance blockchain, often touted as a leading "Ethereum killer," is experiencing a resurgence that has captured the market's attention. After a period of sideways consolidation, SOL has decisively broken through key psychological and technical price levels, igniting speculation that this may be the start of a sustained and powerful bull run.
The narrative driving this optimism is not based on fleeting hype but on two concrete, fundamental pillars. The first is the global shipment of Solana Mobile's second-generation smartphone, the "Seeker," a device engineered to onboard millions into the Web3 ecosystem by seamlessly integrating crypto into the user's daily life. The second is a powerful vote of confidence from the traditional finance world, where a growing number of publicly traded companies are aggressively accumulating SOL for their corporate treasuries, treating it as a strategic reserve asset. As these foundational tailwinds gather force, technical charts are beginning to align, suggesting that the path of least resistance for Solana's price may soon be sharply upward.
The Seeker Phone: Solana's Trojan Horse for Mass Adoption
Perhaps the most visible and innovative catalyst is the global rollout of the Seeker smartphone. Following up on its first-generation "Saga" device, Solana Mobile has initiated the shipment of tens of thousands of pre-ordered Seeker phones to a global audience. The market's reception has been nothing short of explosive, with pre-orders soaring past 150,000 units—a dramatic increase from the 20,000 total sales of its predecessor. This overwhelming demand underscores a pent-up desire for a mobile-native Web3 experience.
But the Seeker is far more than just a piece of hardware; it represents a strategic masterstroke to solve the persistent problem of user experience in the crypto space. For years, interacting with decentralized applications (dApps) on mobile has been a clunky, insecure, and fragmented process, creating a high barrier to entry for the average consumer. The Seeker directly addresses these pain points. It features a built-in crypto wallet and a hardware-isolated "Seed Vault," which secures a user's private keys in a protected environment within the phone, drastically enhancing security and simplifying transactions.
This mobile-first approach creates a powerful economic flywheel. Priced accessibly, the phone is projected to generate substantial revenue for Solana Mobile. However, its true value lies in its ability to foster a vibrant, self-sustaining ecosystem. Each device includes a "Genesis NFT," a digital key that unlocks exclusive airdrops, rewards, and early access to new applications. This model, which proved incredibly successful with the Saga phone and the famous BONK memecoin airdrop, gamifies participation and incentivizes users to actively explore and engage with the Solana network. It transforms the phone from a passive communication tool into an active portal for decentralized finance (DeFi), NFT marketplaces, and Web3 gaming.
Furthermore, the Seeker boasts its own decentralized dApp store, presenting a direct challenge to the incumbent duopoly of Apple and Google. By offering developers a platform with lower fees and fewer restrictions, Solana is cultivating an environment where innovation can flourish. This attracts builders to the ecosystem, leading to a richer and more diverse array of applications, which in turn attracts more users. The Seeker phone, therefore, is not just a product—it's a Trojan Horse designed to embed the Solana network into the fabric of daily life, driving network utility, transaction volume, and ultimately, sustained demand for the SOL token.
The Institutional Stampede: Big Money Places Its Bet on Solana
While the Seeker phone provides a compelling grassroots adoption narrative, it is the concurrent wave of institutional investment that adds a powerful layer of validation and financial firepower. A growing cohort of publicly traded companies is now strategically adding SOL to their corporate treasuries, signaling deep-seated, long-term confidence in the network's technology and economic potential. This trend moves Solana beyond the realm of speculative trading and into the domain of strategic corporate finance.
Leading this charge is DeFi Development Corp (DFDV), a firm that has made headlines with its aggressive accumulation strategy. The company recently purchased an additional 110,466 SOL, bringing its total holdings to a staggering 1.29 million SOL. This move is part of a publicly stated ambition to hold one SOL per outstanding company share by 2028, a strategy explicitly modeled after MicroStrategy's high-conviction Bitcoin treasury plan. By securing a multi-billion dollar line of credit for these purchases, DeFi Dev Corp is making a clear and unequivocal bet on Solana's future.
This institutional embrace extends beyond a single entity. Upexi Inc., a consumer brand holding company, has significantly increased its SOL holdings and secured a $500 million credit line for further acquisitions. Bit Mining, a prominent player in the digital asset mining space, has not only purchased millions of dollars worth of SOL but has also launched its first Solana validator, contributing directly to the network's security and decentralization. Perhaps most surprisingly, Artelo Biosciences, a Nasdaq-listed pharmaceutical company, has pivoted to include SOL in its treasury, becoming the first public pharma firm to adopt a digital asset as a reserve.
These companies are drawn to Solana for its unique combination of high throughput, low transaction costs, and yield-bearing potential. The network's ability to process thousands of transactions per second at a fraction of a penny makes it a viable platform for enterprise-grade applications. Furthermore, the ability to stake SOL and earn a consistent annual yield of 7-8% presents a compelling alternative to holding depreciating fiat currencies or low-yield government bonds. This makes SOL an attractive treasury asset that can both appreciate in value and generate a recurring revenue stream. This institutional inflow provides robust price support and has an outsized market impact, as it effectively removes large quantities of SOL from the circulating supply, creating a potential supply shock as demand continues to grow.
Coiling for a Breakout: A Technical Perspective
This potent mix of fundamental catalysts is vividly reflected in Solana's price chart, which shows the asset coiling for a potentially explosive move. After establishing a solid foundation of support, SOL has demonstrated significant strength by breaking through the crucial $160 and $162 levels. The price is now trading firmly above its 100-hourly simple moving average, a key indicator that traders use to gauge short-term trend momentum. A price holding above this moving average is generally considered a sign of bullish health.
Currently, a key bullish trend line has formed on the hourly chart, with immediate and strong support located at the $165 mark. This level now acts as the first line of defense for the bulls; as long as the price remains above it, the upward trajectory is considered intact. However, the path higher is not without obstacles. The first major test awaits at the $172 resistance zone. A decisive and high-volume break above this level would signal that buyers are in firm control and could trigger a cascade of further buying.
Should the bulls conquer $172, the next significant hurdle lies near the $180-$182 range. Overcoming this area would open the door to a more sustained rally, with analysts eyeing subsequent targets at $192 and the psychologically important $200 level. While these technical levels present challenges, the underlying momentum indicators are encouraging. The Moving Average Convergence Divergence (MACD) is showing bullish acceleration, and the Relative Strength Index (RSI) is holding strong above the 50 midpoint, indicating that buying pressure is outweighing selling pressure.
Of course, no market moves in a straight line. A failure to break the $172 resistance could lead to a temporary pullback. If the $165 support level were to fail, the next support zones would be found near $160 and $155. A break below these levels could signal a short-term bearish reversal and would invalidate the immediate bullish thesis. However, given the powerful fundamental drivers at play, many analysts believe that any such dips would likely be viewed as buying opportunities.
The Verdict: Is This the Definitive Catalyst?
Solana currently finds itself in an exceptionally strong position. It is one of the few blockchain projects that can boast a clear, tangible strategy for mass adoption through its mobile initiatives. The Seeker phone is a game-changer, providing a seamless on-ramp to Web3 that could onboard a new generation of users.
This powerful fundamental narrative is being amplified and validated by a wave of institutional capital. The strategic accumulation of SOL by public companies lends the asset a new level of legitimacy and provides a powerful source of demand that is unlikely to waver based on short-term market fluctuations.
When these two forces are combined with a bullish technical structure, the result is a perfect storm of positive catalysts. While the broader crypto market will always be subject to macroeconomic factors and regulatory shifts, Solana has carved out a uniquely compelling growth story. The immediate challenge is for the bulls to maintain their momentum and decisively break through the upcoming resistance zones. If they succeed, this confluence of events may very well be remembered as the definitive catalyst that propelled Solana into its next major bull run, solidifying its position not just as a competitor, but as a leader in the new digital economy.

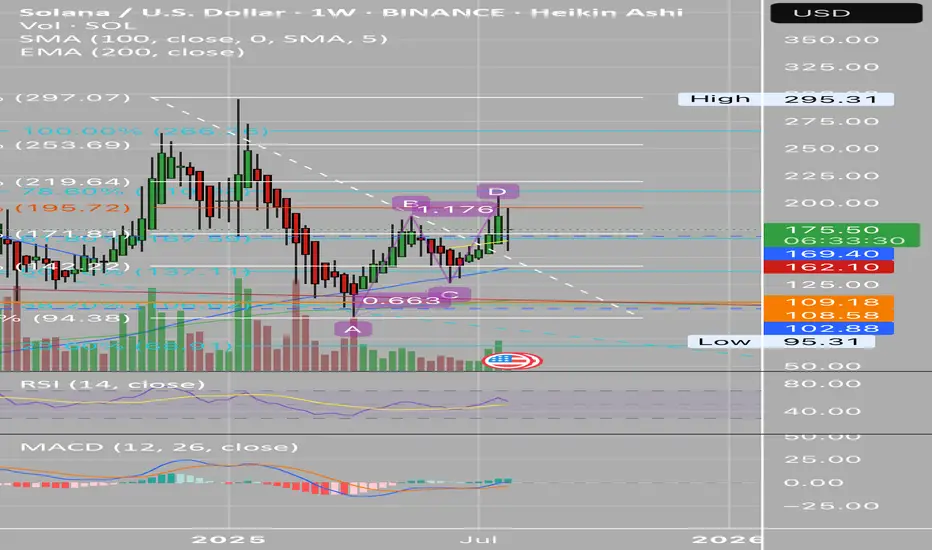
Bulls will be disappointed - Weekly Update August 5-11thSolana appears to be in the final leg of a complex corrective structure. According to the current Elliott Wave count, the larger cycle degree is unfolding in a downward wave c, while the primary degree is in an upward wave B, subdividing into intermediate wave C, which itself is in minor wave C—now developing.
The corrective decline from the July high has retraced toward the 0.618 Fibonacci retracement level (~$157) of the prior move, marking a typical zone for the end of Wave B within a flat or zig-zag formation. From this low, Solana has begun to push higher, indicating the likely beginning of Wave C to the upside. Based on Fibonacci extensions, the potential target zone for this move lies between $236 (1.0 extension) and $254 (1.236 extension).
From a market structure perspective, funding rates across major perpetual futures markets for SOL remain slightly negative or neutral, indicating that the majority of traders are not aggressively long at this stage. This often provides a more stable environment for an upward move, as it suggests the absence of overcrowded long positions that could lead to sharp liquidations. For reference, data from Velo (as of August 5) shows funding on Binance SOLUSDT Perpetual at 6.07%, confirming this neutral-to-slightly-bearish bias in funding.
Additionally, open interest has been neutral since the local low around $157. This is visible on futures data platforms such as Velo.xyz.
However, the liquidity heatmap does not currently support a strong magnet effect toward the $236–$254 zone. There is no significant cluster of stop liquidity or resting orders above $230 that would attract price purely through liquidation mechanics. In contrast, notable liquidity still resides below current levels, making the setup more technically driven than structurally supported by liquidity.
Given these conditions, the case for a C-wave rally remains technically intact, but traders should be cautious: the absence of upper-side liquidity and the corrective macro context imply that this move, even if successful, is likely a countertrend rally within a broader bearish cycle structure.
In conclusion, as long as price holds above the $157–$166 support zone and maintains impulsive structure on lower timeframes, the outlook remains short- to mid-term bullish toward the $236–$254 area. Yet, any breakdown below $157 would invalidate this wave count and suggest that Cycle Wave c may already be resuming to the downside.

SOLUSD Sell Limit ordersHi everyone.
I've set 3 orders to go short on Solana.
Please consider That if the second order triggered, Risk free the first order and If the third order triggered so you need to risk free the second order too...
These TP levels are based on Fib Levels. But if you want you can set the first TPs at 1:1RR for each order.
Let's see what happen.
Good luck everyone.

SOL Breakout + Retest? RSI Oversold SOL's back at a key trendline with low RSI and a full EMA cross loading. This could be the bounce if bulls show up.
📌 Breakout + retest holding trendline support
📌 Full EMA cross potentially forming
📌 RSI deep in the oversold zone
⏱️ Timeframe: 1H
#sol #solusd #crypto #tradingstrategy #tradingview #technicalanalysis #quanttradingpro

SOLUSD – Volatility Coil UnleashedSOL bounced cleanly from SMA 200 at $164.45 and is now attempting to flip $169.95. Structure favors bulls. If it holds $166–$167 on pullbacks, upside continuation is probable.
Still bullish My overall bias for Solana is bullish.
It has been a difficult asset to trade, however, I can still see bullish momentum is building up in higher time frames:
Weekly:
1) MACD line (faster line) has finally entered the bull zone since it dropped to $95 on April 25.
2) RSI line (orange one) has entered the bull zone.
3) EMA 5 > EMA21> EMA 55
Daily:
1) EMA 21> EMA55> EMA200
2) MACD lines are still in the bull zone.
3) Stochastic has reached the oversold territory and crossed to the upside.
4) The price is still forming higher high higher low above the ascending trendline.
5) The price has retraced to Fib 0.618 and now it is bouncing up.
6) The daily candle on 2n August closed at Fib 0.618 and yesterday's candle closed above both EMA55 and 200.
As I mentioned in my previous articles, when EMA55 crosses above EMA200, the price often retraces significantly before it starts to move to the upside. So I was prepared for the price to drop to Fib 0.382, 0.5, 0.618 or 0.786. At the moment, Fib 0.618 seems to be working as the lines of support.
The current price action looks good for the bull, however, $185-200 zone has been a very tough area to break. Therefore, I am prepared for a few scenarios:
Scenario 1: The price will move to Fib 0236 zone at $188 area. It fails to break above and drops to retest either the ascending trendline or wicks down to Fib 0.786/$143 area.
Scenario 2: The price will move to Fib 0.236 zone, consolidates in the area and moves up.
Scenario 3: It fails to move above Fib 0.236 level, drops below the ascending trendline and Fib 0.786. If it happens, I need to re assess my bullish bias.

SOLANA Chart Fibonacci Analysis 080325Trading Idea
1) Find a FIBO slingshot
2) Check FIBO 61.80% level
3) Entry Point 160/61.80%
Chart time frame:B
A) 15 min(1W-3M)
B) 1 hr(3M-6M)
C) 4 hr(6M-1year)
D) 1 day(1-3years)
Stock progress:A
A) Keep rising over 61.80% resistance
B) 61.80% resistance
C) 61.80% support
D) Hit the bottom
E) Hit the top
Stocks rise as they rise from support and fall from resistance. Our goal is to find a low support point and enter. It can be referred to as buying at the pullback point. The pullback point can be found with a Fibonacci extension of 61.80%. This is a step to find entry level. 1) Find a triangle (Fibonacci Speed Fan Line) that connects the high (resistance) and low (support) points of the stock in progress, where it is continuously expressed as a Slingshot, 2) and create a Fibonacci extension level for the first rising wave from the start point of slingshot pattern.
When the current price goes over 61.80% level , that can be a good entry point, especially if the SMA 100 and 200 curves are gathered together at 61.80%, it is a very good entry point.
As a great help, tradingview provides these Fibonacci speed fan lines and extension levels with ease. So if you use the Fibonacci fan line, the extension level, and the SMA 100/200 curve well, you can find an entry point for the stock market. At least you have to enter at this low point to avoid trading failure, and if you are skilled at entering this low point, with fibonacci6180 technique, your reading skill to chart will be greatly improved.
If you want to do day trading, please set the time frame to 5 minutes or 15 minutes, and you will see many of the low point of rising stocks.
If want to prefer long term range trading, you can set the time frame to 1 hr or 1 day.
Weekly Chart RejectionRight now I’m seeing a rejection at 50% Fib
It also looks like it’s gonna to confirm it at week close.
I’m concerned this means we continue to drop $109 area as support.
Looks like most of the coins out there can keep dropping so likely the same with SOL
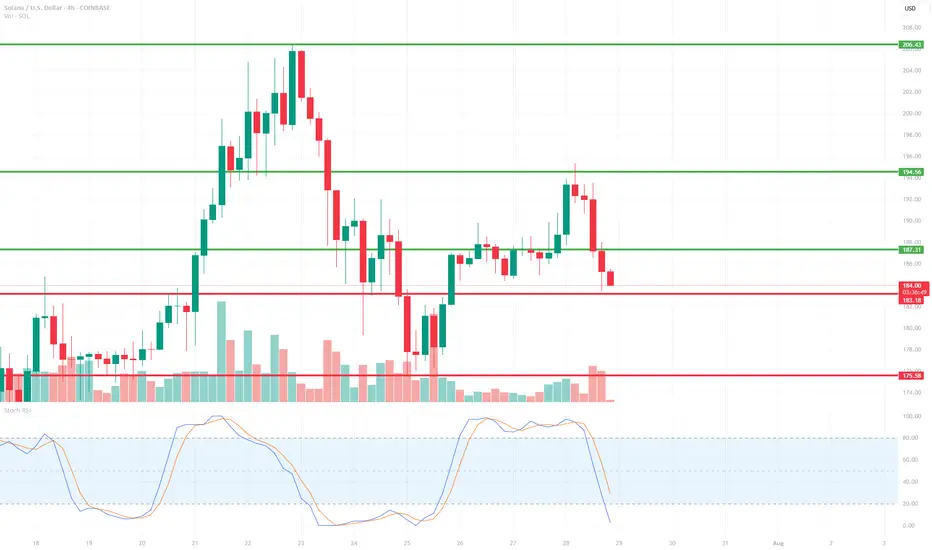
SOL/USD 4H📉 Price
Current price: approximately $183–$184
We see a decline from the resistance zone around $194.56. The price has broken through support at $187.31 and is heading towards lower support at:
🔴 $183.18 – local support (being tested now),
🔴 $175.58 – key support (potential target if current support breaks).
📊 Market structure
Short-term trend: Downtrend (lower highs and lower lows after a rebound from $194.56).
Volume: Increased volume on bearish candles – confirming supply pressure.
Previous trend: Uptrend with strong momentum from July 18th to July 21st.
🔁 Technical Levels
Resistance:
🟢 USD 187.31 – last broken support, now acting as resistance.
🟢 USD 194.56 – strong resistance (tested twice).
🟢 USD 206.43 – local high, strong resistance level from higher timeframes.
Support:
🔴 USD 183.18 – currently being tested.
🔴 USD 175.58 – stronger support from lower swing highs.
📉 Stochastic RSI
Located in the oversold zone (<20) and pointing down.
No upside crossover yet → no buy signal yet.
If a reversal occurs, a technical rebound is possible.
📌 Conclusions and Scenarios
🔻 Downside scenario (more likely currently):
Breakthrough of support at $183.18 ➜ further decline to $175.58.
Potential entry into a correction of the entire upward movement from July 18-21.
🔺 Upside scenario (alternative):
Support at $183.18 held + Stoch RSI signal ➜ rebound to $187.31.
If buying volume increases, a retest of resistance at $194.56 is possible.
SOLUSD – Topped Out or Holding ThinSOL topped out at $206 and now coils near the 200 SMA at $198. RSI at 36.38 is heavy but not diverging. Structure turning from trend to distribution unless $200+ gets reclaimed quickly. $198 is the last line of support. Break below and short trigger confirms.

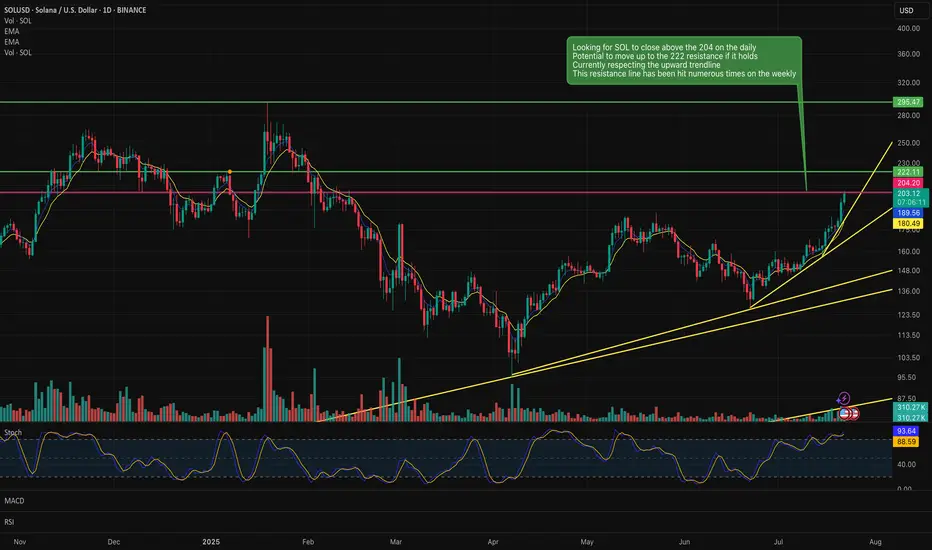
SOL holding above the 204 on the daily could be a long positionSOL is respecting the 204 on the daily and if it holds above it, we could have a long position buying opportunity.
Upside could be too the 222 resistance line if it holds above the 204.
Sentiment seems to be good for Sol and other strong alt coins at the moment. This also supports and upside trajectory.
SOL Traders Begin Taking Profits Despite Bullish RallySolana (SOL) continues to climb, but under the surface, signs of selling pressure are starting to emerge. While price action has been bullish and on-chain activity remains strong, the BBTrend indicator is flashing red — literally. For the past three days, its histogram bars have turned red and gradually increased in size, signaling a rise in mild but persistent selling activity.
The BBTrend, which gauges trend strength using Bollinger Band behavior, shows that SOL is consistently closing near the lower band. This pattern suggests that despite the upward momentum, some traders are quietly taking profits — possibly positioning for a near-term pullback. The rally remains intact for now, but the growing divergence between price and BBTrend behavior hints at early signs of weakening confidence.

Solana: Still bullish about this cryptoHello,
I see the current price is at a great value price for Solana investors. The market has corrected by over 22% over the recent 36 days. The MACD is also showing signs of bullish zero crossover further reinforcing that the price is at a good place for bullish investors to begin coming in.
We urge investors who would like exposure to this coin to consider entering at the current price. Please have your stop loss below the trendline and your short-term target at $191.
Disclosure: I am part of Trade Nation's Influencer program and receive a monthly fee for using their TradingView charts in my analysis.

Solana Macro Cycle Elliotwave countTop has been in for solana since going back to ATH. We are in a bear market retrace rally. Looking to scoop between 50-40 about 1 year from now. Let me know what you think below.
Trading alts on solana right now during the retrace rally, then potentially looking to rotate into radix plays or other coins finishing their wave 2's