Very Bullish!!
Solana chart looks very bullish. The price is currently dropping but I think it is a very healthy correction.
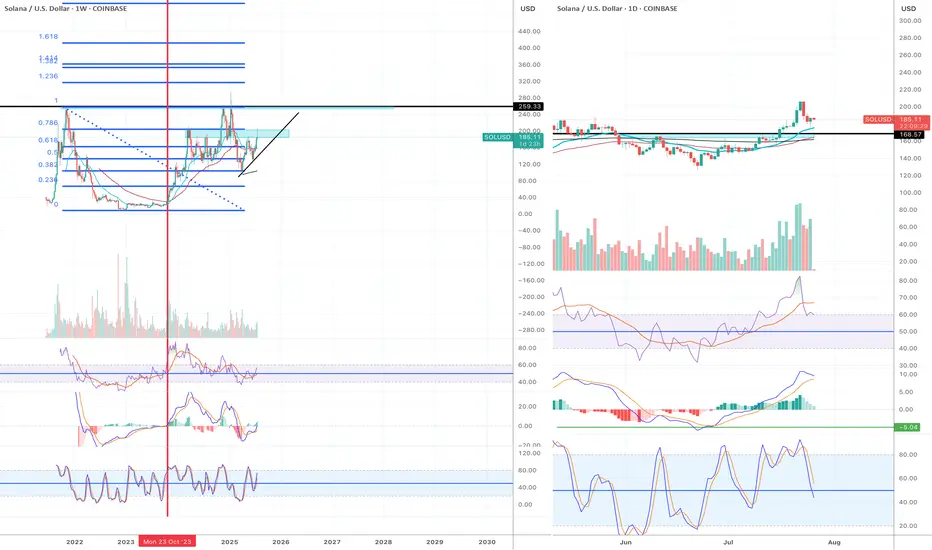
Weekly chart:
1) all momentum indicators just entered the bull zone.
2) The chart is forming higher highs.
Daily:
1) EMA55 finally crossed EMA200. The last time they crossed w
Key facts today
Key stats
About Solana
Solana is a blockchain fairly new to the crypto game, but that's not to say it's not a serious player. Attempting to rival smart-contract titan Ethereum for the NFT and web3 crown, Solana has a strong focus on scalability through its hybrid proof-of-history/proof-of-stake consensus that aims to accommodate a flourishing dApp ecosystem. Its native token SOL has enjoyed the successes of Solana-based NFTs and dApps, but since its inception has also felt the strain of the network’s tendency to experience outages. Although that hasn't stopped it from reaching the top 15 coins by market cap.
Related coins
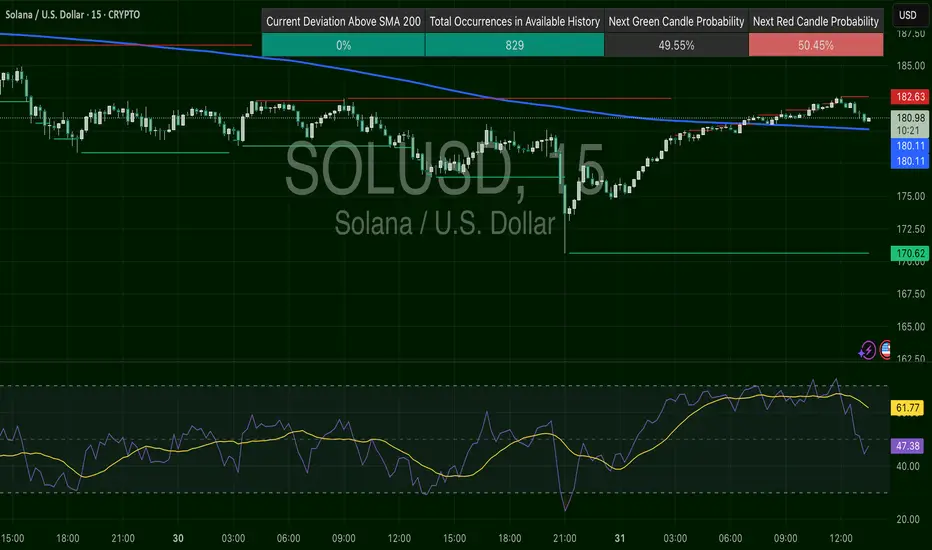
SOLUSD – Faded Highs, Now RetestingSOL recovered off the $170–172 lows and is now testing $182.63 resistance. RSI was high and now cooling off (~47), suggesting momentum is slowing. Still trading just over the 200 SMA, this is a breakout pullback zone. $180.13 is the key level to stay above.
SOLUSD at Major support SOLUSD has reached major support from here we may see a good pullback. Let us see how it plays out.
Solana coin Long setupIn this video I go through the current price action and talk about how the 126$ target level was recently reached for a clean long entry and on the daily timeframe we printed a higher low .
I expand on my thoughts for a continuation to the upside and to retest some higher levels of resistance 180

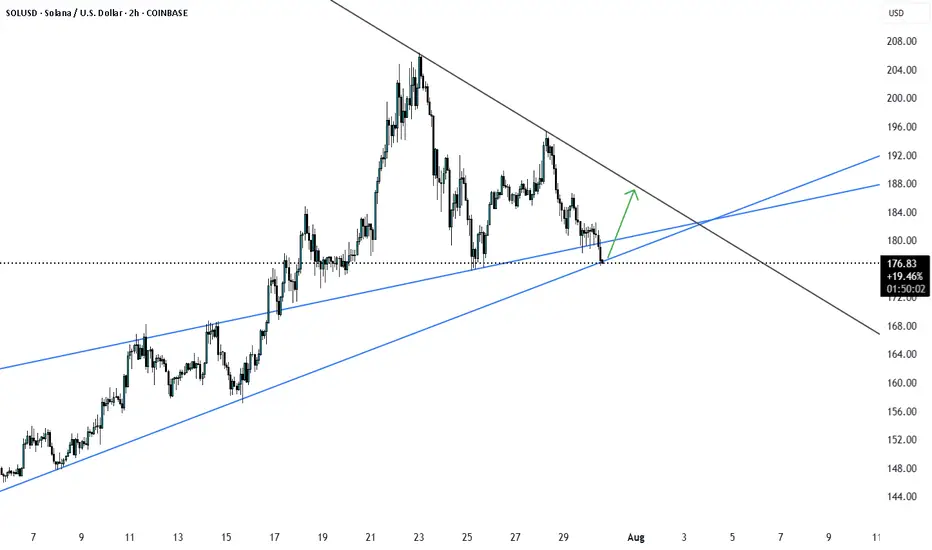
SOLUSD – Recovery Faces Wall at $193SOL broke below $198, hitting a low near $179, confirming the short trigger from the last setup. Since then, it’s building a grind-recovery, reclaiming $189 but stalling at a confluence zone ($191.84 resistance and SMA200 near $193.11). RSI at 59.41 still favors buyers — but SOL needs a clean break

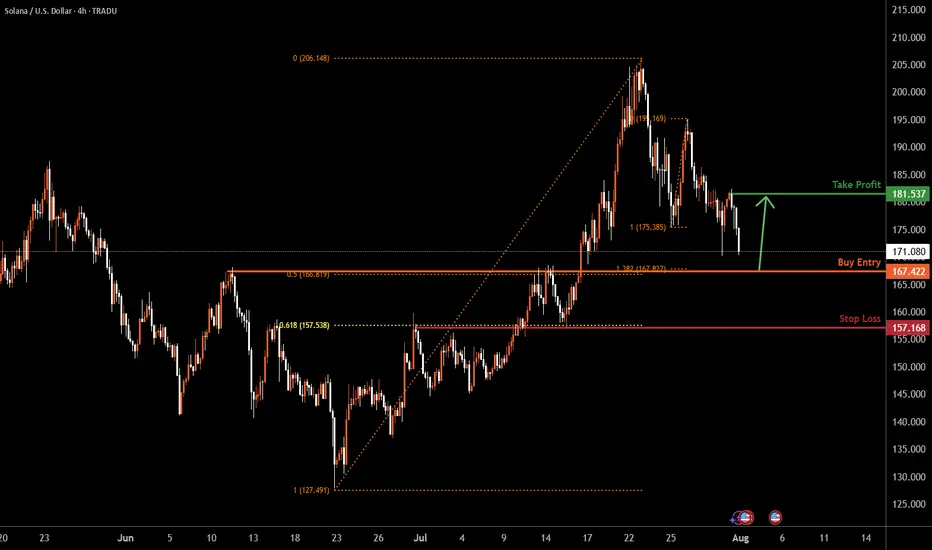
SOLUSD H4 | Bullish bounceBased on the H4 chart analysis, the price could fall to the buy entry, which acts as a pullback support that aligns with the 50% Fibonacci retracement and the 138.2% Fibonacci extension and could bounce to the upside.
Buy entry is at 167.42, which is a pullback support that aligns with the 50% Fibo
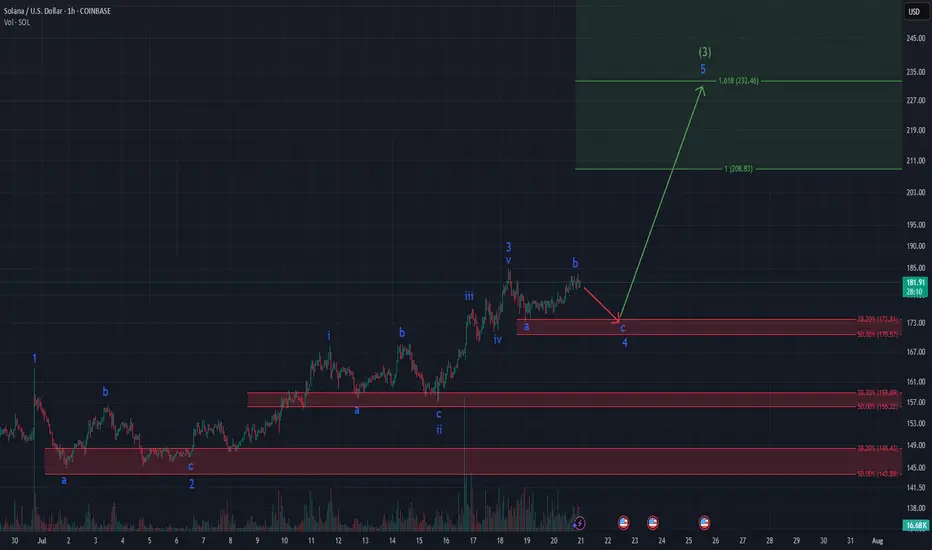
SOLANA ready for Explosion? Textbook Elliott Setup unfoldingSolana – Textbook Elliott Wave Structure Unfolding!
Clear impulsive fractals, textbook ABC corrections, and precise Fibonacci reactions – this 1h chart on CRYPTOCAP:SOL is a dream for any Elliottician.
We’re currently finishing wave C of (4) within a well-formed bullish impulse. Key support lies
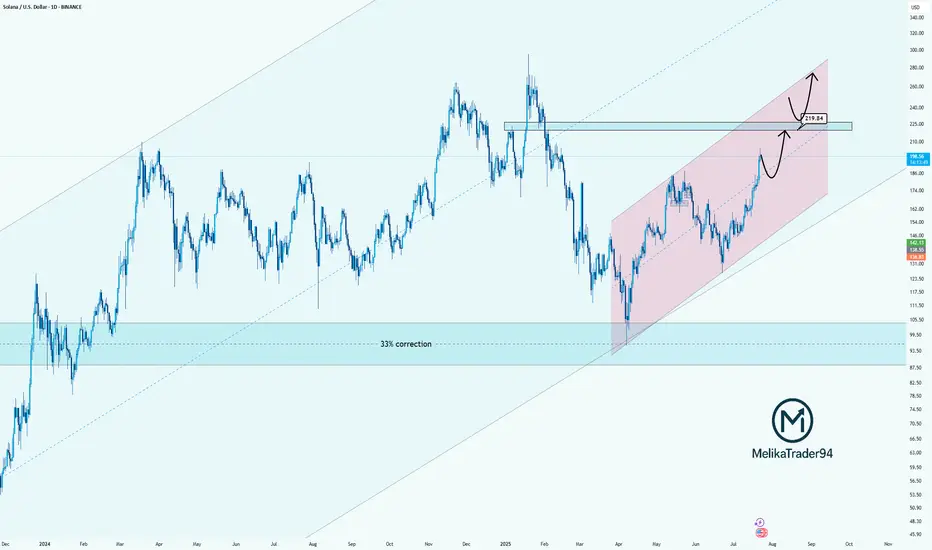
Solana Approaching Key Resistance: watch for $219Hello guys!
Solana has been trending strongly inside a rising parallel channel, recovering steadily after a significant 33% correction. The bullish momentum is clear, and the price is now approaching a key resistance zone near $219.84, which previously acted as a major turning point.
Here’s what I
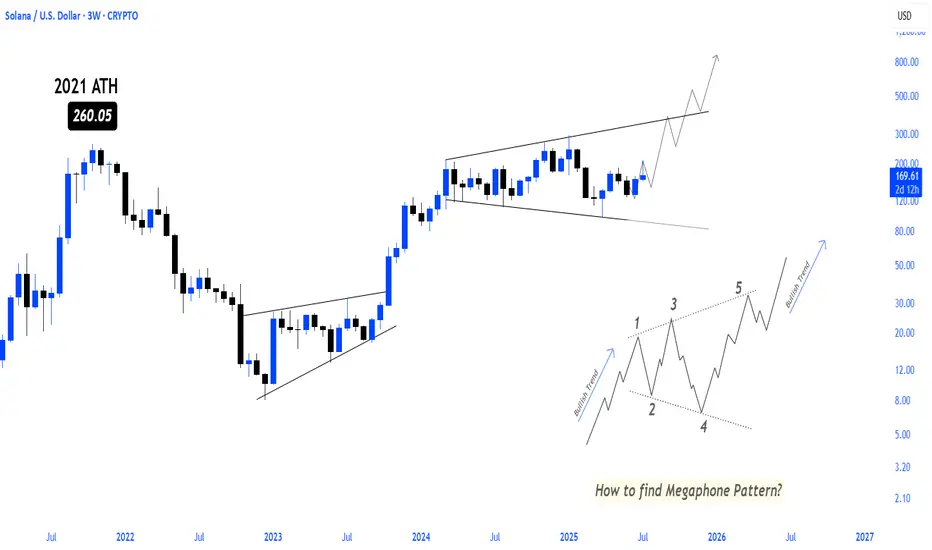
SOLANA BULLISH MEGAPHONE PATTERN LOADING! solana continues to move step by step towards higher levels within the bullish megaphone pattern, which will make movements towards ATH and more inevitable in the coming period
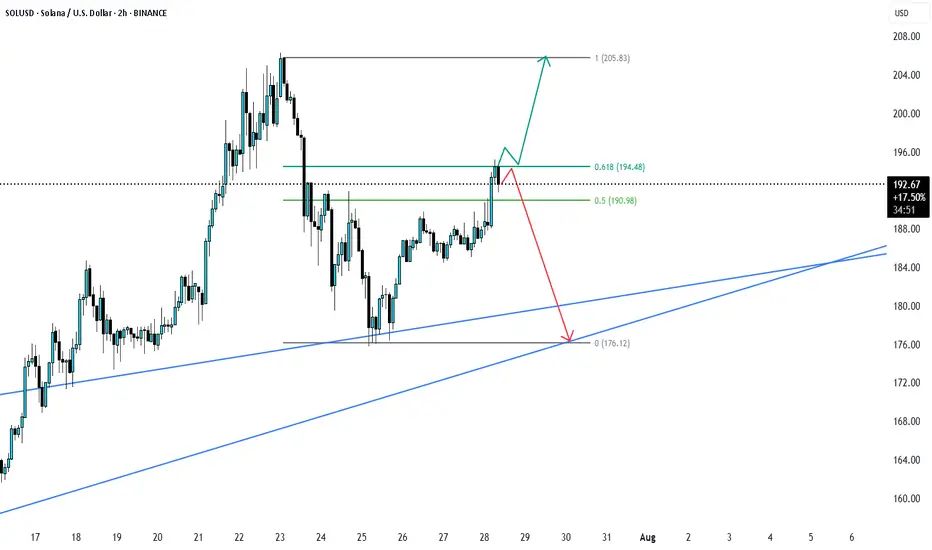
SOLUSD possible scenario reached 0.618 fib levelSOLUSD has reached 0.618 Fib leve of recent swings and if breaks this Fib0.618 is likely to go up if not then can go down. let us see.
See all ideas
Summarizing what the indicators are suggesting.
Oscillators
Neutral
SellBuy
Strong sellStrong buy
Strong sellSellNeutralBuyStrong buy
Oscillators
Neutral
SellBuy
Strong sellStrong buy
Strong sellSellNeutralBuyStrong buy
Summary
Neutral
SellBuy
Strong sellStrong buy
Strong sellSellNeutralBuyStrong buy
Summary
Neutral
SellBuy
Strong sellStrong buy
Strong sellSellNeutralBuyStrong buy
Summary
Neutral
SellBuy
Strong sellStrong buy
Strong sellSellNeutralBuyStrong buy
Moving Averages
Neutral
SellBuy
Strong sellStrong buy
Strong sellSellNeutralBuyStrong buy
Moving Averages
Neutral
SellBuy
Strong sellStrong buy
Strong sellSellNeutralBuyStrong buy
Displays a symbol's price movements over previous years to identify recurring trends.
Curated watchlists where SOLUSD is featured.

Gen 3 crypto: A new day dawns…
25 No. of Symbols

Smart contracts: Make the smart decision
36 No. of Symbols
Staking Coins: Pick up a stake
18 No. of Symbols

Top altcoins: Choose your alternatives carefully
28 No. of Symbols

Up-and-coming crypto: New kids on the block
30 No. of Symbols
See all sparks
Frequently Asked Questions
The current price of Solana (SOL) is 164.08 USD — it has risen 0.03% in the past 24 hours. Try placing this info into the context by checking out what coins are also gaining and losing at the moment and seeing SOL price chart.
The current market capitalization of Solana (SOL) is 88.32 B USD. To see this number in a context check out our list of crypto coins ranked by their market caps or see crypto market cap charts.
Solana (SOL) trading volume in 24 hours is 5.94 B USD. See how often other coins are traded in this list.
Solana price has fallen by −12.90% over the last week, its month performance shows a 6.80% increase, and as for the last year, Solana has decreased by −1.88%. See more dynamics on SOL price chart.
Keep track of coins' changes with our Crypto Coins Heatmap.
Keep track of coins' changes with our Crypto Coins Heatmap.
Solana (SOL) reached its highest price on Jan 19, 2025 — it amounted to 295.00 USD. Find more insights on the SOL price chart.
See the list of crypto gainers and choose what best fits your strategy.
See the list of crypto gainers and choose what best fits your strategy.
Solana (SOL) reached the lowest price of 8.00 USD on Dec 29, 2022. View more Solana dynamics on the price chart.
See the list of crypto losers to find unexpected opportunities.
See the list of crypto losers to find unexpected opportunities.
The current circulating supply of Solana (SOL) is 606.62 M USD. To get a wider picture you can check out our list of coins with the highest circulating supply, as well as the ones with the lowest number of tokens in circulation.
The safest choice when buying SOL is to go to a well-known crypto exchange. Some of the popular names are Binance, Coinbase, Kraken. But you'll have to find a reliable broker and create an account first. You can trade SOL right from TradingView charts — just choose a broker and connect to your account.
Crypto markets are famous for their volatility, so one should study all the available stats before adding crypto assets to their portfolio. Very often it's technical analysis that comes in handy. We prepared technical ratings for Solana (SOL): today its technical analysis shows the neutral signal, and according to the 1 week rating SOL shows the buy signal. And you'd better dig deeper and study 1 month rating too — it's buy. Find inspiration in Solana trading ideas and keep track of what's moving crypto markets with our crypto news feed.
Solana (SOL) is just as reliable as any other crypto asset — this corner of the world market is highly volatile. Today, for instance, Solana is estimated as 2.13% volatile. The only thing it means is that you must prepare and examine all available information before making a decision. And if you're not sure about Solana, you can find more inspiration in our curated watchlists.
You can discuss Solana (SOL) with other users in our public chats, Minds or in the comments to Ideas.